world.wikisort.org - USA
St. Francois County (/ˈfrænsɪs/) is a county located in the Lead Belt region in the U.S. state of Missouri. As of the 2020 census, the population was 66,922.[1] The largest city and county seat is Farmington.[2] The county was officially organized on December 19, 1821. It was named after the St. Francis River. The origin of the river's name is unclear. It might refer to St. Francis of Assisi.[3] Another possibility is that Jacques Marquette, a Jesuit who explored the region in 1673, named the river for the Jesuit missionary Francis Xavier. Marquette had spent some time at the mission of St. Francois Xavier before his voyage and, as a Jesuit, was unlikely to have given the river a name honoring the Franciscans.[4]
This article uses bare URLs, which are uninformative and vulnerable to link rot. (June 2022) |
Saint Francois County | |
|---|---|
U.S. county | |
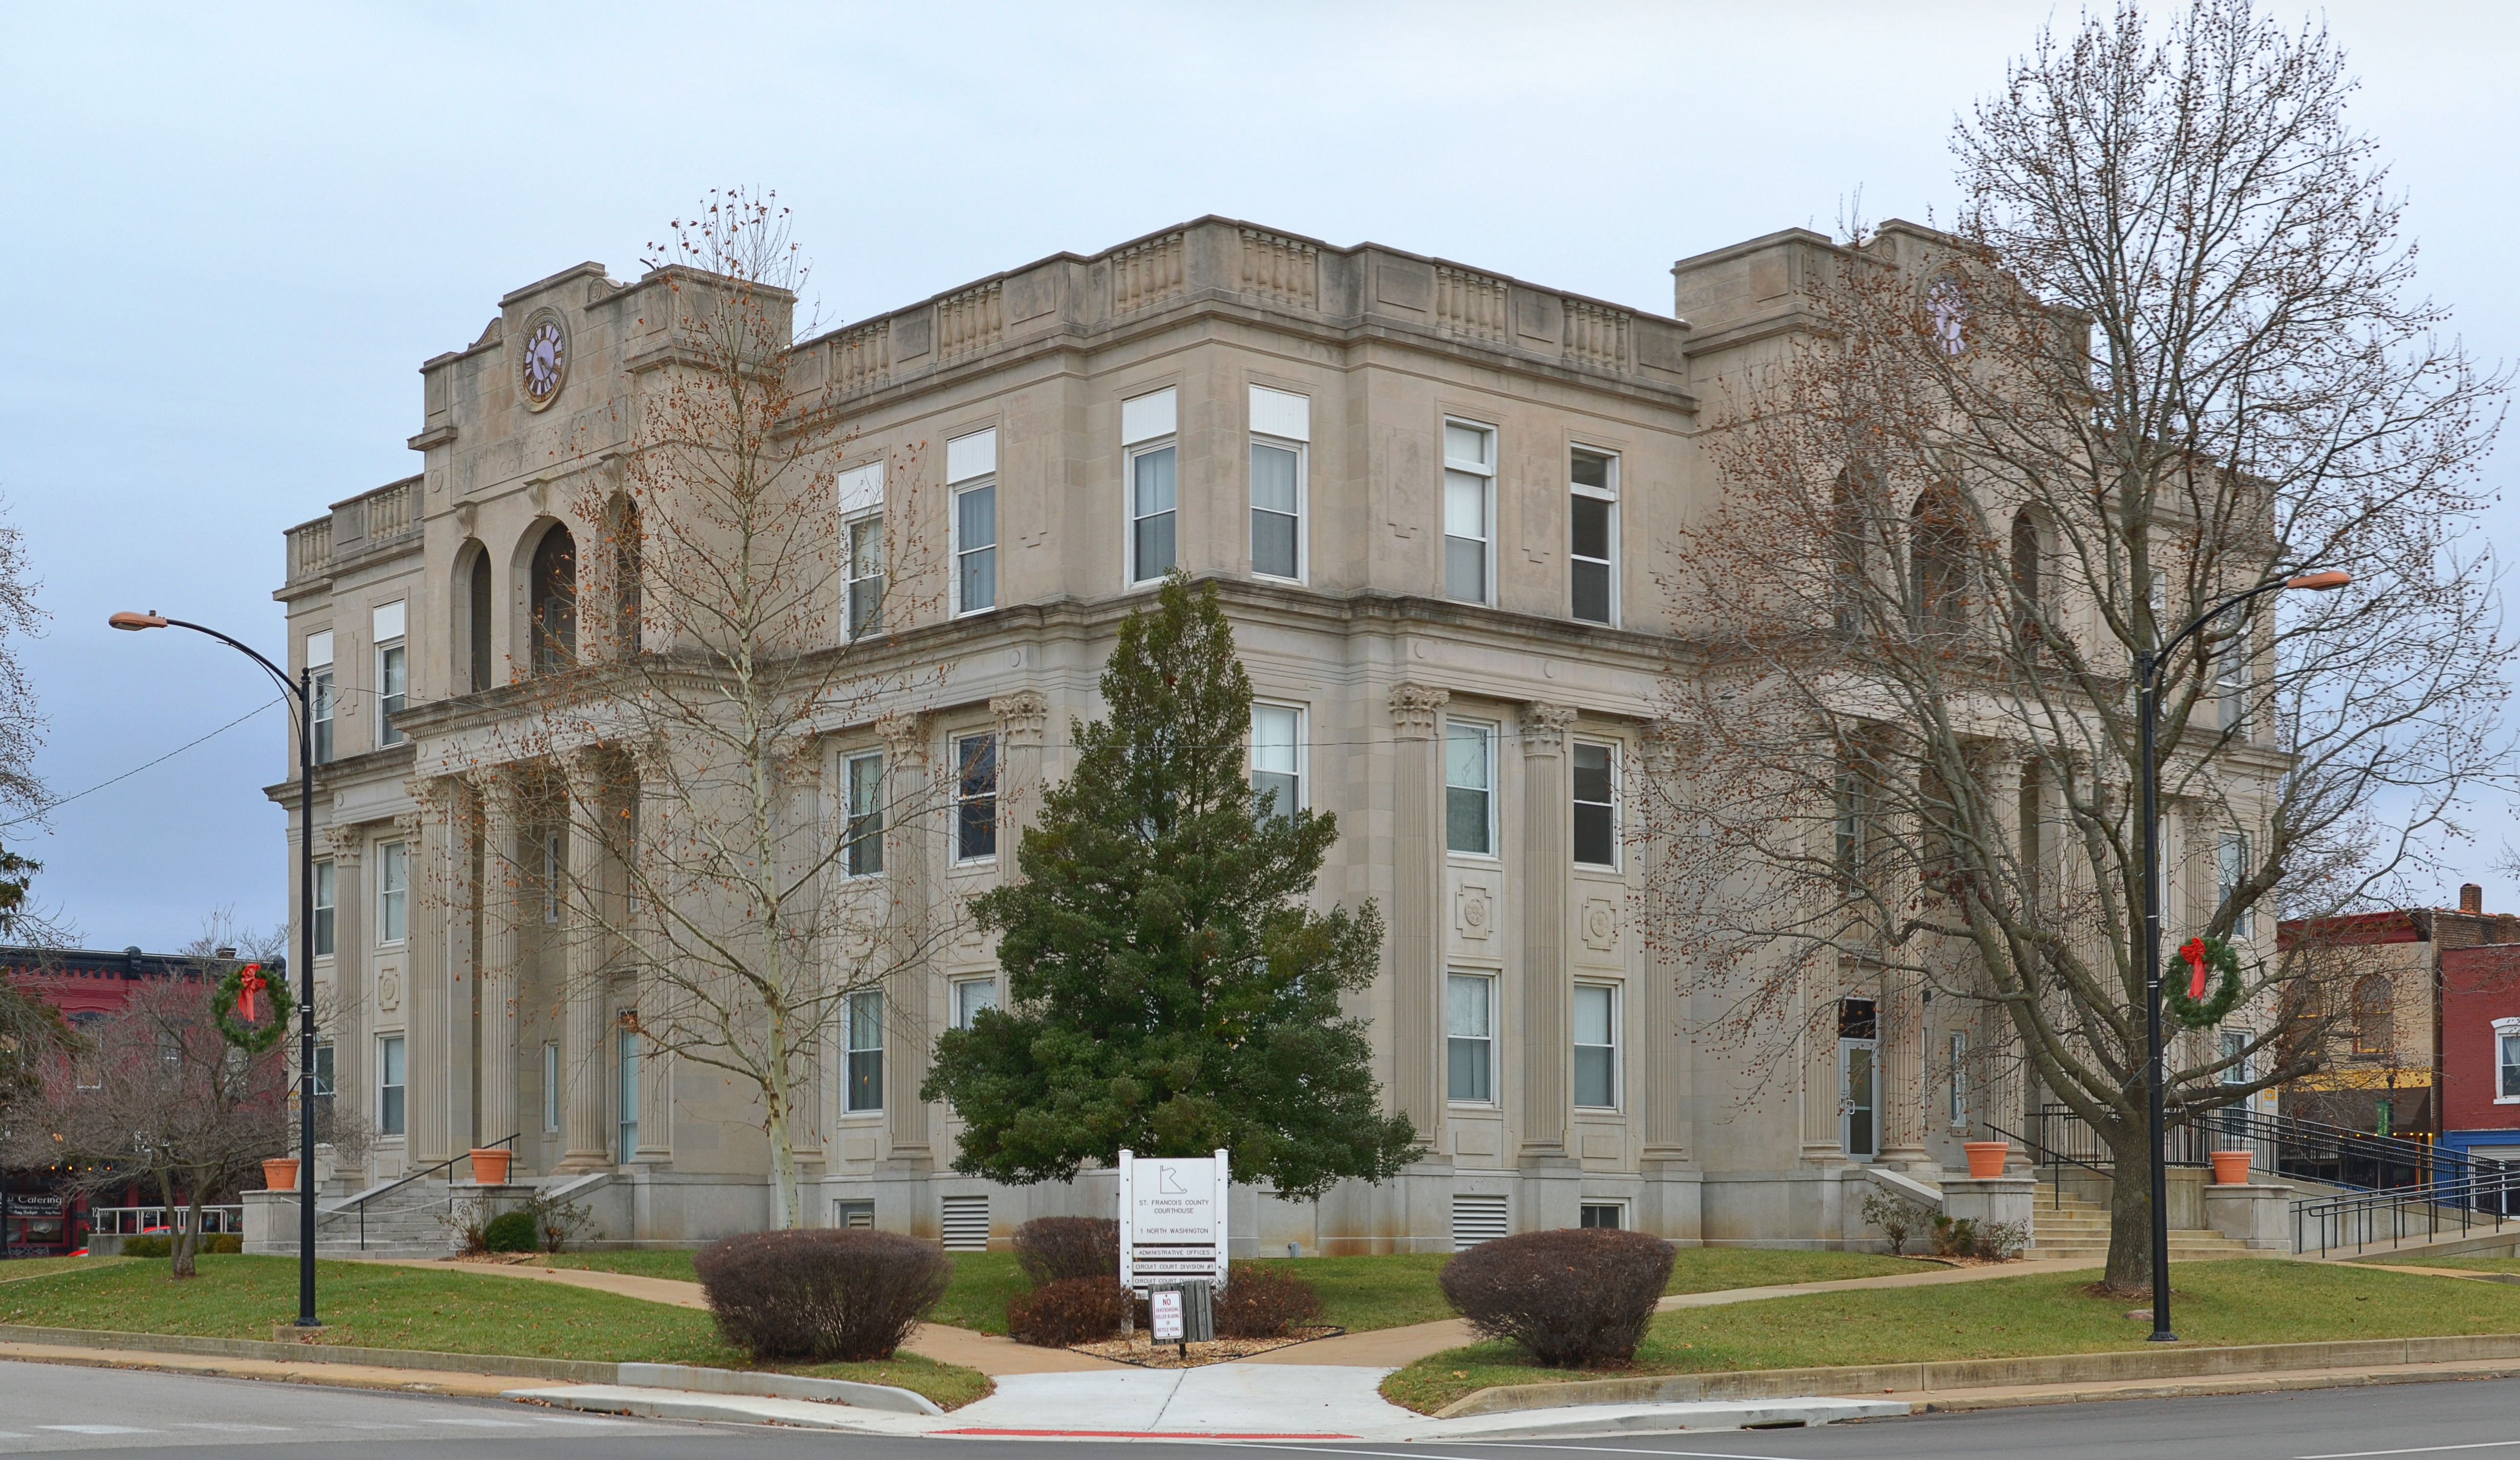 St. Francois County Courthouse in Farmington | |
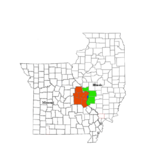
 Location within the U.S. state of Missouri | |
 Missouri's location within the U.S. | |
| Coordinates: 37°46′55″N 90°25′20″W | |
| Country | |
| State | |
| Founded | December 19, 1821 |
| Named for | St. Francis River |
| Seat | Farmington |
| Largest city | Farmington |
| Area | |
| • Total | 455 sq mi (1,180 km2) |
| • Land | 452 sq mi (1,170 km2) |
| • Water | 2.8 sq mi (7 km2) 0.6% |
| Population (2020) | |
| • Total | 66,922 |
| • Density | 150/sq mi (57/km2) |
| Time zone | UTC−6 (Central) |
| • Summer (DST) | UTC−5 (CDT) |
| Congressional district | 8th |
| Website | www |
St. Francois County comprises the Farmington, MO Micropolitan Statistical Area, which is also included in the St. Louis-St. Charles-Farmington, MO-IL Combined Statistical Area.
Adjacent counties
- Jefferson County (north)
- Ste. Genevieve County (east)
- Perry County (southeast)
- Madison County (south)
- Iron County (southwest)
- Washington County (west)
Major highways
 U.S. Route 67
 Route 8
 Route 32
 Route 47
National protected area
- Mark Twain National Forest (part)
Demographics
| Historical population | |||
|---|---|---|---|
| Census | Pop. | %± | |
| 1830 | 2,366 | — | |
| 1840 | 3,211 | 35.7% | |
| 1850 | 4,964 | 54.6% | |
| 1860 | 7,249 | 46.0% | |
| 1870 | 9,742 | 34.4% | |
| 1880 | 13,822 | 41.9% | |
| 1890 | 17,347 | 25.5% | |
| 1900 | 24,051 | 38.6% | |
| 1910 | 35,738 | 48.6% | |
| 1920 | 31,403 | −12.1% | |
| 1930 | 35,832 | 14.1% | |
| 1940 | 35,950 | 0.3% | |
| 1950 | 35,276 | −1.9% | |
| 1960 | 36,516 | 3.5% | |
| 1970 | 36,818 | 0.8% | |
| 1980 | 42,600 | 15.7% | |
| 1990 | 48,904 | 14.8% | |
| 2000 | 55,641 | 13.8% | |
| 2010 | 65,359 | 17.5% | |
| 2020 | 66,922 | 2.4% | |
| U.S. Decennial Census[5] 1790-1960[6] 1900-1990[7] 1990-2000[8] 2010-2015[9] | |||
As of the census of 2000, there were 55,641 people, 20,793 households, and 14,659 families residing in the county. The population density was 124 inhabitants per square mile (48/km2). There were 24,449 housing units at an average density of 54 per square mile (21/km2). The racial makeup of the county was 96.14% White, 2.02% African American, 0.35% Native American, 0.31% Asian, 0.02% Pacific Islander, 0.23% from other races, and 0.92% from two or more races. Hispanic or Latino of any race were 0.80% of the population.
There were 20,793 households, out of which 32.60% had children under the age of 18 living with them, 54.90% were married couples living together, 11.30% had a female householder with no husband present, and 29.50% were non-families. 24.90% of all households were made up of individuals, and 11.20% had someone living alone who was 65 years of age or older. The average household size was 2.48 and the average family size was 2.94.
In the county, the population was spread out, with 24.00% under the age of 18, 9.20% from 18 to 24, 29.40% from 25 to 44, 22.50% from 45 to 64, and 14.90% who were 65 years of age or older. The median age was 37 years. For every 100 females there were 103.30 males. For every 100 females age 18 and over, there were 101.90 males.
The median income for a household in the county was $39,551, and the median income for a family was $47,923. Males had a median income of $29,961 versus $19,412 for females. The per capita income for the county was $19,047. Approximately 14.90% of the population and 11.00% of families were below the poverty line, including 19.80% under the age of 18 and 11.50% over the age of 65.
Religion
According to the Association of Religion Data Archives County Membership Report (2000), St. Francois County is a part of the Bible Belt with evangelical Protestantism being the majority religion. The most predominant denominations among residents in St. Francois County who adhere to a religion are Southern Baptists (45.48%), Roman Catholics (14.94%), and Methodists (8.37%). There is also a small Orthodox Christian presence in the county. Nativity of the Holy Virgin Mary Orthodox Church is in Desloge, MO.[10]
Catholic Churches in the county are Immaculate Conception in Park Hills, St. Joseph in Farmington, St. Joseph in Bonne Terre, St. John in Bismarck, and St. Anne in French Village.[11]
2020 Census
| Race | Num. | Perc. |
|---|---|---|
| White (NH) | 59,474 | 88.9% |
| Black or African American (NH) | 2,645 | 4% |
| Native American (NH) | 192 | 0.3% |
| Asian (NH) | 403 | 0.6% |
| Pacific Islander (NH) | 21 | 0.03% |
| Other/Mixed (NH) | 3,098 | 4.63% |
| Hispanic or Latino | 1,089 | 1.63% |
Politics
Local
The Republican Party predominantly controls politics at the local level in St. Francois County. Republicans hold all but two of the elected positions in the county.
| St. Francois County, Missouri | |||
|---|---|---|---|
| Elected countywide officials | |||
| Assessor | Eric Dugal | Republican | |
| Auditor | Louie Seiberlich | Republican | |
| Circuit Clerk | Vicki J. Weible | Democratic | |
| County Clerk | Kevin Engler | Republican | |
| Collector | Pamela J. Williams | Democratic | |
| Commissioner (Presiding) | Harold Gallaher | Republican | |
| Commissioner (District 1) | Kary Buckley | Republican | |
| Commissioner (District 2) | David Kater | Republican | |
| Coroner | Jason Coplin | Republican | |
| Prosecuting Attorney | Melissa L. Gilliam | Republican | |
| Public Administrator | Gary Matheny | Republican | |
| Recorder | Jay Graf | Republican | |
| Sheriff | Daniel R. Bullock | Republican | |
| Treasurer | Parks G. Peterson | Republican | |
State
St. Francois County is divided into three legislative districts in the Missouri House of Representatives.
- District 115 — Currently represented by Cyndi Buchheit-Courtway (R-Festus). It consists of the northern parts of the county, including Blackwell, French Village, and part of Park Hills.
| Party | Candidate | Votes | % | ±% | |
|---|---|---|---|---|---|
| Republican | Cyndi Buchheit Courtway | 3,783 | 74.73% | ||
| Democratic | Cynthia Nugent | 1,272 | 25.13% | ||
| Party | Candidate | Votes | % | ±% | |
|---|---|---|---|---|---|
| Republican | Elaine Gannon | 3,211 | 98.14% | ||
| Party | Candidate | Votes | % | ±% | |
|---|---|---|---|---|---|
| Republican | Elaine Gannon | 3,010 | 68.63% | +3.40 | |
| Democratic | Barbara Stocker | 1,196 | 27.27% | -2.98 | |
| Libertarian | Charles Bigelow | 180 | 4.10% | +4.10 | |
| Party | Candidate | Votes | % | ±% | |
|---|---|---|---|---|---|
| Republican | Elaine Gannon | 1,486 | 65.23% | +13.26 | |
| Democratic | Dan Darian | 689 | 30.25% | -17.78 | |
| Constitution | Jerry Dollar Jr. | 103 | 4.52% | +4.52 | |
| Party | Candidate | Votes | % | ±% | |
|---|---|---|---|---|---|
| Republican | Elaine Gannon | 2,106 | 51.97% | ||
| Democratic | Rich McCane | 1,946 | 48.03% | ||
- District 116 — Currently represented by Dale Wright (politician) (R-Farmington). It consists of the southeastern section of the county, including part of Farmington.
| Party | Candidate | Votes | % | ±% | |
|---|---|---|---|---|---|
| Republican | Dale Wright | 6,687 | 97.96% | ||
| Party | Candidate | Votes | % | ±% | |
|---|---|---|---|---|---|
| Republican | Dale Wright | 4,374 | 70.12% | ||
| Democratic | Bill Kraemer | 1,855 | 29.74 | ||
| Party | Candidate | Votes | % | ±% | |
|---|---|---|---|---|---|
| Republican | Kevin Engler | 5,590 | 100.00% | ||
| Party | Candidate | Votes | % | ±% | |
|---|---|---|---|---|---|
| Republican | Kevin Engler | 2,826 | 100.00% | ||
| Party | Candidate | Votes | % | ±% | |
|---|---|---|---|---|---|
| Republican | Kevin Engler | 4,881 | 100.00% | ||
- District 117 — Currently represented by Mike Henderson (R-Bonne Terre). It consists of the western parts of the county and includes the communities of Bismarck, Bonne Terre, Desloge, Doe Run, Iron Mountain Lake, Leadington, Leadwood, and parts of Farmington and Park Hills.
| Party | Candidate | Votes | % | ±% | |
|---|---|---|---|---|---|
| Republican | Mike Henderson | 10,485 | 73.21% | ||
| Democratic | Tony Dorsett | 3,817 | 26.65% | ||
| Party | Candidate | Votes | % | ±% | |
|---|---|---|---|---|---|
| Republican | Mike Henderson | 8,169 | 71.92% | ||
| Democratic | Kayla Chick | 3,168 | 27.89% | ||
| Party | Candidate | Votes | % | ±% | |
|---|---|---|---|---|---|
| Republican | Mike Henderson | 7,302 | 56.74% | +56.74 | |
| Democratic | Travis Barnes | 5,567 | 43.26% | -56.74 | |
| Party | Candidate | Votes | % | ±% | |
|---|---|---|---|---|---|
| Democratic | Linda Black | 5,081 | 100.00% | ||
| Party | Candidate | Votes | % | ±% | |
|---|---|---|---|---|---|
| Democratic | Linda Black | 9,704 | 100.00% | ||
All of St. Francois County is a part of Missouri's 3rd District in the Missouri Senate and is currently represented by Elaine Gannon (R-De Soto).
| Party | Candidate | Votes | % | ±% | |
|---|---|---|---|---|---|
| Republican | Elaine Freeman Gannon | 23,058 | 97.65% | ||
| Party | Candidate | Votes | % | ±% | |
|---|---|---|---|---|---|
| Republican | Gary Romine | 18,992 | 81.79% | +21.62 | |
| Green | Edward R. Weissler | 4,229 | 18.21% | +18.21 | |
| Party | Candidate | Votes | % | ±% | |
|---|---|---|---|---|---|
| Republican | Gary Romine | 13,329 | 60.17% | ||
| Democratic | Joseph Fallert, Jr. | 8,823 | 39.83% | ||
| Year | Republican | Democratic | Third Parties |
|---|---|---|---|
| 2020 | 69.37% 19,258 | 27.67% 7,682 | 2.96% 823 |
| 2016 | 58.51% 14,433 | 38.20% 9,424 | 3.29% 811 |
| 2012 | 44.17% 9,965 | 52.88% 11,930 | 2.94% 664 |
| 2008 | 34.55% 8,418 | 63.49% 15,468 | 1.96% 478 |
| 2004 | 52.14% 11,903 | 46.43% 10,601 | 1.43% 327 |
| 2000 | 46.42% 8,712 | 50.22% 9,425 | 3.36% 632 |
| 1996 | 40.23% 7,192 | 57.19% 10,224 | 2.58% 461 |
| 1992 | 39.44% 7,350 | 60.56% 11,287 | 2.58% 461 |
| 1988 | 58.28% 9,401 | 40.94% 6,604 | 0.77% 125 |
| 1984 | 52.10% 8,777 | 47.90% 8,068 | 0.00% 0 |
| 1980 | 51.93% 8,797 | 47.89% 8,113 | 0.18% 30 |
| 1976 | 47.82% 7,569 | 52.13% 8,251 | 0.04% 7 |
Federal
| Party | Candidate | Votes | % | ±% | |
|---|---|---|---|---|---|
| Republican | Josh Hawley | 13,111 | 59.98% | ||
| Democratic | Claire McCaskill | 7,770 | 35.54% | ||
| Libertarian | Japheth Campbell | 342 | 1.56% | ||
| Green | Jo Crain | 157 | 0.72% | ||
| Independent | Craig O'Dear | 447 | 2.04% | ||
| Party | Candidate | Votes | % | ±% | |
|---|---|---|---|---|---|
| Republican | Roy Blunt | 13,110 | 53.32% | +12.57 | |
| Democratic | Jason Kander | 10,117 | 41.15% | -11.23 | |
| Libertarian | Jonathan Dine | 661 | 2.69% | -4.18 | |
| Green | Johnathan McFarland | 431 | 1.75% | +1.75 | |
| Constitution | Fred Ryman | 269 | 1.09% | +1.09 | |
| Party | Candidate | Votes | % | ±% | |
|---|---|---|---|---|---|
| Republican | Todd Akin | 9,142 | 40.75% | ||
| Democratic | Claire McCaskill | 11,751 | 52.38% | ||
| Libertarian | Jonathan Dine | 1,540 | 6.87% | ||
St. Francois County is included in Missouri's 8th Congressional District and is currently represented by Jason T. Smith (R-Salem) in the U.S. House of Representatives. Smith won a special election on Tuesday, June 4, 2013, to finish out the remaining term of U.S. Representative Jo Ann Emerson (R-Cape Girardeau). Emerson announced her resignation a month after being reelected with over 70 percent of the vote in the district. She resigned to become CEO of the National Rural Electric Cooperative.
| Party | Candidate | Votes | % | ±% | |
|---|---|---|---|---|---|
| Republican | Jason T. Smith | 19,505 | 71.53 | ||
| Democratic | Kathy Ellis | 7,170 | 26.30 | ||
| Libertarian | Tom Schmitz | 576 | 2.11 | ||
| Party | Candidate | Votes | % | ±% | |
|---|---|---|---|---|---|
| Republican | Jason T. Smith | 14,051 | 65.16% | ||
| Democratic | Kathy Ellis | 7,052 | 32.70% | ||
| Libertarian | Jonathan Shell | 444 | 2.06% | ||
| Party | Candidate | Votes | % | ±% | |
|---|---|---|---|---|---|
| Republican | Jason T. Smith | 16,309 | 68.07% | +8.72 | |
| Democratic | Dave Cowell | 6,933 | 28.94% | -1.86 | |
| Libertarian | Jonathan Shell | 718 | 3.00% | +0.66 | |
| Party | Candidate | Votes | % | ±% | |
|---|---|---|---|---|---|
| Republican | Jason T. Smith | 7,317 | 59.35% | -2.46 | |
| Democratic | Barbara Stocker | 3,798 | 30.80% | -2.64 | |
| Libertarian | Rick Vandeven | 288 | 2.34% | +1.27 | |
| Constitution | Doug Enyart | 465 | 3.77% | +0.50 | |
| Independent | Terry Hampton | 461 | 3.74% | +3.74 | |
| Party | Candidate | Votes | % | ±% | |
|---|---|---|---|---|---|
| Republican | Jason T. Smith | 1,850 | 61.81% | -7.50 | |
| Democratic | Steve Hodges | 1,001 | 33.44% | +5.73 | |
| Libertarian | Bill Slantz | 32 | 1.07% | -1.91 | |
| Constitution | Doug Enyart | 98 | 3.27% | +3.27 | |
| Write-In | Wayne L. Byington | 12 | 0.40% | +0.40 | |
| Party | Candidate | Votes | % | ±% | |
|---|---|---|---|---|---|
| Republican | Jo Ann Emerson | 15,423 | 69.31% | ||
| Democratic | Jack Rushin | 6,166 | 27.71% | ||
| Libertarian | Rick Vandeven | 664 | 2.98% | ||
| Year | Republican | Democratic | Third party | |||
|---|---|---|---|---|---|---|
| No. | % | No. | % | No. | % | |
| 2020 | 20,511 | 73.25% | 7,044 | 25.16% | 446 | 1.59% |
| 2016 | 17,468 | 70.10% | 6,250 | 25.08% | 1,202 | 4.82% |
| 2012 | 13,248 | 58.35% | 8,829 | 38.89% | 628 | 2.77% |
| 2008 | 12,660 | 51.57% | 11,540 | 47.01% | 350 | 1.43% |
| 2004 | 12,087 | 52.71% | 10,748 | 46.87% | 98 | 0.43% |
| 2000 | 9,327 | 49.50% | 9,075 | 48.17% | 439 | 2.33% |
| 1996 | 6,200 | 34.98% | 9,034 | 50.96% | 2,492 | 14.06% |
| 1992 | 5,889 | 31.08% | 9,367 | 49.44% | 3,691 | 19.48% |
| 1988 | 7,923 | 49.13% | 8,158 | 50.59% | 46 | 0.29% |
| 1984 | 9,792 | 57.84% | 7,137 | 42.16% | 0 | 0.00% |
| 1980 | 8,914 | 52.70% | 7,495 | 44.31% | 507 | 3.00% |
| 1976 | 7,002 | 44.01% | 8,852 | 55.63% | 57 | 0.36% |
| 1972 | 8,812 | 65.42% | 4,658 | 34.58% | 0 | 0.00% |
| 1968 | 7,492 | 47.60% | 6,379 | 40.53% | 1,867 | 11.86% |
| 1964 | 5,690 | 35.00% | 10,567 | 65.00% | 0 | 0.00% |
| 1960 | 10,131 | 58.44% | 7,205 | 41.56% | 0 | 0.00% |
| 1956 | 9,968 | 56.85% | 7,566 | 43.15% | 0 | 0.00% |
| 1952 | 9,672 | 54.55% | 8,040 | 45.35% | 17 | 0.10% |
| 1948 | 6,234 | 46.03% | 7,276 | 53.73% | 32 | 0.24% |
| 1944 | 7,320 | 52.00% | 6,745 | 47.92% | 11 | 0.08% |
| 1940 | 8,687 | 51.55% | 8,132 | 48.26% | 32 | 0.19% |
| 1936 | 7,271 | 47.79% | 7,876 | 51.77% | 66 | 0.43% |
| 1932 | 6,017 | 43.59% | 7,613 | 55.15% | 174 | 1.26% |
| 1928 | 9,040 | 68.34% | 4,171 | 31.53% | 17 | 0.13% |
| 1924 | 6,117 | 51.16% | 5,542 | 46.35% | 297 | 2.48% |
| 1920 | 5,504 | 49.86% | 5,300 | 48.01% | 235 | 2.13% |
| 1916 | 3,015 | 43.79% | 3,675 | 53.38% | 195 | 2.83% |
| 1912 | 2,305 | 37.03% | 2,786 | 44.76% | 1,134 | 18.22% |
| 1908 | 3,260 | 48.56% | 2,942 | 43.83% | 511 | 7.61% |
| 1904 | 2,894 | 51.25% | 2,615 | 46.31% | 138 | 2.44% |
| 1900 | 2,295 | 45.30% | 2,707 | 53.43% | 64 | 1.26% |
| 1896 | 1,664 | 42.37% | 2,245 | 57.17% | 18 | 0.46% |
| 1892 | 1,253 | 36.53% | 2,141 | 62.42% | 36 | 1.05% |
| 1888 | 1,445 | 38.44% | 2,214 | 58.90% | 100 | 2.66% |
Covid-19 controversy
During the 2020 COVID-19 pandemic, the head of the St. Francois County Public Health Department described being driven to resign from her position by residents who refused to "accept the reality of the pandemic" and made “cowardly“ anonymous threats against her and her family.[24]
Education
Of adults 25 years of age and older in St. Francois County, 72.4% possess a high school diploma or higher while 10.2% hold a bachelor's degree or higher as their highest educational attainment.
Public schools
- Bismarck R-V School District – Bismarck
- Bismarck Elementary School (PK–06)
- Bismarck High School (07–12)
- Farmington R-VII School District – Farmington
- Jefferson Elementary School (01–04)
- Lincoln Intermediate School (05–06)
- Roosevelt Elementary School (01–04)
- Truman Kindergarten (K)
- Washington-Franklin Elementary School (01–04)
- W.L. Johns Early Childhood Center (PK)
- Farmington Middle School (07–08)
- Farmington High School (09–12)
- North St. Francois County R-I School District – Bonne Terre
- North St. Francois County Primary School (PK–02) – Bonne Terre
- North St. Francois County Parkside Elementary School (03–04) – Desloge
- North St. Francois County Intermediate School (05–06) – Desloge
- North St. Francois County Middle School (07–08) – Desloge
- North St. Francois County High School (09–12) – Bonne Terre
- St. Francois County Central R-III School District – Park Hills
- Park Hills Central Elementary School (K–02)
- West Elementary School (03–05)
- Park Hills Central Middle School (06–08)
- Park Hills Central High School (09–12)
- West St. Francois County R-IV School District – Leadwood
- West St. Francois County Elementary School (PK–05) – Park Hills
- West St. Francois County Middle School (06–08) – Leadwood
- West St. Francois County High School (09–12) – Park Hills
Private schools
- St. Paul Lutheran School – Farmington – (PK–12) – Lutheran Church–Missouri Synod
- St. Joseph School – Farmington – (K–08) – Roman Catholic
- St. Joseph Elementary School – Bonne Terre – (PK–06) – Roman Catholic
Vocational-technical and other schools
- Juvenile Detention Center – Farmington – (04–12)
- Midwest Learning Center – Farmington – (04–12)
- Unitec Career Center – Bonne Terre – (10–12)
Colleges and universities
- Mineral Area College – Park Hills – A public, two-year community college.
Public libraries
- Bonne Terre Memorial Library[25]
Communities
Cities
- Bismarck
- Bonne Terre
- Desloge
- Farmington (county seat)
- Iron Mountain Lake
- Leadington
- Leadwood
- Park Hills
Census-designated places
Other unincorporated communities
- Blackwell
- Cross Roads
- De Lassus
- French Village
- Gumbo
- Halifax
- Hamilton Town
- Hazel Run
- Hurryville
- Iron Mountain
- Koester
- Libertyville
- Loughboro
- Mineral City
- Middlebrook
- Mitchell
- Ogborn
- Old Mines
- Rock Springs
- Settletown
- Silver Springs
- Syenite
Former community
- Haggai
See also
- National Register of Historic Places listings in St. Francois County, Missouri
References
![]() This article incorporates text from Campbell's Gazetteer of Missouri, by Robert A. Campbell, a publication from 1874, now in the public domain in the United States.
This article incorporates text from Campbell's Gazetteer of Missouri, by Robert A. Campbell, a publication from 1874, now in the public domain in the United States.
- "QuickFacts St. Francois County, Missouri; United States". United States Census Bureau. Retrieved January 27, 2022.
- "Find a County". National Association of Counties. Retrieved June 7, 2011.
- Eaton, David Wolfe (1918). How Missouri Counties, Towns and Streams Were Named. The State Historical Society of Missouri. p. 358.
- St. Francois County, Missouri Place Names Archived 2011-07-20 at the Wayback Machine, Western Historical Manuscript Collection
- "U.S. Decennial Census". United States Census Bureau. Retrieved November 20, 2014.
- "Historical Census Browser". University of Virginia Library. Retrieved November 20, 2014.
- "Population of Counties by Decennial Census: 1900 to 1990". United States Census Bureau. Retrieved November 20, 2014.
- "Census 2000 PHC-T-4. Ranking Tables for Counties: 1990 and 2000" (PDF). United States Census Bureau. Retrieved November 20, 2014.
- "State & County QuickFacts". United States Census Bureau. Retrieved September 14, 2013.
- "Parishes - Nativity of the Holy Virgin Mary Church". oca.org. Retrieved March 26, 2018.
- "Archdiocese of St. Louis – The Roman Catholic Church in Saint Louis, MO". archstl.org. Retrieved March 26, 2018.
- "P2 HISPANIC OR LATINO, AND NOT HISPANIC OR LATINO BY RACE – 2020: DEC Redistricting Data (PL 94-171) – St. Francois County, Missouri".
- https://sfcgov.org/download/clerk/elections/results/election_results/206_PALL_Official_Election_Summary_2.pdf [bare URL PDF]
- "Election Results".
- https://sfcgov.org/download/clerk/elections/results/election_results/206_PALL_Official_Election_Summary_2.pdf [bare URL PDF]
- https://sfcgov.org/download/clerk/elections/results/election_results/archived_results/2011-2019/NOVEMBER2018SOVC082720211430281.pdf [bare URL PDF]
- https://sfcgov.org/download/clerk/elections/results/election_results/206_PALL_Official_Election_Summary_2.pdf [bare URL PDF]
- https://sfcgov.org/download/clerk/elections/results/election_results/archived_results/2011-2019/NOVEMBER2018SOVC082720211430281.pdf [bare URL PDF]
- https://sfcgov.org/download/clerk/elections/results/election_results/206_PALL_Official_Election_Summary_2.pdf [bare URL PDF]
- https://sfcgov.org/download/clerk/elections/results/election_results/archived_results/2011-2019/NOVEMBER2018SOVC082720211430281.pdf [bare URL PDF]
- "Missouri U.S. House - District 8 Election Results | des Moines Register". The Des Moines Register.
- "Election Results".
- Leip, David. "Dave Leip's Atlas of U.S. Presidential Elections". uselectionatlas.org. Retrieved November 18, 2020.
- Elliott, Amber, as told to Eli Saslow. ‘This is how we treat each other? This is who we are?' Washington Post, 18 November 2020.
- Breeding, Marshall. "Bonne Terre Memorial Library". Libraries.org. Retrieved May 8, 2017.
External links
- Official website
- Digitized 1930 Plat Book of St. Francois County Archived 2011-08-16 at the Wayback Machine from University of Missouri Division of Special Collections, Archives, and Rare Books
Places adjacent to St. Francois County, Missouri | ||||||||||||||||
|---|---|---|---|---|---|---|---|---|---|---|---|---|---|---|---|---|
| ||||||||||||||||
Municipalities and communities of Saint Francois County, Missouri, United States | ||
|---|---|---|
County seat: Farmington | ||
| Cities |  | |
| Townships |
| |
| CDPs | ||
| Other communities |
| |
| Ghost towns |
| |
| Footnotes | ‡This populated place also has portions in an adjacent county or counties | |
| ||
| Topics |
|  |
|---|---|---|
| Central city | ||
| Largest cities (over 50,000 in 2020) | ||
| Medium-sized cities (over 20,000 in 2020) | ||
| Largest towns and villages (over 10,000 in 2020) |
| |
| Missouri counties | ||
| Illinois counties | ||
| Subregions |
| |
Authority control | |
|---|---|
| General | |
| National libraries | |
На других языках
- [en] St. Francois County, Missouri
[ru] Сент-Франсис (округ, Миссури)
Округ Сент-Франсис (англ. Saint Francois County) — округ штата Миссури, США. Население округа на 2009 год составляло 63 884 человека. Административный центр округа — город Фармингтон.Другой контент может иметь иную лицензию. Перед использованием материалов сайта WikiSort.org внимательно изучите правила лицензирования конкретных элементов наполнения сайта.
WikiSort.org - проект по пересортировке и дополнению контента Википедии