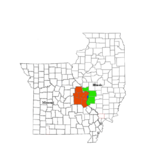
Jefferson County is located in the eastern portion of the state of Missouri. It is a part of the St. Louis Metropolitan Area. As of the 2020 census, the population was 226,739,[1] making it the sixth-most populous county in Missouri. Its county seat is Hillsboro.[2] The county was organized in 1818 and named in honor of former president Thomas Jefferson.[3][4]
In 1980, according to the U.S. census held that year, the county contained the mean center of U.S. population. Notably, this was the first census in which the center of population was west of the Mississippi River.
Jefferson County is part of the St. Louis Metropolitan Statistical Area and encompasses many of the city's southern suburbs.
Geography
According to the U.S. Census Bureau, the county has a total area of 664 square miles (1,720km2), of which 657 square miles (1,700km2) is land and 7.7 square miles (20km2) (1.2%) is water.[5] The county's eastern border is the Mississippi River.
Middle Mississippi River National Wildlife Refuge (part)
Demographics
Historical population
Census
Pop.
%±
1820
1,835
—
1830
2,592
41.3%
1840
4,296
65.7%
1850
6,928
61.3%
1860
10,344
49.3%
1870
15,380
48.7%
1880
18,736
21.8%
1890
22,484
20.0%
1900
25,712
14.4%
1910
27,878
8.4%
1920
26,555
−4.7%
1930
27,563
3.8%
1940
32,023
16.2%
1950
38,007
18.7%
1960
66,377
74.6%
1970
105,248
58.6%
1980
146,183
38.9%
1990
171,380
17.2%
2000
198,099
15.6%
2010
218,733
10.4%
2020
226,739
3.7%
U.S. Decennial Census[6] 1790-1960[7] 1900-1990[8] 1990-2000[9] 2010-2019[10]
As of the 2020 Census Jefferson County had a population of 226,739. The ethnic and racial makeup of the county was 90.4% white (89.7% non-hispanic white), 1.0% black or African American, 0.3% American Indian, 0.8% Asian, 0.8% some other race, and 6.6% two or more races. 2.4% of the population was of Hispanic or Latino origin.[11]
As of the 2010 Census Jefferson County had a population of 218,733. The reported ethnic and racial make up of the population was 95.4% non-Hispanic white, 0.8% African-American, 0.3% Native American, 0.6% Asian, 0.4% reporting some other race, 1.3% reporting two or more races and 1.6% Hispanic or Latino of any race.[12]
As of the census[13] of 2000, there were 198,099 people, 71,499 households, and 54,553 families residing in the county. The population density was 302 inhabitants per square mile (117/km2). There were 75,586 housing units at an average density of 115 per squaremile (44/km2). The racial makeup of the county was 97.48% White, 0.68% Black or African American, 0.29% Native American, 0.36% Asian, 0.01% Pacific Islander, 0.24% from other races, and 0.93% from two or more races. Approximately 1.01% of the population were Hispanic or Latino of any race.
There were 71,499 households, out of which 38.90% had children under the age of 18 living with them, 61.00% were married couples living together, 10.40% had a female householder with no husband present, and 23.70% were non-families. 18.90% of all households were made up of individuals, and 6.10% had someone living alone who was 65 years of age or older. The average household size was 2.74 and the average family size was 3.12.
In the county, the population was spread out, with 27.90% under the age of 18, 8.50% from 18 to 24, 31.80% from 25 to 44, 22.50% from 45 to 64, and 9.20% who were 65 years of age or older. The median age was 35 years. For every 100 females there were 98.90 males. For every 100 females age 18 and over, there were 95.90 males.
The median income for a household in the county was $60,636, and the median income for a family was $66,697. Males had a median income of $37,822 versus $25,440 for females. The per capita income for the county was $25,058. About 4.90% of families and 6.80% of the population were below the poverty line, including 8.10% of those under age 18 and 6.30% of those age 65 or over.
There were 146,316 registered voters in 2008.[14] As of Oct. 24, 2012, there were 148,011.[15]
This section does not cite any sources. (June 2014)
Local
Historically, the Democratic Party has controlled politics at the local level in Jefferson County but starting in 2010 the Republican Party has flipped the county with 66% of the population voting Republican in 2020.
Jefferson County, Missouri
Elected countywide officials
Assessor
Robert Boyer
Republican
Auditor
Kristy Apprill
Republican
Circuit Clerk
Michael Reuter
Republican
County Clerk
Ken Waller
Republican
County Executive
Dennis Gannon
Republican
Collector
Michelle Worth
Democratic
Prosecuting Attorney
Trisha Stefanski
Republican
Public Administrator
Steve Farmer
Republican
Recorder
Debbie Dunnegan
Republican
Sheriff
Dave Marshak
Republican
Treasurer
Paula Wagner
Republican
State
Jefferson County is divided into seven legislative districts in the Missouri House of Representatives; All of which are held by Republicans. Jefferson County consists of two State Senate Districts.
Missouri House of Representatives — District 97 — Jefferson County (2020)[22]
Party
Candidate
Votes
%
±%
Republican
Mary Elizabeth Coleman
13,260
100%
Missouri House of Representatives — District 97 — Jefferson County (2018)[23]
Party
Candidate
Votes
%
±%
Republican
Mary Elizabeth Coleman
7,204
56.40%
Democratic
Mike Revis
5,570
43.60%
Missouri House of Representatives — District 97 — Jefferson County (2016)[24]
Party
Candidate
Votes
%
±%
Republican
John C. McCaherty
10,386
74.00%
+7.02
Libertarian
Tracy J. Scott
3,650
26.00%
+26.00
Missouri House of Representatives — District 97 — Jefferson County (2014)[25]
Party
Candidate
Votes
%
±%
Republican
John C. McCaherty
4,681
66.98%
+15.83
Democratic
Tom Dohack
2,308
33.02%
-15.83
Past gubernatorial elections results
Year
Republican
Democratic
Third Parties
2020
63.91%73,942
33.59% 38,866
2.50% 2,886
2016
53.62%56.755
42.74% 45.234
3.64% 3,848
2012
41.75% 40,470
55.68%53,971
2.56% 2,484
2008
34.42% 35,947
63.87%66,697
1.71% 1,781
2004
49.23% 45,891
49.25%45,909
1.52% 1,424
2000
47.05% 36,060
49.33%37,808
3.62% 2,775
1996
43.90% 28,986
52.96%34,970
3.14% 2,077
Missouri House of Representatives — District 97 — Jefferson County (2012)[26][22]
Party
Candidate
Votes
%
±%
Republican
John C. McCaherty
6,946
51.15%
Democratic
Sam Komo
6,633
48.85%
District 111 Shane Roden (R-Cedar Hill). Consists of Byrnes Mill, Cedar Hill, Cedar Hill Lakes, House Springs, and Scottsdale.
Missouri House of Representatives — District 111 — Jefferson County (2020)[22]
Party
Candidate
Votes
%
±%
Republican
Shane Roden
13,308
70.87%
Democratic
Daniel (Vern) Cherry
5,470
29.13%
Missouri House of Representatives — District 111 — Jefferson County (2018)[23]
Party
Candidate
Votes
%
±%
Republican
Shane Roden
9,826
65.34%
Democratic
Phoebe Ottomeyer
5,212
34.66%
Missouri House of Representatives — District 111 — Jefferson County (2016)[24]
Party
Candidate
Votes
%
±%
Republican
Shane Roden
10,699
62.10%
+9.12
Democratic
Del Viehland
5,020
29.14%
-17.88
Independent
Jon Schuesller
1,510
8.76%
+8.76
Missouri House of Representatives — District 111 — Jefferson County (2014)[25]
Party
Candidate
Votes
%
±%
Republican
Shane Roden
4,834
52.98%
+3.66
Democratic
Michael Frame
4,291
47.02%
-3.66
Missouri House of Representatives — District 111 — Jefferson County (2012)[26]
Party
Candidate
Votes
%
±%
Democratic
Michael Frame
8,052
50.68%
Republican
Derrick Good
7,836
49.32%
District 112 Rob Vescovo (R-Arnold). Consists of areas near Arnold and Byrnes Mill.
Missouri House of Representatives — District 112 — Jefferson County (2020)[22]
Party
Candidate
Votes
%
±%
Republican
Rob Vescovo
16,545
100%
Missouri House of Representatives — District 112 — Jefferson County (2018)[23]
Party
Candidate
Votes
%
±%
Republican
Rob Vescovo
16,545
61.30%
Democratic
Benjamin Hagin
6,074
38.70%
Missouri House of Representatives — District 112 — Jefferson County (2016)[24]
Party
Candidate
Votes
%
±%
Republican
Rob Vescovo
10,754
59.64%
-0.43
Democratic
Robert Butler
7,278
40.36%
+0.43
Missouri House of Representatives — District 112 — Jefferson County (2014)[25]
Party
Candidate
Votes
%
±%
Republican
Rob Vescovo
5,432
60.07%
+0.97
Democratic
Robert Butler
3,611
39.93%
-0.97
Missouri House of Representatives — District 112 — Jefferson County (2012)[26]
Party
Candidate
Votes
%
±%
Republican
Paul Wieland
9,284
59.10%
Democratic
Daniel James
6,425
40.90%
District 113 Dan Shaul (R-Imperial). Consists of most Arnold, all of Imperial and Kimmswick, and part of Barnhart.
Missouri House of Representatives — District 113 — Jefferson County (2020)[22]
Party
Candidate
Votes
%
±%
Republican
Dan Shaul
11,150
63.19%
Democratic
Terry Burgess
6,519
36.90%
Missouri House of Representatives — District 113 — Jefferson County (2018)
Party
Candidate
Votes
%
±%
Republican
Dan Shaul
7,940
56.52%
Democratic
Karen Settlemoir-Berg
6,109
43.48%
Missouri House of Representatives — District 113 — Jefferson County (2016)[24]
Party
Candidate
Votes
%
±%
Republican
Dan Shaul
9,598
57.84%
-2.14
Democratic
Karen Settlemoir-Berg
6,995
42.16%
+2.14
Missouri House of Representatives — District 113 — Jefferson County (2014)[25]
Party
Candidate
Votes
%
±%
Republican
Dan Shaul
4,749
59.98%
+13.21
Democratic
Sean Fauss
3,168
40.02%
-13.21
Missouri House of Representatives — District 113 — Jefferson County (2012)[26]
Party
Candidate
Votes
%
±%
Democratic
Jeff Roorda
8,450
53.23%
Republican
Dan Smith
7,225
46.77%
District 114 Becky Ruth (R-Festus). Consists of part of Barnhart, and all of Crystal City, Festus, Herculaneum, and Pevely.
Missouri House of Representatives — District 114 — Jefferson County (2020)[22]
Party
Candidate
Votes
%
±%
Republican
Becky Ruth
15,798
100.00%
Missouri House of Representatives — District 114 — Jefferson County (2018)[23]
Party
Candidate
Votes
%
±%
Republican
Becky Ruth
9,664
67.64%
Democratic
Dennis McDonald
4,624
32.36%
Missouri House of Representatives — District 114 — Jefferson County (2016)[24]
Party
Candidate
Votes
%
±%
Republican
Becky Ruth
14,639
100.00%
+46.74%
Missouri House of Representatives — District 114 — Jefferson County (2014)[25]
Party
Candidate
Votes
%
±%
Republican
Becky Ruth
4,791
53.26%
+3.53
Democratic
T. J. McKenna
4,204
46.74%
-3.53
Missouri House of Representatives — District 114 — Jefferson County (2012)[26]
Party
Candidate
Votes
%
±%
Democratic
T. J. McKenna
7,772
50.27%
Republican
Becky Ruth
7,688
49.73%
District 115 Cyndi Buchheit-Courtway (R-Festus). Consists of Olympian Village and areas near De Soto.
Missouri House of Representatives — District 115 — Jefferson County (2020)[22]
Party
Candidate
Votes
%
±%
Republican
Cyndi Buchheit Courtway
6,444
69.32%
+5.68
Democratic
Cynthia Nugent
2,835
27.97%
Missouri House of Representatives — District 115 — Jefferson County (2018)[23]
Party
Candidate
Votes
%
±%
Republican
Elaine Freeman Gannon
6,671
100%
Missouri House of Representatives — District 115 — Jefferson County (2016)[24]
Party
Candidate
Votes
%
±%
Republican
Elaine Gannon
6,444
69.32%
+5.68
Democratic
Barbara Stocker
2,443
26.28%
-5.12
Libertarian
Charles Bigelow
409
4.40%
+4.40
Missouri House of Representatives — District 115 — Jefferson County (2014)[25]
Party
Candidate
Votes
%
±%
Republican
Elaine Gannon
3,285
63.64%
+12.75
Democratic
Dan Darian
1,621
31.40%
-17.71
Constitution
Jerry Dollar, Jr.
256
4.96%
+4.96
Missouri House of Representatives — District 115 — Jefferson County (2012)[26]
Party
Candidate
Votes
%
±%
Republican
Elaine Gannon
4,329
50.89%
Democratic
Rich McCane
4,177
49.11%
District 118 Mike McGirl (R-Potosi). Consists of De Soto and Hillsboro.
Missouri House of Representatives — District 118 — Jefferson County (2020)[22]
Party
Candidate
Votes
%
±%
Republican
Mike McGirl
9,259
100.00%
Missouri House of Representatives — District 118 — Jefferson County (2018)
Party
Candidate
Votes
%
±%
Republican
Mike McGirl
5,336
62.19%
Democratic
Barbara Marco
3,244
37.81%
Missouri House of Representatives — District 118 — Jefferson County (2016)[24]
Party
Candidate
Votes
%
±%
Democratic
Ben Harris
8,164
100.00%
+44.57
Missouri House of Representatives — District 118 — Jefferson County (2014)[25]
Party
Candidate
Votes
%
±%
Democratic
Ben Harris
3,239
55.43%
-44.57
Republican
Michael McGirl
2,604
44.57%
+44.57
Missouri House of Representatives — District 118 — Jefferson County (2012)[26]
Party
Candidate
Votes
%
±%
Democratic
Ben Harris
7,514
100.00%
Jefferson County is also divided into two districts in the Missouri Senate.
District 3 — Elaine Gannon (R-De Soto) Consists of De Soto, Hillsboro, and Olympian Village as well as part of Festus.
Missouri Senate — District 3 — Jefferson County (2020)[22]
Party
Candidate
Votes
%
±%
Republican
Elaine Freeman Gannon
20,578
100%
Green
Edward Weissler
4,681
22.24%
+22.24
Missouri Senate — District 3 — Jefferson County (2016)[24]
Party
Candidate
Votes
%
±%
Republican
Gary Romine
16,356
77.75%
+27.90
Green
Edward Weissler
4,681
22.24%
+22.24
Missouri Senate — District 3 — Jefferson County (2012)[26]
Party
Candidate
Votes
%
±%
Republican
Gary Romine
10,069
49.85
Democratic
Joseph Fallert, Jr.
10,129
50.15
District 22 — Paul Wieland (R-Imperial) Consists of the northern part of the county.
Missouri Senate — District 22 — Jefferson County (2018)[25]
Party
Candidate
Votes
%
±%
Republican
Paul Wieland
40,556
58.32
Democratic
Robert Butler
26.903
38.69
Libertarian
Richie Camden
2,078
2.99
Missouri Senate — District 22 — Jefferson County (2014)[25]
Jefferson County is divided among three congressional districts. Prior to the 2012 election all of it was included in Missouri's 3rd Congressional District, but now about half of it is in the 3rd District, while the northeastern portion is in the 2nd Congressional District and the southern portion is in the 8th Congressional District.
U.S. House of Representatives — District 2 — Jefferson County (2016)[24]
Party
Candidate
Votes
%
±%
Republican
Ann Wagner
11,930
61.04%
-0.87
Democratic
Bill Otto
6,542
33.47%
-0.10
Libertarian
Jim Higgins
783
4.00%
-0.52
Green
David Justus Arnold
291
1.49%
+1.49
U.S. House of Representatives — District 2 — Jefferson County (2014)[25]
Party
Candidate
Votes
%
±%
Republican
Ann Wagner
5,988
61.91%
+6.38
Democratic
Arthur Lieber
3,247
33.57%
-7.41
Libertarian
Bill Slantz
437
4.52%
+1.68
U.S. House of Representatives — District 2 — Jefferson County (2012)[26]
Party
Candidate
Votes
%
±%
Republican
Ann Wagner
9,976
55.53%
Democratic
Glenn Koenen
7,361
40.98%
Libertarian
Bill Slantz
511
2.84%
Constitution
Anatol Zorikova
116
0.65%
U.S. House of Representatives — District 3 — Jefferson County (2016)[24]
Party
Candidate
Votes
%
±%
Republican
Blaine Luetkemeyer
33,530
61.56%
+1.44
Democratic
Kevin Miller
18,333
33.66%
-1.33
Libertarian
Dan Hogan
2,077
3.81%
-1.07
Constitution
Doanita Simmons
526
0.97%
+0.97
U.S. House of Representatives — District 3 — Jefferson County (2014)[25]
Party
Candidate
Votes
%
±%
Republican
Blaine Luetkemeyer
16,558
60.12%
+7.09
Democratic
Courtney Denton
9,637
34.99%
-7.29
Libertarian
Steven Hedrick
1,345
4.88%
+0.19
U.S. House of Representatives — District 3 — Jefferson County (2012)[26]
Party
Candidate
Votes
%
±%
Republican
Blaine Luetkemeyer
25,898
53.03%
Democratic
Eric Mayer
20,650
42.28%
Libertarian
Steven Wilson
2,288
4.69%
U.S. House of Representatives — District 8 — Jefferson County (2016)[24]
Party
Candidate
Votes
%
±%
Republican
Jason Smith
18,030
63.98%
+11.75
Democratic
Dave Cowell
9,155
32.49%
-5.26
Libertarian
Jonathan Shell
996
3.53%
+0.70
U.S. House of Representatives — District 8 — Jefferson County (2014)[25]
Party
Candidate
Votes
%
±%
Republican
Jason Smith
8,060
52.23%
-5.47
Democratic
Barbara Stocker
5,826
37.75%
-0.80
Libertarian
Rick Vandeven
436
2.83%
+1.22
Constitution
Doug Enyart
544
3.52%
+1.38
Independent
Terry Hampton
567
3.67%
U.S. House of Representatives — District 8 — Jefferson County (Special Election, June 4, 2013)[27]
Party
Candidate
Votes
%
±%
Republican
Jason Smith
1,862
57.70%
+0.78
Democratic
Steve Hodges
1,244
38.55%
-0.54
Libertarian
Bill Slantz
52
1.61%
-2.38
Constitution
Doug Enyart
69
2.14%
+2.14
U.S. House of Representatives — District 8 — Jefferson County (2012)[26]
Party
Candidate
Votes
%
±%
Republican
Joann Emerson
14,692%
56.92
Democratic
Jack Rushin
10,090
39.09%
Libertarian
Rick Vandeven
1,030
3.99%
Political culture
United States presidential election results for Jefferson County, Missouri[28]
Year
Republican
Democratic
Third party
No.
%
No.
%
No.
%
2020
77,046
66.03%
37,523
32.16%
2,119
1.82%
2016
69,036
64.52%
31,568
29.50%
6,391
5.97%
2012
53,978
55.07%
41,564
42.40%
2,482
2.53%
2008
50,804
47.91%
53,467
50.42%
1,779
1.68%
2004
46,624
49.99%
46,057
49.38%
583
0.63%
2000
36,766
47.62%
38,616
50.02%
1,822
2.36%
1996
23,877
36.12%
32,073
48.52%
10,152
15.36%
1992
20,637
28.08%
32,569
44.31%
20,295
27.61%
1988
29,279
51.16%
27,738
48.47%
215
0.38%
1984
34,525
63.29%
20,026
36.71%
0
0.00%
1980
28,546
52.01%
24,042
43.81%
2,294
4.18%
1976
18,261
41.58%
25,159
57.29%
495
1.13%
1972
21,947
61.42%
13,787
38.58%
0
0.00%
1968
11,708
37.70%
13,230
42.60%
6,115
19.69%
1964
7,887
29.43%
18,916
70.57%
0
0.00%
1960
12,910
43.09%
17,054
56.91%
0
0.00%
1956
10,712
43.58%
13,868
56.42%
0
0.00%
1952
9,607
42.82%
12,808
57.08%
22
0.10%
1948
6,085
37.02%
10,280
62.55%
70
0.43%
1944
6,758
45.83%
7,953
53.94%
34
0.23%
1940
7,517
43.92%
9,553
55.82%
45
0.26%
1936
5,575
37.23%
9,158
61.16%
241
1.61%
1932
4,559
35.50%
8,130
63.30%
155
1.21%
1928
6,285
54.47%
5,231
45.34%
22
0.19%
1924
4,870
48.88%
4,356
43.72%
737
7.40%
1920
5,730
54.08%
4,684
44.21%
181
1.71%
1916
3,310
51.01%
3,021
46.56%
158
2.43%
1912
2,127
40.84%
2,368
45.47%
713
13.69%
1908
3,050
52.00%
2,698
46.00%
117
1.99%
1904
2,909
52.09%
2,560
45.84%
116
2.08%
1900
2,775
49.20%
2,798
49.61%
67
1.19%
1896
2,876
50.46%
2,785
48.87%
38
0.67%
1892
2,207
44.70%
2,617
53.01%
113
2.29%
1888
2,228
47.31%
2,438
51.77%
43
0.91%
A predominantly suburban county, Jefferson County used to be fairly independent-leaning at the federal level with a tendency to tilt Democratic. Presidential elections in Jefferson County were often very close; George W. Bush just narrowly carried the county in 2004 by less than 600 votes and by just over a half of a percentage point. Al Gore and Barack Obama also just narrowly carried the county in 2000 and 2008, respectively. Bill Clinton, however, did manage to carry Jefferson County by double digits both times in 1992 and 1996. However, in 2012 the county began to swing hard to the right with Mitt Romney carrying it with 55% of the vote. In 2016 Donald Trump won the county with 65% of the vote, the largest margin of any candidate since Lyndon Johnson in 1964.
Typical of the suburban culture in most counties throughout the country, voters in Jefferson County tend to be rather centrist on social issues but more liberal on economic issues. In 2004, Missourians voted on a constitutional amendment to define marriage as the union between a man and a woman—it overwhelmingly passed Jefferson County with 72.56 percent of the vote. The initiative passed the state with 71 percent of support from voters as Missouri became the first state to ban same-sex marriage. In 2006, Missourians voted on a constitutional amendment to fund and legalize embryonic stem cell research in the state—it narrowly passed Jefferson County with 51.85 percent voting for the measure. The initiative narrowly passed the state with 51 percent of support from voters as Missouri became one of the first states in the nation to approve embryonic stem cell research. In 2006, Missourians voted on a proposition (Proposition B) to increase the minimum wage in the state to $6.50 an hour—it passed Jefferson County with 79.90 percent of the vote. The proposition strongly passed every single county in Missouri with 78.99 percent voting in favor as the minimum wage was increased to $6.50 an hour in the state. During the same election, voters in five other states also strongly approved increases in the minimum wage.
2008 Missouri presidential primary
Republican
U.S. Senator John McCain (R-Arizona) won Jefferson County with 33.54% of the vote. Former Governor Mitt Romney (R-Massachusetts finished in second with 30.45% of the vote, while former Governor Mike Huckabee (R-Arkansas) came in third with 30.19% in Jefferson County. Libertarian-leaning U.S. Representative Ron Paul (R-Texas) finished a distant fourth place with 3.94% of the vote in Jefferson County. McCain received all of Missouri's 58 delegates as the Republican Party utilizes the winner-takes-all system.
Democratic
U.S. Senator Hillary Clinton (D-New York) won Jefferson County over Senator Barack Obama (D-Illinois) with 61.32% of the vote, while Obama received 35.02% of the vote. Although he withdrew from the race, former U.S. Senator John Edwards (D-North Carolina) still received 2.74% of the vote in Jefferson County. Jefferson County gave Clinton one of her strongest showings in a predominantly suburban county in the entire country.
Clinton had a large initial lead in Missouri at the beginning of the evening as the rural precincts began to report, leading several news organizations to call the state for her; however, Obama rallied from behind as the heavily African American precincts from St. Louis began to report and eventually put him over the top. In the end, Obama received 49.32 percent of the vote to Clinton's 47.90% — a 1.42% difference. Both candidates split Missouri's 72 delegates, as the Democratic Party utilizes proportional representation.
Hillary Rodham Clinton received more votes, a total of 19,075, than any candidate from either party in Jefferson County during the 2008 Missouri Presidential Primaries. She also received more votes than the total number of votes cast in the entire Republican Primary in Jefferson County.
Health
According to a 2012 census study by the University of Wisconsin Population Health Institute and the Robert Wood Johnson Foundation, Jefferson County led the Saint Louis metropolitan area in the number of adults who smoke, roughly 30% of all adult residents of Jefferson County smoked or used tobacco in some form, compared to the 19% national average and the 24% Missouri state average.[29][30]
Jefferson County and the state of Missouri led the nation in methamphetamine production, peaking in the mid-2000s.[31]
"June 4, 2013 Special Election"(PDF). Jefferson County Clerk. June 4, 2013. Archived(PDF) from the original on September 10, 2015. Retrieved March 31, 2016.
Другой контент может иметь иную лицензию. Перед использованием материалов сайта WikiSort.org внимательно изучите правила лицензирования конкретных элементов наполнения сайта.
2019-2026 WikiSort.org - проект по пересортировке и дополнению контента Википедии


 Interstate 55
 U.S. Route 61
 U.S. Route 67
 Route 21
 Route 30
 Route 109
 Route 110
 Route 141
 Route 231