world.wikisort.org - USA
Richland County is located in the U.S. state of South Carolina. As of the 2020 census, its population was 416,147,[2] making it the second-most populous county in South Carolina, behind only Greenville County. The county seat and largest city is Columbia,[3] the state capital. The county was established on March 12, 1785.[4] Richland County is part of the Columbia, SC metropolitan statistical area. In 2010, the center of population of South Carolina was located in Richland County, in the city of Columbia.[5]
Richland County | |
|---|---|
U.S. county | |
 The Richland County Justice Center is located across from Columbia City Hall. | |
 Seal Logo | |
| Motto: "A vision for the future" | |
 Location within the U.S. state of South Carolina | |
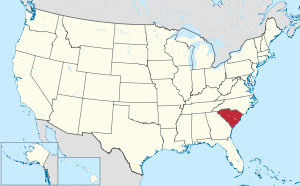 South Carolina's location within the U.S. | |
| Coordinates: 34°01′18″N 80°54′11″W | |
| Country | |
| State | |
| Founded | 1785 |
| Named for | The county's "Rich Land"[1] |
| Seat | Columbia |
| Largest city | Columbia |
| Area | |
| • Total | 772 sq mi (2,000 km2) |
| • Land | 757 sq mi (1,960 km2) |
| • Water | 15 sq mi (40 km2) 1.9% |
| Population (2020) | |
| • Total | 416,147 |
| • Density | 540/sq mi (210/km2) |
| Time zone | UTC−5 (Eastern) |
| • Summer (DST) | UTC−4 (EDT) |
| Congressional districts | 2nd, 6th |
| Website | www |
History

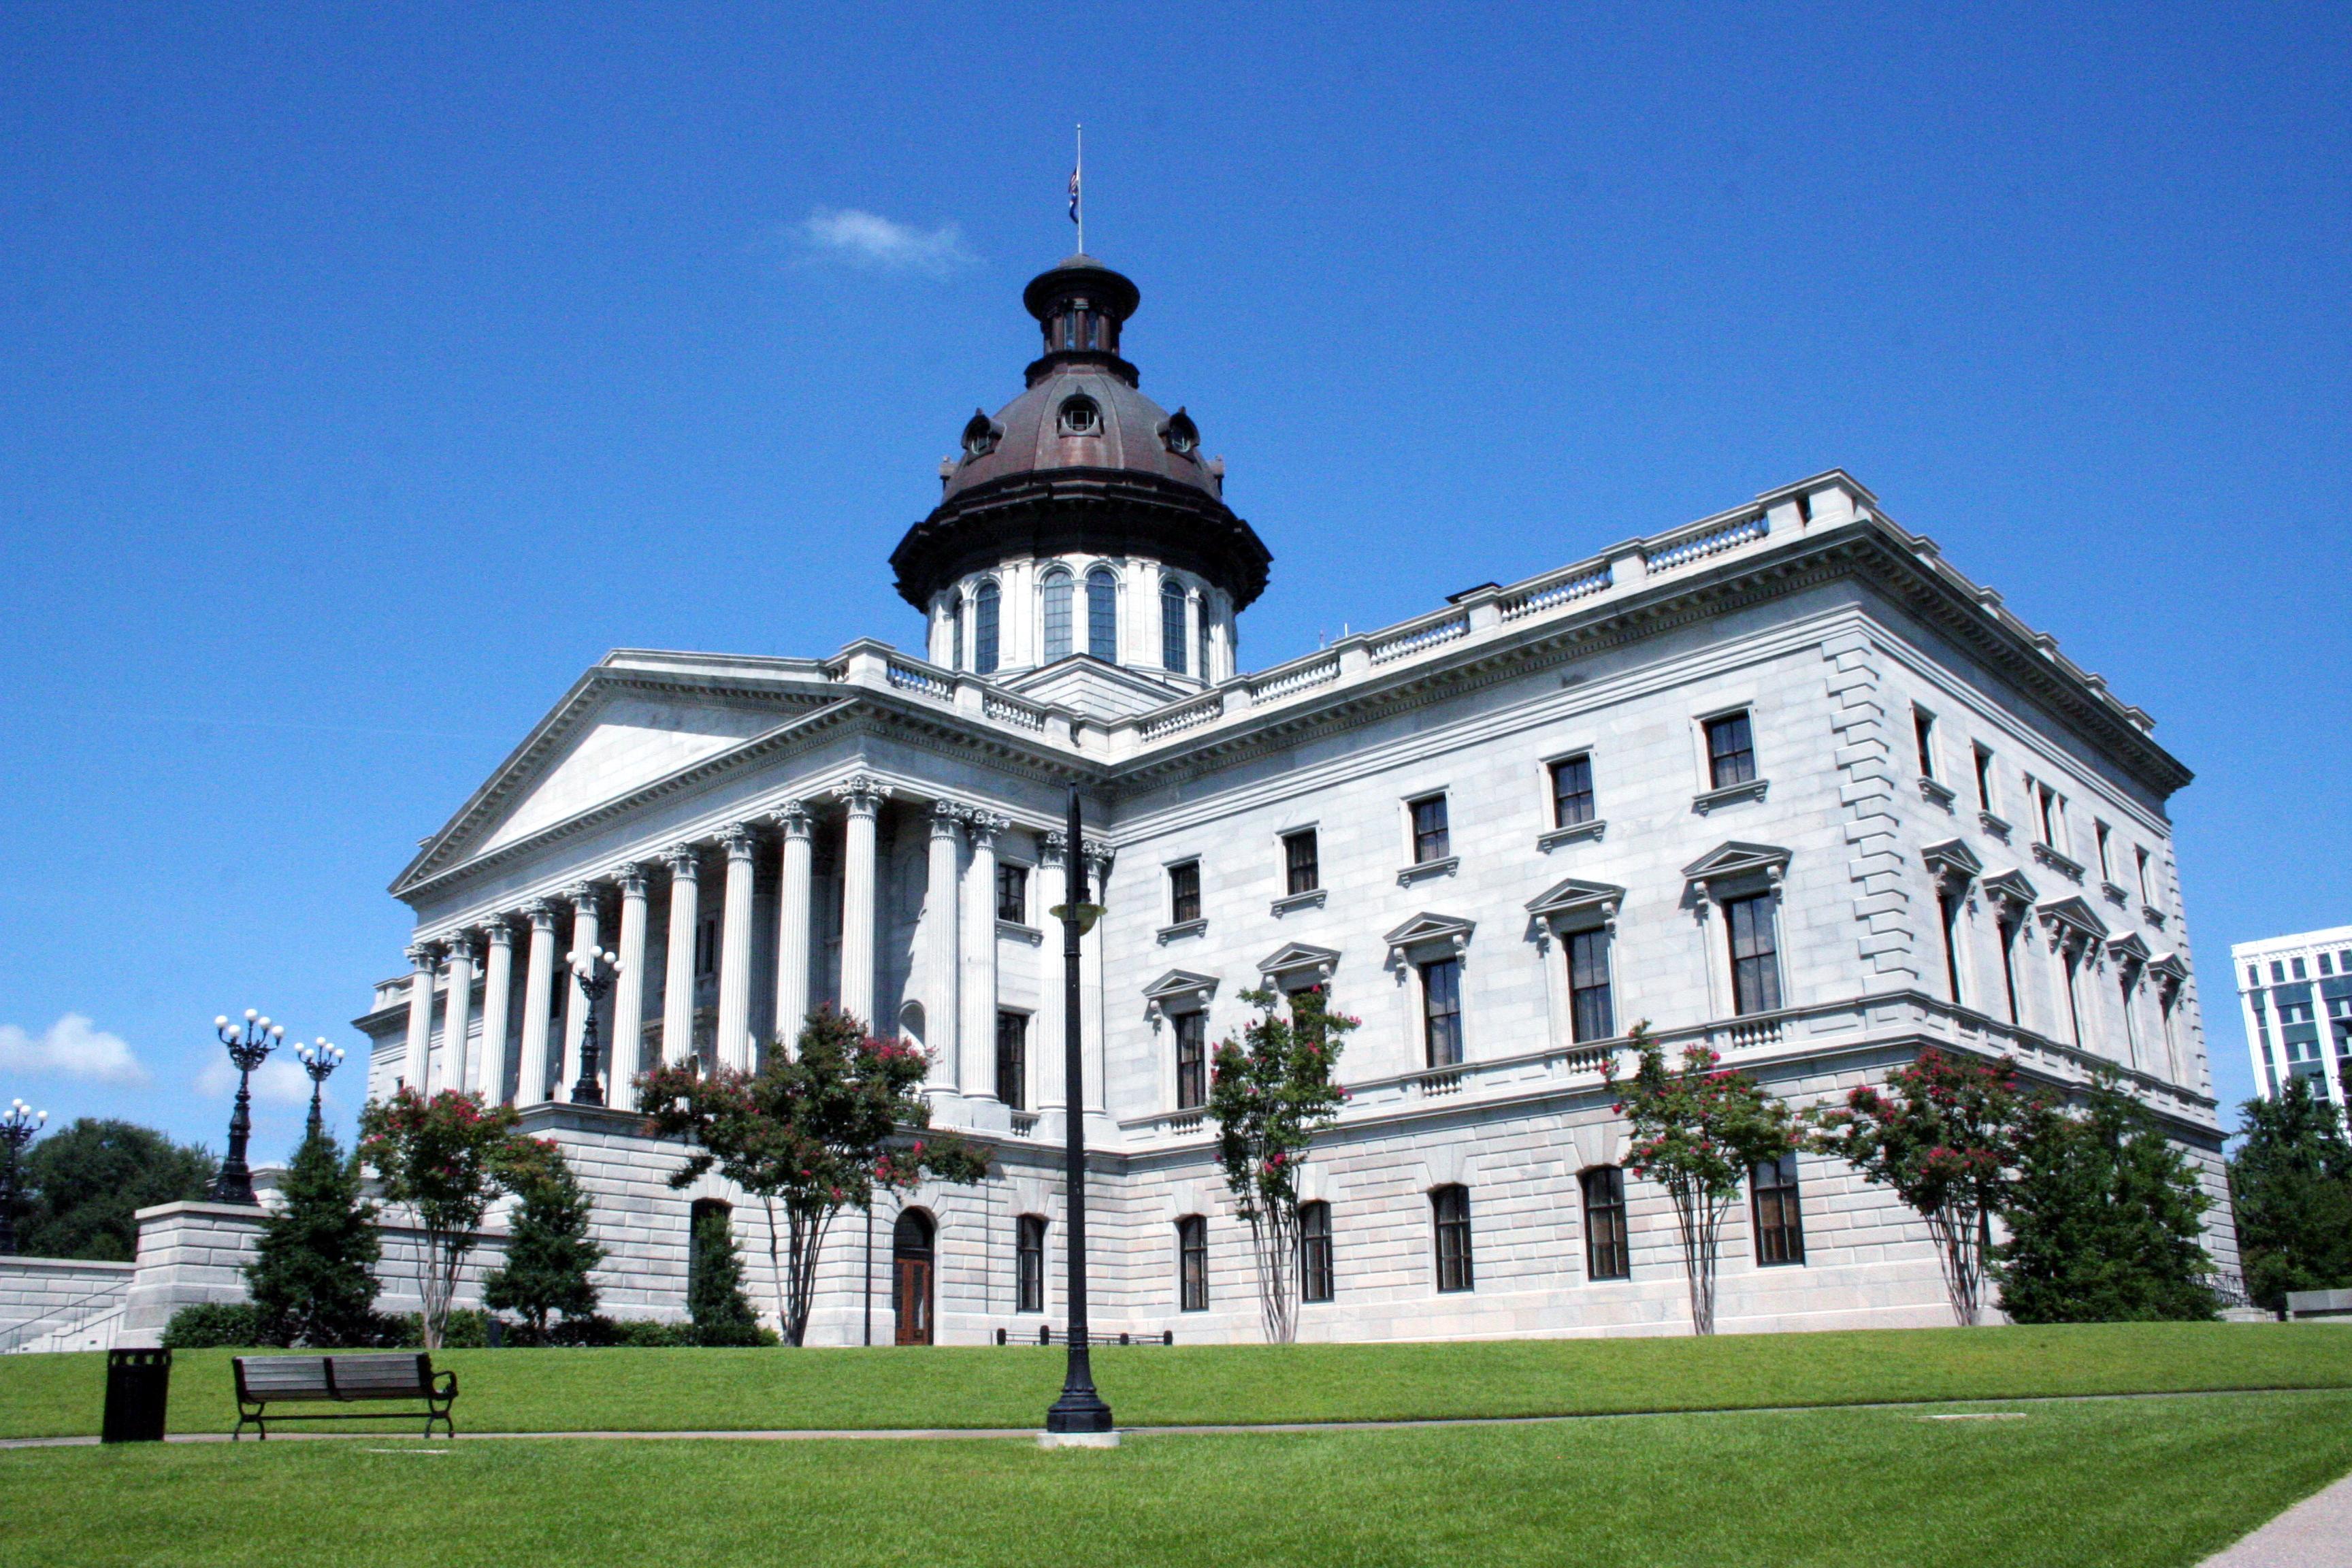

Richland County was probably named for its "rich land". The county was formed in 1785 as part of the large Camden District.[4] A small part of Richland County was later ceded to adjacent Kershaw County in 1791. The county seat and largest city is Columbia, which is also the state capital. In 1786, the state legislature decided to move the capital from Charleston to a more central location. A site was chosen in Richland County, which is in the geographic center of the state, and a new town was laid out. Richland County's boundaries were formally incorporated on December 18, 1799.[6] Cotton from the surrounding plantations was shipped through Columbia and later manufactured into textiles there. General William T. Sherman captured Columbia during the Civil War and his troops burned the town and parts of the county on February 17, 1865. The U. S. Army returned on friendlier terms in 1917, when Fort Jackson was established, which is now the largest and most active Initial Entry Training Center in the U.S. Army. The South Carolina State House is located in downtown Columbia.
Geography


According to the U.S. Census Bureau, the county has a total area of 772 square miles (2,000 km2), of which 15 square miles (39 km2) (1.9%) are covered by water.[7] Richland County is situated in the center of South Carolina.
National protected area
- Congaree National Park
State and local protected areas/sites
- Harbison State Forest
- Riverbanks Zoo and Garden
- Sesquicentennial State Park
- South Carolina State Fair
Major water bodies
- Broad River
- Congaree River
- Lake Murray
- Little River
- Saluda River
- Wateree River
Adjacent counties
- Kershaw County - northeast
- Fairfield County - north
- Sumter County - east
- Lexington County - west
- Calhoun County - south
- Newberry County - northwest
Transportation
Bus system
Public transportation in Richland County is provided by the COMET, or officially the Central Midlands Regional Transit Authority (CMRTA). The bus system is the main public transit system for the greater Columbia area. In Richland County, the bus system runs in the areas of Columbia, Forest Acres, Fort Jackson, Irmo, St. Andrews, Northeast Richland, Lower Richland, and Eastover. Additionally, COMET offers Dial-a-ride transit (DART), which provides personalized service passengers with disabilities.[8]
Railway
Columbia has one Amtrak station (CLB) that serves over 30,000 passengers per year on the Silver Star rail line.[9] Additionally, Richland County has an operating facility for CSX Transportation, a company that transports over one million carloads of freight on South Carolina's rail network.[10]
Airports
The Jim Hamilton–L.B. Owens Airport operates over 56,000 aircraft annually, but is a smaller airport used mostly for small and private planes. The main airport for the region is the Columbia Metropolitan Airport, which is located in neighboring Lexington County. In 2018, the Columbia Metro Airport served 1,197,603 passengers with 12,324 flights.
Interstates
 I-20 Interstate 20 travels from west to east and connects Columbia to Atlanta and Augusta in the west and Florence in the east. It serves the nearby towns and suburbs of Pelion, Lexington, West Columbia, Sandhill, Pontiac, and Elgin. Interstate 20 is also used by travelers heading to Myrtle Beach, although the interstate's eastern terminus is in Florence.
 I-26 Interstate 26 travels from northwest to southeast and connects the Columbia area to the other two major population centers of South Carolina - the Greenville-Spartanburg area in the northwestern part of the state and North Charleston – Charleston area in the southeastern part of the state.
 I-77 Interstate 77 begins in Lexington county and ends in Cleveland, Ohio, and is frequently used by travelers on the east coast heading to or from Florida.
 I-126 Interstate 126 branches off from I-26 and leads into downtown Columbia and provides access to Riverbanks Zoo.
U.S. routes
 US 1
US 1 US 1 Conn.
 US 21
US 21- US 21 Conn.
 US 76
US 76- US 76 Conn.
 US 176
 US 321
 US 378
 US 601
State routes
 SC 6
SC 6 SC 7
SC 7 SC 12
SC 12 SC 12 Spur
 SC 16
SC 16 SC 40
SC 40 SC 48
SC 48 SC 48 Truck
 SC 215
 SC 262
 SC 263
 SC 269
 SC 277
 SC 555
 SC 764
 SC 768
 SC 768 Conn.
Major infrastructure
- Columbia Station
- Fort Jackson
- McEntire Joint National Guard Base - U.S. Air Force base
Demographics
| Historical population | |||
|---|---|---|---|
| Census | Pop. | %± | |
| 1790 | 3,930 | — | |
| 1800 | 6,097 | 55.1% | |
| 1810 | 9,027 | 48.1% | |
| 1820 | 12,321 | 36.5% | |
| 1830 | 14,772 | 19.9% | |
| 1840 | 16,397 | 11.0% | |
| 1850 | 20,243 | 23.5% | |
| 1860 | 18,307 | −9.6% | |
| 1870 | 23,025 | 25.8% | |
| 1880 | 28,573 | 24.1% | |
| 1890 | 36,821 | 28.9% | |
| 1900 | 45,589 | 23.8% | |
| 1910 | 55,143 | 21.0% | |
| 1920 | 78,122 | 41.7% | |
| 1930 | 87,667 | 12.2% | |
| 1940 | 104,843 | 19.6% | |
| 1950 | 142,565 | 36.0% | |
| 1960 | 200,102 | 40.4% | |
| 1970 | 233,868 | 16.9% | |
| 1980 | 269,735 | 15.3% | |
| 1990 | 285,720 | 5.9% | |
| 2000 | 320,677 | 12.2% | |
| 2010 | 384,504 | 19.9% | |
| 2020 | 416,147 | 8.2% | |
| 2021 (est.) | 418,307 | [11] | 0.5% |
| U.S. Decennial Census[12] 1790-1960[13] 1900-1990[14] 1990-2000[15] 2010-2020[16][17] | |||
2020 census
| Race | Num. | Perc. |
|---|---|---|
| White (non-Hispanic) | 172,644 | 41.49% |
| Black or African American (non-Hispanic) | 188,141 | 45.21% |
| Native American | 888 | 0.21% |
| Asian | 11,330 | 2.72% |
| Pacific Islander | 427 | 0.1% |
| Other/mixed | 16,622 | 3.99% |
| Hispanic or Latino | 26,095 | 6.27% |
As of the 2020 United States census, 416,147 people, 153,484 households, and 90,802 families were residing in the county.
2010 census
As of the 2010 United States Census, 384,504 people, 145,194 households, and 89,357 families were residing in the county.[19][16] The population density was 507.9 inhabitants per square mile (196.1/km2). There were 161,725 housing units at an average density of 213.6 per square mile (82.5/km2).[20] The racial makeup of the county was 45.3% White, 48.9% African American, 2.2% Asian, 0.3% American Indian, 0.1% Pacific Islander, 1.9% from other races, and 2.2% from two or more races. Those of Hispanic or Latino origin made up 4.8% of the population.[19] In terms of ancestry, 9.6% were German, 8.6% were English, 7.6% were Irish, and 7.1% were American.[21]
Of the 145,194 households, 32.9% had children under 18 living with them, 39.6% were married couples living together, 17.7% had a female householder with no husband present, 38.5% were not families, and 30.2% of all households were made up of individuals. The average household size was 2.43, and the average family size was 3.05. The median age was 32.6 years.[19]
The median income for a household in the county was $47,922 and for a family was $61,622. Males had a median income of $42,453 versus $34,012 for females. The per capita income for the county was $25,805. About 10.0% of families and 14.5% of the population were below the poverty line, including 17.6% of those under age 18 and 9.7% of those age 65 or over.[22]
Law and government

Richland County is governed by a county council,[23] who hold concurrent four-year terms. Richland County is governed under the Council-Administrator form of government, which is very similar to the council-manager form of government. The major difference between the council-manager and council-administrator forms of government is the title of the chief executive.
| County council (as of 2022) | |
|---|---|
| District | Council person |
| District 1 | Bill Malinowski |
| District 2 | Derrek Pugh |
| District 3 | Yvonne McBride |
| District 4 | Paul Livingston |
| District 5 | Allison Terracio |
| District 6 | Joe Walker III |
| District 7 | Gretchen Barron |
| District 8 | Overture Walker (chair) |
| District 9 | Jesica Mackey (vice chair) |
| District 10 | Cheryl English |
| District 11 | Chakisse Newton |
The South Carolina Department of Corrections, headquartered in Columbia and in Richland County,[24] operates several correctional facilities in Columbia and in Richland County. They include the Broad River Correctional Institution,[25] the Goodman Correctional Institution,[26] the Camille Griffin Graham Correctional Institution,[27] the Stevenson Correctional Institution,[28] and the Campbell Pre-Release Center.[29] Graham houses the state's female death row.[30] The State of South Carolina execution chamber is located at Broad River. From 1990 to 1997 Broad River housed the state's male death row.[31]
In March 2008, the Richland County Sheriff's Department acquired an armored personnel carrier equipped with a .50 caliber machine gun.[32] Reason magazine criticized the acquisition as "overkill".[33]
Politics
Richland County was one of the first areas of South Carolina to break away from a Solid South voting pattern. From 1948 to 1988, it only supported the official Democratic candidate for president once, in 1976. It voted for splinter Dixiecrat Strom Thurmond in 1948, and for unpledged electors in 1956.
Since 1992, Richland County has been one of the stronger Democratic bastions in South Carolina, following the trend of most urban counties across the country.
| Year | Republican | Democratic | Third party | |||
|---|---|---|---|---|---|---|
| No. | % | No. | % | No. | % | |
| 2020 | 58,313 | 30.09% | 132,570 | 68.40% | 2,939 | 1.52% |
| 2016 | 52,469 | 31.10% | 108,000 | 64.01% | 8,253 | 4.89% |
| 2012 | 53,105 | 33.37% | 103,989 | 65.34% | 2,060 | 1.29% |
| 2008 | 57,941 | 35.11% | 105,656 | 64.02% | 1,440 | 0.87% |
| 2004 | 56,212 | 42.01% | 76,283 | 57.01% | 1,306 | 0.98% |
| 2000 | 50,164 | 43.07% | 63,179 | 54.24% | 3,138 | 2.69% |
| 1996 | 39,092 | 41.05% | 52,222 | 54.84% | 3,916 | 4.11% |
| 1992 | 43,744 | 41.17% | 53,648 | 50.49% | 8,858 | 8.34% |
| 1988 | 43,841 | 52.74% | 36,420 | 43.81% | 2,862 | 3.44% |
| 1984 | 46,773 | 57.44% | 32,212 | 39.56% | 2,444 | 3.00% |
| 1980 | 36,337 | 49.87% | 33,158 | 45.50% | 3,374 | 4.63% |
| 1976 | 32,727 | 46.78% | 36,855 | 52.68% | 380 | 0.54% |
| 1972 | 39,746 | 64.11% | 21,462 | 34.62% | 787 | 1.27% |
| 1968 | 26,215 | 50.96% | 18,198 | 35.37% | 7,032 | 13.67% |
| 1964 | 27,306 | 60.35% | 17,939 | 39.65% | 0 | 0.00% |
| 1960 | 20,736 | 63.94% | 11,694 | 36.06% | 0 | 0.00% |
| 1956 | 6,714 | 29.99% | 6,154 | 27.49% | 9,516 | 42.51% |
| 1952 | 15,925 | 64.17% | 8,890 | 35.83% | 0 | 0.00% |
| 1948 | 670 | 7.29% | 2,419 | 26.31% | 6,104 | 66.40% |
| 1944 | 140 | 1.98% | 6,590 | 93.12% | 347 | 4.90% |
| 1940 | 167 | 3.38% | 4,781 | 96.62% | 0 | 0.00% |
| 1936 | 152 | 2.21% | 6,728 | 97.79% | 0 | 0.00% |
| 1932 | 119 | 2.64% | 4,371 | 97.13% | 10 | 0.22% |
| 1928 | 444 | 12.33% | 3,158 | 87.67% | 0 | 0.00% |
| 1924 | 88 | 3.48% | 2,369 | 93.60% | 74 | 2.92% |
| 1920 | 295 | 10.81% | 2,434 | 89.19% | 0 | 0.00% |
| 1916 | 292 | 11.20% | 2,283 | 87.57% | 32 | 1.23% |
| 1912 | 23 | 1.30% | 1,557 | 88.17% | 186 | 10.53% |
| 1908 | 236 | 11.76% | 1,750 | 87.19% | 21 | 1.05% |
| 1904 | 122 | 9.09% | 1,220 | 90.91% | 0 | 0.00% |
| 1900 | 62 | 12.23% | 445 | 87.77% | 0 | 0.00% |
| 1896 | 468 | 32.91% | 925 | 65.05% | 29 | 2.04% |
| 1892 | 146 | 15.63% | 788 | 84.37% | 0 | 0.00% |
Education
Public Primary and Secondary Education
| Name | Enrollment | Notes |
|---|---|---|
| Richland School District 1 | 22,939[when?] | Central and southern portions of the county |
| Richland School District 2 | 28,398[when?] | Northeastern portions of the county |
| Lexington & Richland County School District Five | 16,680[when?] | Northwestern portions of the county |
| Fort Jackson | Varies | The on-post areas of Fort Jackson are served by the Department of Defense Education Activity (DoDEA) for elementary grades, with District 2 serving that area for secondary grades. |
Colleges and Universities
| Name | Enrollment[lower-alpha 2] | Notes |
|---|---|---|
| University of South Carolina | 34,731 | |
| Midlands Technical College | 8,794 | |
| Benedict College | 2,090 | HBCU |
| Medical University of South Carolina | 3,312[lower-alpha 3] | Main Campus: Charleston |
| Columbia International University | 2,039 | |
| South University-Columbia | 1,132 | Main Campus: Savannah, Georgia |
| Columbia College | 1,200 | |
| Allen University | 590 | HBCU |
| Virginia College-Columbia | 404 | Main Campus: Birmingham, Alabama |
| Remington College-Columbia | 272 | Main Campus: Lafayette, Louisiana |
Public library
| Branches | Circulation | Annual Visitors (counted once) |
|---|---|---|
| 11 | 3,300,000 | 364,000 |
Healthcare
| Hospital | Approximate Annual Patients |
|---|---|
| Medical University of South Carolina: Downtown[lower-alpha 4] | 1,000,000[37] |
| Medical University of South Carolina: Northeast[lower-alpha 4] | |
| Prisma Health Baptist: Taylor and Marion Streets | 1,500,000[38] |
| Prisma Health Baptist: Parkridge | |
| Prisma Health: Richland | |
| William Jennings Bryan Dorn Veterans Affairs Medical Center | 1,130,000[39] |
| Moncrief Army Community Hospital | 400,000[40] |
| Lexington Medical Center: Northeast |
Attractions


- Congaree National Park
- Fort Jackson National Cemetery
- Harbison State Forest
- Lake Murray
- Palmetto Trail
- Richland Library
- Riverbanks Zoo
- Sesquicentennial State Park
- South Carolina State Fair
- South Carolina State Museum
Top employers
| Rank | Employer | Employees |
|---|---|---|
| 1 | Prisma Health | 16,000 |
| 2 | Blue Cross Blue Shield | 10,000 |
| 3 | University of South Carolina | 7,000 |
| 4 | South Carolina Department of Corrections | 5,000 |
| 5 | Richland County School District One | 5,000 |
| 6 | South Carolina Department of Transportation | 5,000 |
| 7 | South Carolina Department of Mental Health | 5,000 |
| 8 | South Carolina Department of Social Services | 5,000 |
| 9 | Richland County School District Two | 4,000 |
| 10 | South Carolina Department of Health and Environmental Control | 4,000 |
Communities
| Type | Name | Pop. (2022 est.) | Notes | |
|---|---|---|---|---|
| City | Columbia | 139,148 | State capital, County seat and largest city in county. Partly in Lexington County[lower-alpha 5] | |
| Census-designated place | St. Andrews | 20,979 | ||
| Federal enclave[lower-alpha 6] | Fort Jackson | 15,423* | *2020 Count, Military base[46] | |
| Census-designated place | Dentsville | 14,671 | ||
| City | Cayce | 14,131 | Mostly in Lexington County[47] | |
| Town | Irmo | 11,640 | Mostly in Lexington County | |
| City | Forest Acres | 11,426 | ||
| Census-designated place | Woodfield | 9,141 | ||
| Town | Blythewood | 4,984 | Partly in Fairfield County | |
| Census-designated place | Capitol View | 4,653* | *2020 Count | |
| Census-designated place | Hopkins | 2,453 | ||
| Census-designated place | Arthurtown | 2,294* | *2020 Count | |
| Town | Elgin | 1,738 | Mostly in Kershaw County[48] | |
| Census-designated place | Gadsden | 1,310 | ||
| Federal enclave[lower-alpha 7] | McEntire Joint National Guard Base | 1,250* | * 2020, County, Military base | |
| Census-designated place | Olympia | 1,087* | *2020 Count | |
| Town | Arcadia Lakes | 880 | ||
| Town | Eastover | 647 | ||
Unincorporated communities and neighborhoods
- Boyden Arbor
- Cedar Creek
- Eau Claire
- Fairwold Acres
- Horrell Hill
- Killian
- Kingville
- Leesburg
- Lykes
- Mountain Brook
- Pontiac
- Riverside
- Spring Hill
- State Park
- Wateree
- Windsor Estates
Regions
- Dutch Fork
- Fort Jackson
- Intown/downtown
- Lower Richland
- Northeast Richland
- Upper Richland
In popular culture
Richland County was one of several counties across the country used as a filming location for the A&E reality documentary series Live PD, which worked in collaboration with the Richland County Sheriff's Department. The show first premiered in 2016 and aired for four years until its cancellation in 2020.[49] In 2021, Sheriff Leon Lott said the show will return to Richland County in the future.
See also
- List of counties in South Carolina
- National Register of Historic Places listings in Richland County, South Carolina
- South Carolina State Parks
- List of South Carolina state forests
- National Park Service
- Birch County, South Carolina, a proposed county that would include existing portions of Richland County
Notes
- In-person institutions only
- Part and full-time enrollment
- System-wide
- Formerly Providence Hospital
- A very small percentage of the city is in Lexington County.
- Though within the city limits of Columbia, Fort Jackson operates autonomously with a private population and closed borders.
- The air base operates autonomously with a private population and closed borders.
References
- "About Richland County". www.richlandcountysc.gov. Retrieved June 13, 2022.
- "U.S. Census Bureau QuickFacts: Richland County, South Carolina". www.census.gov. Retrieved June 11, 2022.
- "Find a County". National Association of Counties. Archived from the original on May 31, 2011. Retrieved June 7, 2011.
- "South Carolina - Legislative Acts Creating Counties / Districts". South Carolina General Assembly. 1785. Retrieved March 20, 2022.
- "Centers of Population by State: 2010". United States Census Bureau. Retrieved April 24, 2014.
- "About Richland County". Richland County, South Carolina. Retrieved March 20, 2022.
- "2010 Census Gazetteer Files". United States Census Bureau. August 22, 2012. Retrieved March 19, 2015.
- "The Comet Routes" (PDF). The Central Midlands Transit Authority. n.d. Archived (PDF) from the original on October 9, 2022. Retrieved June 28, 2020.
- "Columbia, SC (CLB)". Great American Stations. Retrieved June 28, 2020.
- "CSX in South Carolina". CSX. Retrieved June 28, 2020.
- "U.S. Census Bureau QuickFacts: Richland County, South Carolina". www.census.gov. Retrieved June 11, 2022.
- "U.S. Decennial Census". United States Census Bureau. Retrieved March 19, 2015.
- "Historical Census Browser". University of Virginia Library. Retrieved March 19, 2015.
- Forstall, Richard L., ed. (March 27, 1995). "Population of Counties by Decennial Census: 1900 to 1990". United States Census Bureau. Retrieved March 19, 2015.
- "Census 2000 PHC-T-4. Ranking Tables for Counties: 1990 and 2000" (PDF). United States Census Bureau. April 2, 2001. Archived (PDF) from the original on October 9, 2022. Retrieved March 19, 2015.
- "State & County QuickFacts". United States Census Bureau. Archived from the original on August 23, 2011. Retrieved November 25, 2013.
- "Census Bureau Quick Facts". U.S. Census Bureau. April 1, 2020. Retrieved March 20, 2022.
- "Explore Census Data". data.census.gov. Retrieved December 13, 2021.
- "DP-1 Profile of General Population and Housing Characteristics: 2010 Demographic Profile Data". United States Census Bureau. Archived from the original on February 13, 2020. Retrieved March 11, 2016.
- "Population, Housing Units, Area, and Density: 2010 - County". United States Census Bureau. Archived from the original on February 13, 2020. Retrieved March 11, 2016.
- "DP02 SELECTED SOCIAL CHARACTERISTICS IN THE UNITED STATES - 2006-2010 American Community Survey 5-Year Estimates". United States Census Bureau. Archived from the original on February 13, 2020. Retrieved March 11, 2016.
- "DP03 SELECTED ECONOMIC CHARACTERISTICS - 2006-2010 American Community Survey 5-Year Estimates". United States Census Bureau. Archived from the original on February 13, 2020. Retrieved March 11, 2016.
- "Richland County > Government > County Council > County Council Members". www.richlandonline.com. Retrieved March 13, 2018.
- "Institutions." South Carolina Department of Corrections. Retrieved on August 17, 2010.
- "Broad River Correctional Institution." South Carolina Department of Corrections. Retrieved on August 17, 2010.
- "Goodman Correctional Institution." South Carolina Department of Corrections. Retrieved on August 17, 2010.
- "Graham (Camille Griffin) Correctional Institution." South Carolina Department of Corrections. Retrieved on August 17, 2010. "4450 Broad River Road Columbia, SC 29210-4096"
- "Stevenson Correctional Institution." South Carolina Department of Corrections. Retrieved on August 17, 2010.
- "Campbell Pre-Release Center." South Carolina Department of Corrections. Retrieved on August 17, 2010.
- "Graham (Camille Griffin) Correctional Institution." South Carolina Department of Corrections. Retrieved on August 17, 2010. "The institution also functions as a major special management unit with the ability to house female death row inmates and county safekeepers."
- "Death Row/Capital Punishment." South Carolina Department of Corrections. Retrieved on August 17, 2010.
- S.C. Sheriff's Department Armored Vehicle with Belt-Fed Machine Gun Archived 2008-09-04 at the Wayback Machine
- Sheriff Lott's New Toy by Radley Balko September 1, 2008
- Leip, David. "Dave Leip's Atlas of U.S. Presidential Elections". uselectionatlas.org. Retrieved March 13, 2018.
- "2020 CENSUS - SCHOOL DISTRICT REFERENCE MAP: Richland County, SC" (PDF). U.S. Census Bureau. Archived (PDF) from the original on October 9, 2022. Retrieved February 5, 2022. - Text list - "Fort Jackson Schools" refers to the DoDEA schools on base.
- "Colleges in Richland County, South Carolina". Countyoffice.org. Retrieved July 7, 2022.
- "MUSC Fact Sheet". Medical University of South Carolina. Retrieved July 29, 2022.
- "FY21 highlights and statistics". prismahealth.org. Retrieved July 29, 2022.
- "Columbia VA Health Care System" (PDF). va.gov. United States Department of Veterans Affairs. Archived (PDF) from the original on October 9, 2022.
- "Fort Jackson, SC - Hospital". United States Army. Retrieved July 29, 2022.
- "Comrehensive Financial Report (2019)" (PDF). Richland County. 2019. Archived (PDF) from the original on October 9, 2022.
- "Richland County, SC Internet Mapping". RichlandMaps.com. n.d. Retrieved June 18, 2020.
- "U.S. Census Bureau Quick Facts". U.S. Census. July 2019. Retrieved June 18, 2020.
- "Richland County SC - Cities, Towns, Neighborhoods, & Subdivisions". southcarolina.hometownlocator.com. Retrieved June 11, 2022.
- "U.S. Census Bureau Quick Facts". U.S. Census. July 2019. Retrieved June 18, 2020.
- "Fort Jackson, South Carolina Demographics Data". Town Charts. 2010. Retrieved June 18, 2020.
- "Cayce, SC Profile: Facts & Data". southcarolina.hometownlocator.com. Retrieved September 17, 2022.
- "Elgin, SC Profile: Facts & Data". southcarolina.hometownlocator.com. Retrieved September 17, 2022.
- Schneider, Michael (June 11, 2020). "'Live PD': Inside A&E's Swift Decision to Cancel the Show, and Whether it Will Ever Return". Variety. Retrieved June 28, 2020.
External links
Places adjacent to Richland County, South Carolina | ||||||||||||||||
|---|---|---|---|---|---|---|---|---|---|---|---|---|---|---|---|---|
| ||||||||||||||||
Municipalities and communities of Richland County, South Carolina, United States | ||
|---|---|---|
County seat: Columbia | ||
| Cities | 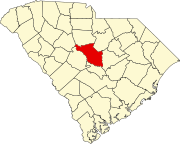 | |
| Towns | ||
| CDPs | ||
| Other communities |
| |
| Footnotes | ‡This populated place also has portions in an adjacent county or counties | |
| ||
Authority control | |
|---|---|
| General | |
| National libraries | |
| Other | |
На других языках
[de] Richland County (South Carolina)
Richland County[1] ist ein County im Bundesstaat South Carolina der Vereinigten Staaten. Der Verwaltungssitz (County Seat) ist Columbia.- [en] Richland County, South Carolina
[ru] Ричленд (округ, Южная Каролина)
Округ Ричленд (англ. Richland County) располагается в штате Южная Каролина, США. Официально образован в 1785 году. По состоянию на 2013 год, численность населения составляла 399 256 человека.Другой контент может иметь иную лицензию. Перед использованием материалов сайта WikiSort.org внимательно изучите правила лицензирования конкретных элементов наполнения сайта.
WikiSort.org - проект по пересортировке и дополнению контента Википедии