world.wikisort.org - USA
Lorain County is a county located in the northeastern portion of the U.S. state of Ohio. As of the 2020 census, the population was 312,964.[2] Its county seat is Elyria.[3] The county was physically established in 1822, becoming judicially independent in 1824.[4] Lorain County is part of the Cleveland-Elyria, OH Metropolitan Statistical Area. The county is home to Oberlin College.
Lorain County | |
|---|---|
U.S. county | |
 Old county building in Elyria | |
 Flag  Seal | |
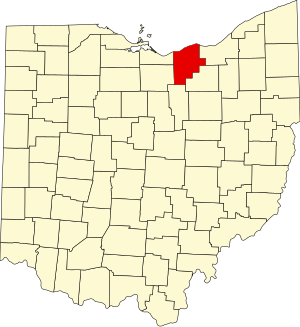 Location within the U.S. state of Ohio | |
 Ohio's location within the U.S. | |
| Coordinates: 41°28′N 82°09′W | |
| Country | |
| State | |
| Founded | April 1, 1824 |
| Named for | Lorraine in France[1] |
| Seat | Elyria |
| Largest city | Lorain |
| Area | |
| • Total | 923 sq mi (2,390 km2) |
| • Land | 491 sq mi (1,270 km2) |
| • Water | 432 sq mi (1,120 km2) 47%% |
| Population (2020) | |
| • Total | 312,964 |
| • Estimate (2021) | 315,595 |
| • Density | 340/sq mi (130/km2) |
| Congressional districts | 4th, 7th, 9th |
| Website | www |
History
Lorain County was established in 1822 from portions of several of its adjacent counties.[5] This county became judicially-independent in 1824. The original proposed name for the county was "Colerain".[6] The final name "Lorain" was chosen by Heman Ely, who had previously founded and named the city of Elyria. The county's name was based on the French province of Lorraine.[7]
Geography
According to the United States Census Bureau, the county has a total area of 923 square miles (2,390 km2), of which 491 square miles (1,270 km2) is land and 432 square miles (1,120 km2) (47%) is water.[8] It is the fourth-largest county in Ohio by total area.
Adjacent counties
- Cuyahoga County (east)
- Medina County (southeast)
- Ashland County (south)
- Huron County (southwest)
- Erie County (northwest)
Major highways
 Interstate 80 (Ohio Turnpike)
 Interstate 90 (Ohio Turnpike)
 Interstate 480
 U.S. Route 6
 U.S. Route 20
 State Route 2
 State Route 10
 State Route 18
 State Route 57
 State Route 58
 Ohio Route 82
 Ohio Route 83
 State Route 113
 Ohio Route 162
 Ohio Route 254
 Ohio Route 301
 Ohio Route 303
 Ohio Route 511
 Ohio Route 611
Demographics
| Historical population | |||
|---|---|---|---|
| Census | Pop. | %± | |
| 1830 | 5,696 | — | |
| 1840 | 18,467 | 224.2% | |
| 1850 | 26,086 | 41.3% | |
| 1860 | 29,744 | 14.0% | |
| 1870 | 30,308 | 1.9% | |
| 1880 | 35,526 | 17.2% | |
| 1890 | 40,295 | 13.4% | |
| 1900 | 54,857 | 36.1% | |
| 1910 | 76,037 | 38.6% | |
| 1920 | 90,612 | 19.2% | |
| 1930 | 109,206 | 20.5% | |
| 1940 | 112,390 | 2.9% | |
| 1950 | 148,162 | 31.8% | |
| 1960 | 217,500 | 46.8% | |
| 1970 | 256,843 | 18.1% | |
| 1980 | 274,909 | 7.0% | |
| 1990 | 271,126 | −1.4% | |
| 2000 | 284,664 | 5.0% | |
| 2010 | 301,356 | 5.9% | |
| 2020 | 312,964 | 3.9% | |
| 2021 (est.) | 315,595 | [9] | 0.8% |
| U.S. Decennial Census[10] 1790-1960[11] 1900-1990[12] 1990-2000[13] 2010-2020[2] | |||
As of the 2010 census, there were 301,356 people, 116,274 households, and 80,077 families residing in the county.[14] The population density was 613.6 inhabitants per square mile (236.9/km2). There were 127,036 housing units at an average density of 258.7 per square mile (99.9/km2).[15] The racial makeup of the county was 84.8% white, 8.6% black or African American, 0.9% Asian, 0.3% American Indian, 2.5% from other races, and 3.0% from two or more races. Those of Hispanic or Latino origin made up 8.4% of the population.[14] In terms of ancestry, 26.5% were German, 16.7% were Irish, 10.9% were English, 8.4% were Polish, 8.2% were Italian, 6.2% were American, and 5.2% were Hungarian.[16]
Of the 116,274 households, 32.6% had children under the age of 18 living with them, 50.5% were married couples living together, 13.5% had a female householder with no husband present, 31.1% were non-families, and 26.0% of all households were made up of individuals. The average household size was 2.51 and the average family size was 3.02. The median age was 40.0 years.[14]
The median income for a household in the county was $52,066 and the median income for a family was $62,082. Males had a median income of $49,146 versus $35,334 for females. The per capita income for the county was $25,002. About 10.3% of families and 13.1% of the population were below the poverty line, including 20.5% of those under age 18 and 8.0% of those age 65 or over.[17]
Politics
Lorain County has primarily leaned Democratic in recent presidential elections. It has voted for the Democratic candidate for president in 12 of the last 16 elections, including every one from 1988 to 2016. In 2016, however, the county was almost swept up in the unexpected Republican surge in the Rust Belt; Donald Trump came within 131 votes of being the first Republican to capture the county since Ronald Reagan in 1984. Four years later, he flipped the county Republican by a narrow majority.
| Year | Republican | Democratic | Third party | |||
|---|---|---|---|---|---|---|
| No. | % | No. | % | No. | % | |
| 2020 | 79,520 | 50.40% | 75,667 | 47.96% | 2,581 | 1.64% |
| 2016 | 66,818 | 47.54% | 66,949 | 47.63% | 6,795 | 4.83% |
| 2012 | 59,405 | 41.47% | 81,464 | 56.87% | 2,384 | 1.66% |
| 2008 | 59,068 | 40.22% | 85,276 | 58.07% | 2,515 | 1.71% |
| 2004 | 61,203 | 43.49% | 78,970 | 56.11% | 569 | 0.40% |
| 2000 | 47,957 | 42.75% | 59,809 | 53.32% | 4,414 | 3.93% |
| 1996 | 34,937 | 32.82% | 55,744 | 52.37% | 15,764 | 14.81% |
| 1992 | 36,803 | 31.03% | 50,962 | 42.97% | 30,840 | 26.00% |
| 1988 | 50,410 | 47.14% | 55,600 | 52.00% | 916 | 0.86% |
| 1984 | 57,379 | 50.77% | 52,970 | 46.87% | 2,672 | 2.36% |
| 1980 | 51,034 | 49.51% | 40,919 | 39.69% | 11,131 | 10.80% |
| 1976 | 39,459 | 41.66% | 52,387 | 55.31% | 2,865 | 3.02% |
| 1972 | 51,102 | 56.15% | 36,634 | 40.25% | 3,280 | 3.60% |
| 1968 | 34,252 | 39.95% | 42,642 | 49.74% | 8,833 | 10.30% |
| 1964 | 26,683 | 32.37% | 55,755 | 67.63% | 0 | 0.00% |
| 1960 | 39,361 | 47.51% | 43,487 | 52.49% | 0 | 0.00% |
| 1956 | 40,340 | 60.11% | 26,774 | 39.89% | 0 | 0.00% |
| 1952 | 33,825 | 56.36% | 26,194 | 43.64% | 0 | 0.00% |
| 1948 | 21,616 | 49.53% | 21,397 | 49.03% | 625 | 1.43% |
| 1944 | 23,866 | 48.59% | 25,254 | 51.41% | 0 | 0.00% |
| 1940 | 23,422 | 47.55% | 25,831 | 52.45% | 0 | 0.00% |
| 1936 | 15,906 | 37.29% | 24,393 | 57.19% | 2,357 | 5.53% |
| 1932 | 20,897 | 51.00% | 18,753 | 45.77% | 1,321 | 3.22% |
| 1928 | 24,386 | 63.83% | 13,607 | 35.62% | 212 | 0.55% |
| 1924 | 17,062 | 61.43% | 3,965 | 14.28% | 6,747 | 24.29% |
| 1920 | 18,125 | 65.84% | 8,640 | 31.39% | 764 | 2.78% |
| 1916 | 6,868 | 45.66% | 7,658 | 50.91% | 516 | 3.43% |
| 1912 | 2,226 | 16.34% | 4,591 | 33.71% | 6,804 | 49.95% |
| 1908 | 8,699 | 57.10% | 5,460 | 35.84% | 1,076 | 7.06% |
| 1904 | 9,001 | 70.16% | 2,700 | 21.04% | 1,129 | 8.80% |
| 1900 | 8,497 | 61.93% | 4,989 | 36.36% | 235 | 1.71% |
| 1896 | 7,801 | 63.28% | 4,367 | 35.43% | 159 | 1.29% |
| 1892 | 5,434 | 56.60% | 3,674 | 38.27% | 492 | 5.13% |
| 1888 | 5,235 | 57.32% | 3,311 | 36.25% | 587 | 6.43% |
| 1884 | 5,478 | 60.30% | 3,199 | 35.21% | 408 | 4.49% |
| 1880 | 5,609 | 66.25% | 2,752 | 32.51% | 105 | 1.24% |
| 1876 | 5,187 | 65.28% | 2,720 | 34.23% | 39 | 0.49% |
| 1872 | 4,432 | 67.71% | 2,097 | 32.03% | 17 | 0.26% |
| 1868 | 4,443 | 69.72% | 1,930 | 30.28% | 0 | 0.00% |
| 1864 | 4,600 | 73.65% | 1,646 | 26.35% | 0 | 0.00% |
| 1860 | 4,045 | 66.89% | 1,766 | 29.20% | 236 | 3.90% |
| 1856 | 3,604 | 70.97% | 1,420 | 27.96% | 54 | 1.06% |
Education
Higher education
- Lorain County Community College, Elyria
- Oberlin College, Oberlin
Public school districts
There are 20 public school districts in Lorain County. Those primarily in Lorain County are listed in bold. Each district's high school(s) and location is also listed.
- Amherst Exempted Village School District
- Amherst Marion L. Steele High School, Amherst
- Avon Local School District
- Avon High School, Avon
- Avon Lake City School District
- Avon Lake High School, Avon Lake
- Black River Local School District (also in Medina Co and Ashland Co.)
- Black River High School, Sullivan
- Clearview Local School District
- Clearview High School, Lorain
- Columbia Local School District
- Columbia High School, Columbia Station
- Elyria City School District
- Elyria High School, Elyria
- Firelands Local School District (also in Erie Co.)
- Firelands High School, Henrietta Twp (Oberlin)
- Keystone Local School District
- Keystone High School, LaGrange
- Lorain City School District
- Lorain High School, Lorain
- Mapleton Local School District (Primarily in Ashland Co.)
- Mapleton High School, Ashland
- Midview Local School District
- Midview High School, Eaton Twp (Grafton)
- New London Local School District (primarily in Huron Co.)
- New London High School, New London
- North Ridgeville City School District
- North Ridgeville High School, North Ridgeville
- Oberlin City School District
- Oberlin High School, Oberlin
- Olmsted Falls City Schools (primarily in Cuyahoga Co.)
- Olmsted Falls High School, Olmsted Falls
- Sheffield-Sheffield Lake City School District
- Brookside High School, Sheffield
- Strongsville City School District (primarily in Cuyahoga Co.)
- Strongsville High School, Strongsville
- Vermilion Local Schools (primarily in Erie Co.)
- Vermilion High School, Vermilion
- Wellington Exempted Village School District (also in Huron Co.)
- Wellington High School, Wellington
The county also includes the Lorain County Joint Vocational School District, which encompasses the entire county and serves students from the Amherst, Avon, Avon Lake, Clearview, Columbia, Elyria, Firelands, Keystone, Midview, North Ridgeville, Oberlin, Sheffield-Sheffield Lake and Wellington school districts from a 10-acre campus on a 100-acre site near the intersection of State Route 58 and U.S. Route 20 in Oberlin.[19]
Private high schools
- Elyria Catholic High School, Elyria
- Lake Ridge Academy, North Ridgeville
- Open Door Christian School, Elyria
- Christian Community School, North Eaton
- First Baptist Christian School, Elyria
Communities

Cities
- Amherst
- Avon
- Avon Lake
- Elyria (county seat)
- Lorain
- North Ridgeville
- Oberlin
- Sheffield Lake
- Vermilion
Villages
Townships
https://web.archive.org/web/20160715023447/http://www.ohiotownships.org/township-websites
Census-designated places
Unincorporated communities
- Belden
- Brentwood Lake
- Brighton
- Columbia Hills Corners
- Columbia Station
- Henrietta
- North Eaton
- Pittsfield
- Whiskyville
See also
- National Register of Historic Places listings in Lorain County, Ohio
- USS Lorain County (LST-1177)
References
- Gannett, Henry (1905). The Origin of Certain Place Names in the United States. U.S. Government Printing Office. p. 190.
- "State & County QuickFacts". United States Census Bureau. Retrieved July 7, 2022.
- "Find a County". National Association of Counties. Retrieved June 7, 2011.
- "Ohio: Individual County Chronologies". Ohio Atlas of Historical County Boundaries. The Newberry Library. 2007. Archived from the original on April 6, 2016. Retrieved February 14, 2015.
- "Lorain County - Ohio History Central". ohiohistorycentral.org. Ohio History Connection. Retrieved October 26, 2022.
- Sandusky Register (newspaper); Sandusky, Ohio, 1822
- Wright, George Frederick (1916). A Standard History of Lorain County, Ohio: An Authentic Narrative of the Past, with Particular Attention to the Modern Era in the Commercial, Industrial, Civic and Social Development. A Chronicle of the People, with Family Lineage and Memoirs. Lewis publishing Company. pp. 625–627.
{{cite book}}: CS1 maint: date and year (link) - "2010 Census Gazetteer Files". United States Census Bureau. August 22, 2012. Archived from the original on May 4, 2014. Retrieved February 8, 2015.
- "Annual Estimates of the Resident Population for Counties: April 1, 2020 to July 1, 2021". Retrieved July 7, 2022.
- "U.S. Decennial Census". United States Census Bureau. Retrieved February 8, 2015.
- "Historical Census Browser". University of Virginia Library. Retrieved February 8, 2015.
- Forstall, Richard L., ed. (March 27, 1995). "Population of Counties by Decennial Census: 1900 to 1990". United States Census Bureau. Retrieved February 8, 2015.
- "Census 2000 PHC-T-4. Ranking Tables for Counties: 1990 and 2000" (PDF). United States Census Bureau. April 2, 2001. Retrieved February 8, 2015.
- "DP-1 Profile of General Population and Housing Characteristics: 2010 Demographic Profile Data". United States Census Bureau. Archived from the original on February 13, 2020. Retrieved December 27, 2015.
- "Population, Housing Units, Area, and Density: 2010 - County". United States Census Bureau. Archived from the original on February 13, 2020. Retrieved December 27, 2015.
- "DP02 SELECTED SOCIAL CHARACTERISTICS IN THE UNITED STATES – 2006-2010 American Community Survey 5-Year Estimates". United States Census Bureau. Archived from the original on February 13, 2020. Retrieved December 27, 2015.
- "DP03 SELECTED ECONOMIC CHARACTERISTICS – 2006-2010 American Community Survey 5-Year Estimates". United States Census Bureau. Archived from the original on February 13, 2020. Retrieved December 27, 2015.
- Leip, David. "Dave Leip's Atlas of U.S. Presidential Elections". uselectionatlas.org. Retrieved April 7, 2018.
- JVS. "Lorain County JVS - About the Lorain County JVS". www.lcjvs.com. Archived from the original on December 22, 2011. Retrieved April 7, 2018.
External links
- Lorain County Government's website
- Lorain County Sheriff's Office
- Lorain County Historical Society's website
- Lorain County History Project
- [chrome-extension://efaidnbmnnnibpcajpcglclefindmkaj/https://www.loraincountyohio.gov/DocumentCenter/View/1633/Commissioners-History?bidId=]
Places adjacent to Lorain County, Ohio | |
|---|---|
Municipalities and communities of Lorain County, Ohio, United States | ||
|---|---|---|
County seat: Elyria | ||
| Cities |
|  |
| Villages | ||
| Townships | ||
| CDPs | ||
| Unincorporated communities |
| |
| Ghost town |
| |
| Footnotes | ‡This populated place also has portions in an adjacent county or counties | |
| ||
Authority control | |
|---|---|
| General | |
| National libraries | |
На других языках
[de] Lorain County
Lorain County[3] ist ein County im Bundesstaat Ohio der Vereinigten Staaten. Der Verwaltungssitz (County Seat) ist Elyria.- [en] Lorain County, Ohio
[ru] Лорейн (округ)
Округ Лорейн (англ. Lorain County) — округ в штате Огайо, США. Официально образован 26-го декабря 1822 года. По состоянию на 2010 год, численность населения составляла 301 356 человек.Другой контент может иметь иную лицензию. Перед использованием материалов сайта WikiSort.org внимательно изучите правила лицензирования конкретных элементов наполнения сайта.
WikiSort.org - проект по пересортировке и дополнению контента Википедии