world.wikisort.org - Canada
Beauharnois-Salaberry is a regional county municipality in the Montérégie region of Quebec, Canada. Its seat is Beauharnois.[2]
Beauharnois-Salaberry | |
|---|---|
Regional county municipality | |
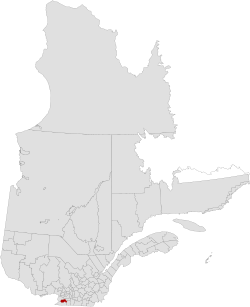 Location in province of Quebec | |
| Coordinates: 45.32°N 73.93°W[1] | |
| Country | |
| Province | |
| Region | Montérégie |
| Effective | January 1, 1982 |
| County seat[2] | Beauharnois |
| Government | |
| • Type | Prefecture |
| • Prefect | Yves Daoust |
| Area | |
| • Total | 523.10 km2 (201.97 sq mi) |
| • Land | 471.26 km2 (181.95 sq mi) |
| Population (2016)[3] | |
| • Total | 64,320 |
| • Density | 136.5/km2 (354/sq mi) |
| • Change 2011–2016 | |
| • Dwellings | 30,151 |
| Time zone | UTC−5 (EST) |
| • Summer (DST) | UTC−4 (EDT) |
| Area codes | 450 and 579 |
| Website | www |
History
The RCM was formed by combining the historic counties of Beauharnois and Châteauguay.
Subdivisions
There are 7 subdivisions within the RCM:[2]
- Cities & Towns (2)
- Municipalities (4)
- Parishes (1)
Demographics
| Year | Pop. | ±% |
|---|---|---|
| 1991 | 59,785 | — |
| 1996 | 59,769 | −0.0% |
| 2001 | 59,137 | −1.1% |
| 2006 | 60,802 | +2.8% |
| 2011 | 61,950 | +1.9% |
| 2016 | 64,320 | +3.8% |
| [4][5][3] | ||
Canada census – Beauharnois-Salaberry Regional County Municipality community profile
| 2021 | 2016 | 2011 | |
|---|---|---|---|
| Population | 68,322 (+6.2% from 2016) | 64,320 (+3.8% from 2011) | 61,950 (+1.9% from 2006) |
| Land area | 468.48 km2 (180.88 sq mi) | 471.26 km2 (181.95 sq mi) | 470.68 km2 (181.73 sq mi) |
| Population density | 145.8/km2 (378/sq mi) | 136.5/km2 (354/sq mi) | 131.6/km2 (341/sq mi) |
| Median age | 44.8 (M: 43.6, F: 46.4) | 46.5 (M: 44.7, F: 48.2) | 46.1 (M: 44.6, F: 47.4) |
| Total private dwellings | 31,245 | 30,151 | 28,829 |
| Median household income | $54,509 | $48,621 |
Language
| Canada Census Mother Tongue – Beauharnois-Salaberry Regional County Municipality[4][5][3] | ||||||||||||||||||
|---|---|---|---|---|---|---|---|---|---|---|---|---|---|---|---|---|---|---|
| Census | Total | French |
English |
French & English |
Other | |||||||||||||
| Year | Responses | Count | Trend | Pop % | Count | Trend | Pop % | Count | Trend | Pop % | Count | Trend | Pop % | |||||
2016 |
63,060 |
59,430 | 94.2% | 2,050 | 3.3% | 595 | 0.9% | 985 | 1.6% | |||||||||
2011 |
61,180 |
58,000 | 94.80% | 1,925 | 3.15% | 645 | 1.05% | 610 | 1.00% | |||||||||
2006 |
59,405 |
56,540 | 95.18% | 1,695 | 2.85% | 350 | 0.59% | 820 | 1.38% | |||||||||
2001 |
58,060 |
55,360 | 95.35% | 1,780 | 3.07% | 410 | 0.71% | 510 | 0.88% | |||||||||
1996 |
58,790 |
56,315 | n/a | 95.79% | 1,570 | n/a | 2.67% | 480 | n/a | 0.82% | 425 | n/a | 0.72% | |||||
Transportation
Access routes
Highways and numbered routes that run through the municipality, including external routes that start or finish at the county border:[11]
- Autoroutes
 A-30
A-30 A-530
A-530
- Principal Highways
 Route 132
 Route 138
- Secondary Highways
 Route 201
 Route 203
 Route 205
 Route 207
 Route 236
- External Routes
- None
Attractions
- Beauharnois Canal
- Beauharnois Hydroelectric Generating Station (Melocheville)
- Deux-Rives Ecomuseum (Salaberry-de-Valleyfield)
- Howick Airport (Saint-Étienne-de-Beauharnois)
- Pointe-du-Bruisson Archaeological Park (Melocheville)
- Valleyfield Airport (Saint-Stanislas-de-Kostka)
Protected areas:
- Îles-de-Paix National Fauna Reserve
- Îles-de-Saint-Timothée Regional Park
See also
- List of regional county municipalities and equivalent territories in Quebec
References
- Reference number 141118 of the Commission de toponymie du Québec (in French)
- Geographic code 700 in the official Répertoire des municipalités (in French)
- "Census Profile, 2016 Census: Beauharnois-Salaberry, Municipalité régionale de comté [Census division], Quebec". Statistics Canada. Retrieved November 26, 2019.
- Statistics Canada: 1996, 2001, 2006, 2011 census
- "(Code 2470) Census Profile". 2011 census. Statistics Canada. 2012.
- "2021 Community Profiles". 2021 Canadian Census. Statistics Canada. February 4, 2022. Retrieved 2022-04-27.
- "2016 Community Profiles". 2016 Canadian Census. Statistics Canada. August 12, 2021. Retrieved 2019-11-26.
- "2011 Community Profiles". 2011 Canadian Census. Statistics Canada. March 21, 2019. Retrieved 2014-01-27.
- "2006 Community Profiles". 2006 Canadian Census. Statistics Canada. August 20, 2019.
- "2001 Community Profiles". 2001 Canadian Census. Statistics Canada. July 18, 2021.
- Official Transport Quebec Road Map
External links
 Media related to Beauharnois-Salaberry Regional County Municipality at Wikimedia Commons
Adjacent Counties & Equivalent Territories | ||||||||||||||||
|---|---|---|---|---|---|---|---|---|---|---|---|---|---|---|---|---|
| ||||||||||||||||
| Regional county municipalities and equivalent territories | |
|---|---|
| Municipalities |
|
Administrative divisions of Quebec | |
| Authority control |
|
|---|
На других языках
[de] Beauharnois-Salaberry
Beauharnois-Salaberry ist eine regionale Grafschaftsgemeinde (französisch municipalités régionales de comté, MRC) in der kanadischen Provinz Québec.- [en] Beauharnois-Salaberry Regional County Municipality
Текст в блоке "Читать" взят с сайта "Википедия" и доступен по лицензии Creative Commons Attribution-ShareAlike; в отдельных случаях могут действовать дополнительные условия.
Другой контент может иметь иную лицензию. Перед использованием материалов сайта WikiSort.org внимательно изучите правила лицензирования конкретных элементов наполнения сайта.
Другой контент может иметь иную лицензию. Перед использованием материалов сайта WikiSort.org внимательно изучите правила лицензирования конкретных элементов наполнения сайта.
2019-2025
WikiSort.org - проект по пересортировке и дополнению контента Википедии
WikiSort.org - проект по пересортировке и дополнению контента Википедии