world.wikisort.org - USA
Cabell County is located in the U.S. state of West Virginia. As of the 2020 census, the population was 94,350,[1] making it West Virginia's fourth most-populous county. Its county seat is Huntington.[2] The county was organized in 1809 and named for William H. Cabell, the Governor of Virginia from 1805 to 1808.[3] Cabell County is part of the Huntington-Ashland, WV-KY-OH Metropolitan Statistical Area.
Cabell County | |
|---|---|
U.S. county | |
 Cabell County Courthouse in Huntington | |
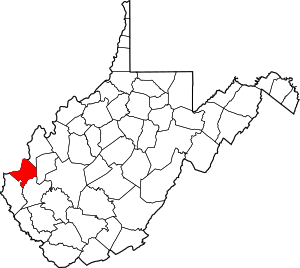 Location within the U.S. state of West Virginia | |
 West Virginia's location within the U.S. | |
| Coordinates: 38°25′N 82°14′W | |
| Country | |
| State | |
| Founded | January 2, 1809 |
| Named for | William H. Cabell |
| Seat | Huntington |
| Largest city | Huntington |
| Area | |
| • Total | 288 sq mi (750 km2) |
| • Land | 281 sq mi (730 km2) |
| • Water | 7.0 sq mi (18 km2) 2.4%% |
| Population (2020) | |
| • Total | 94,350 |
| • Estimate (2021) | 93,418 |
| • Density | 330/sq mi (130/km2) |
| Time zone | UTC−5 (Eastern) |
| • Summer (DST) | UTC−4 (EDT) |
| Congressional district | 3rd |
| Website | www |
Geography
According to the United States Census Bureau, the county has an area of 288 square miles (750 km2), of which 281 square miles (730 km2) is land and 7.0 square miles (18 km2) (2.4%) is water.[4]
In 1863, West Virginia's counties were divided into civil townships, with the intention of encouraging local government. This proved impractical in the heavily rural state, and in 1872 the townships were converted into magisterial districts.[5] Cabell County was divided into five districts: Barboursville, Grant, Guyandotte, McComas, and Union. Two additional districts, Gideon and Kyle, were established between 1920 and 1930. Between 1980 and 1990, the county was redivided into five districts: District 1, District 2, District 3, District 4, and District 5. The names and boundaries of the historic districts were preserved in the form of tax and assessment districts.[6]
Major highways
 Interstate 64
 U.S. Route 52
 U.S. Route 60
 West Virginia Route 2
 West Virginia Route 10
 West Virginia Route 152
 West Virginia Route 527
Adjacent counties
- Gallia County, Ohio
- Mason County (northeast)
- Putnam County (east)
- Lincoln County (southeast)
- Wayne County (southwest)
- Lawrence County, Ohio (northwest)
Demographics
| Historical population | |||
|---|---|---|---|
| Census | Pop. | %± | |
| 1810 | 2,717 | — | |
| 1820 | 4,789 | 76.3% | |
| 1830 | 5,884 | 22.9% | |
| 1840 | 8,163 | 38.7% | |
| 1850 | 6,299 | −22.8% | |
| 1860 | 8,020 | 27.3% | |
| 1870 | 6,429 | −19.8% | |
| 1880 | 13,744 | 113.8% | |
| 1890 | 23,595 | 71.7% | |
| 1900 | 29,252 | 24.0% | |
| 1910 | 46,685 | 59.6% | |
| 1920 | 65,746 | 40.8% | |
| 1930 | 90,786 | 38.1% | |
| 1940 | 97,459 | 7.4% | |
| 1950 | 108,035 | 10.9% | |
| 1960 | 108,202 | 0.2% | |
| 1970 | 106,918 | −1.2% | |
| 1980 | 106,835 | −0.1% | |
| 1990 | 96,827 | −9.4% | |
| 2000 | 96,784 | 0.0% | |
| 2010 | 96,319 | −0.5% | |
| 2020 | 94,350 | −2.0% | |
| 2021 (est.) | 93,418 | [7] | −1.0% |
| U.S. Decennial Census[8] 1790–1960[9] 1900–1990[10] 1990–2000[11] 2010–2020[1] | |||

2000 census
As of the census[12] of 2000, there were 96,784 people, 41,180 households, and 25,490 families living in the county. The population density was 344 inhabitants per square mile (133/km2). There were 45,615 housing units at an average density of 162 per square mile (63/km2). The racial makeup of the county was 93.37% White, 4.29% Black or African American, 0.18% Native American, 0.77% Asian, 0.04% Pacific Islander, 0.20% from other races, and 1.14% from two or more races. 0.68% of the population were Hispanic or Latino of any race.
There were 41,180 households, out of which 25.20% had children under the age of 18 living with them, 47.10% were married couples living together, 11.60% had a female householder with no husband present, and 38.10% were non-families. 31.30% of all households were made up of individuals, and 12.50% had someone living alone who was 65 years of age or older. The average household size was 2.27 and the average family size was 2.85.
In the county, the population was spread out, with 20.00% under the age of 18, 13.50% from 18 to 24, 26.80% from 25 to 44, 23.60% from 45 to 64, and 16.00% who were 65 years of age or older. The median age was 38 years. For every 100 females there were 91.40 males. For every 100 females age 18 and over, there were 88.50 males.
The median income for a household in the county was $28,479, and the median income for a family was $37,691. Males had a median income of $31,780 versus $22,243 for females. The per capita income for the county was $17,638. About 13.70% of families and 19.20% of the population were below the poverty line, including 24.60% of those under age 18 and 10.80% of those age 65 or over.
2010 census
As of the 2010 United States Census, there were 96,319 people, 41,223 households, and 24,308 families living in the county.[13] The population density was 342.8 inhabitants per square mile (132.4/km2). There were 46,169 housing units at an average density of 164.3 per square mile (63.4/km2).[14] The racial makeup of the county was 91.6% white, 5.0% black or African American, 1.0% Asian, 0.2% American Indian, 0.3% from other races, and 2.0% from two or more races. Those of Hispanic or Latino origin made up 1.1% of the population.[13] In terms of ancestry, 17.2% were Irish, 16.5% were English, 15.9% were German, and 10.7% were American.[15]
Of the 41,223 households, 26.1% had children under the age of 18 living with them, 42.3% were married couples living together, 12.3% had a female householder with no husband present, 41.0% were non-families, and 33.5% of all households were made up of individuals. The average household size was 2.24 and the average family size was 2.85. The median age was 38.7 years.[13]
The median income for a household in the county was $34,492 and the median income for a family was $48,323. Males had a median income of $39,523 versus $28,952 for females. The per capita income for the county was $21,907. About 15.3% of families and 20.6% of the population were below the poverty line, including 29.0% of those under age 18 and 10.7% of those age 65 or over.[16]
Communities
City
- Huntington (county seat; partly in Wayne County)
Town
Village
Magisterial districts
- District 1
- District 2
- District 3
- District 4
- District 5
Census-designated places
Unincorporated communities
Politics
For most of its history, Cabell County was a swing county, voting for the national winner in every presidential election from 1892 to 2004, aside from 1924 and 1960. However, similar to the rest of West Virginia, it has become a Republican stronghold, with Donald Trump winning the county by a margin of 25 percent over Hillary Clinton in 2016 and by a margin of 18 percent over Joe Biden in 2020.
| Year | Republican | Democratic | Third party | |||
|---|---|---|---|---|---|---|
| No. | % | No. | % | No. | % | |
| 2020 | 21,721 | 58.14% | 14,994 | 40.13% | 645 | 1.73% |
| 2016 | 19,850 | 59.10% | 11,447 | 34.08% | 2,288 | 6.81% |
| 2012 | 17,985 | 55.93% | 13,568 | 42.19% | 605 | 1.88% |
| 2008 | 18,793 | 54.11% | 15,292 | 44.03% | 647 | 1.86% |
| 2004 | 21,035 | 55.43% | 16,583 | 43.70% | 332 | 0.87% |
| 2000 | 16,440 | 51.03% | 14,896 | 46.24% | 880 | 2.73% |
| 1996 | 13,179 | 40.48% | 16,277 | 49.99% | 3,104 | 9.53% |
| 1992 | 13,203 | 39.16% | 15,111 | 44.82% | 5,401 | 16.02% |
| 1988 | 17,197 | 52.65% | 15,368 | 47.05% | 97 | 0.30% |
| 1984 | 21,815 | 58.26% | 15,513 | 41.43% | 117 | 0.31% |
| 1980 | 19,482 | 49.21% | 17,732 | 44.79% | 2,374 | 6.00% |
| 1976 | 19,644 | 48.56% | 20,811 | 51.44% | 0 | 0.00% |
| 1972 | 29,582 | 67.39% | 14,312 | 32.61% | 0 | 0.00% |
| 1968 | 19,418 | 45.05% | 19,018 | 44.12% | 4,666 | 10.83% |
| 1964 | 16,957 | 37.36% | 28,437 | 62.64% | 0 | 0.00% |
| 1960 | 26,988 | 56.34% | 20,911 | 43.66% | 0 | 0.00% |
| 1956 | 28,882 | 61.07% | 18,408 | 38.93% | 0 | 0.00% |
| 1952 | 27,461 | 55.32% | 22,179 | 44.68% | 0 | 0.00% |
| 1948 | 18,599 | 43.86% | 23,680 | 55.84% | 131 | 0.31% |
| 1944 | 19,861 | 46.32% | 23,020 | 53.68% | 0 | 0.00% |
| 1940 | 21,027 | 42.78% | 28,125 | 57.22% | 0 | 0.00% |
| 1936 | 19,003 | 40.95% | 27,319 | 58.87% | 87 | 0.19% |
| 1932 | 17,999 | 42.91% | 23,498 | 56.01% | 453 | 1.08% |
| 1928 | 21,091 | 57.65% | 15,340 | 41.93% | 152 | 0.42% |
| 1924 | 15,581 | 47.26% | 16,211 | 49.17% | 1,177 | 3.57% |
| 1920 | 13,170 | 50.11% | 12,845 | 48.87% | 268 | 1.02% |
| 1916 | 5,728 | 46.18% | 6,446 | 51.97% | 229 | 1.85% |
| 1912 | 1,798 | 17.49% | 4,793 | 46.62% | 3,690 | 35.89% |
Notable people
- James F. Adams, Union Army soldier in the American Civil War, and recipient of the Medal of Honor.
- George Baumgardner, MLB player for the St. Louis Browns.
- Wayne Chapman, football coach.
- Brad Dourif, actor.
- Catherine Shipe East, government worker and feminist.
- Diamond Teeth Mary, blues singer.
- Hal Greer, NBA player.
- Thomas Hannan, revolutionary war soldier, settler of Cabell County.[18][19][20][21]
- Hawkshaw Hawkins, bluegrass singer.
- Albert G. Jenkins, planter, lawyer, politician, and Confederate general.
- Alberta Gallatin Jenkins, stage and screen actress, daughter of Albert G. Jenkins.
- Evan Jenkins: State Senator and US Congressman of West Virginia.
- Ezra Midkiff, MLB player for the Cincinnati Reds and the New York Yankees.
- Katie Lee, television personality and chef.
- O.J. Mayo, NBA player.
- Breece D’J Pancake, short story author.
- Brett Rowe, stock car driver.
- Sampson Sanders, slaveholder famous for freeing his 51 slaves upon his death in 1849. [22] [23]
- Eli C. D. Shortridge, third Governor of North Dakota from 1893 to 1895; born in Cabell County.[24]
- Jason Starkey, NFL player for the Arizona Cardinals.
- Ruth Sullivan, autism advocate.
- Milton Supman, comedian known professionally as Soupy Sales (attended Huntington High School).
- Phil Swann, singer.
- Jim Thornton, announcer on Wheel of Fortune.
- Bill Walker, NBA player.
- Kayla Williams, gymnast and gold medalist (attended Huntington High).
- Carter G. Woodson, founder of Black History Month (moved to attend Douglass High School).
- Steve Yeager, MLB player for the Los Angeles Dodgers and the Seattle Mariners, co-MVP of the 1981 World Series.
See also
- Beech Fork State Park
- Green Bottom Wildlife Management Area
- National Register of Historic Places listings in Cabell County, West Virginia
References
- "State & County QuickFacts". United States Census Bureau. Retrieved July 6, 2022.
- "Find a County". National Association of Counties. Archived from the original on May 31, 2011. Retrieved June 7, 2011.
- "Cabell County history sources". wvculture.org. Archived from the original on October 29, 2015. Retrieved March 8, 2017.
- "2010 Census Gazetteer Files". United States Census Bureau. August 22, 2012. Retrieved July 23, 2015.
- Otis K. Rice & Stephen W. Brown, West Virginia: A History, 2nd ed., University Press of Kentucky, Lexington (1993), p. 240.
- United States Census Bureau, U.S. Decennial Census, Tables of Minor Civil Divisions in West Virginia, 1870–2010.
- "Annual Estimates of the Resident Population for Counties: April 1, 2020 to July 1, 2021". Retrieved July 6, 2022.
- "U.S. Decennial Census". United States Census Bureau. Retrieved January 9, 2014.
- "Historical Census Browser". University of Virginia Library. Retrieved January 9, 2014.
- "Population of Counties by Decennial Census: 1900 to 1990". United States Census Bureau. Retrieved January 9, 2014.
- "Census 2000 PHC-T-4. Ranking Tables for Counties: 1990 and 2000" (PDF). United States Census Bureau. Archived (PDF) from the original on October 9, 2022. Retrieved January 9, 2014.
- "U.S. Census website". United States Census Bureau. Retrieved May 14, 2011.
- "DP-1 Profile of General Population and Housing Characteristics: 2010 Demographic Profile Data". United States Census Bureau. Archived from the original on February 13, 2020. Retrieved April 3, 2016.
- "Population, Housing Units, Area, and Density: 2010 - County". United States Census Bureau. Archived from the original on February 13, 2020. Retrieved April 3, 2016.
- "DP02 SELECTED SOCIAL CHARACTERISTICS IN THE UNITED STATES – 2006-2010 American Community Survey 5-Year Estimates". United States Census Bureau. Archived from the original on February 13, 2020. Retrieved April 3, 2016.
- "DP03 SELECTED ECONOMIC CHARACTERISTICS – 2006-2010 American Community Survey 5-Year Estimates". United States Census Bureau. Archived from the original on February 13, 2020. Retrieved April 3, 2016.
- Leip, David. "Dave Leip's Atlas of U.S. Presidential Elections". uselectionatlas.org. Retrieved March 27, 2018.
- Averill, James P. 1882. History of Gallia County. H. H. Hardesty & Co. Publishers: Chicago.Deeds and wills.
- Laidley, W.S. 1901. "The West End of West Virginia." The West Virginia Historical Magazine Quarterly 1:5-41. The West Virginia Historical and Antiquarian Society.
- Miller, Thomas Condit, and Hu Maxwell. 1913. West Virginia and Its People. New York: Lewis Historical Publishing Company.
- Brant, Fuller, & Co. 1891. History of the Great Kanawha Valley: With Family History and Biographical Sketches. Madison, Wisconsin.
- "Sampson Sanders". cabellcountydoorstothepast.com. Retrieved September 6, 2022.
- "Sampson Sanders". WVPB. Retrieved September 6, 2022.
- "North Dakota Governor Eli C. D. Shortridge". National Governors Association. Retrieved September 29, 2012.
External links
- County website
- Cabell-Huntington Convention and Visitors Bureau
- Cabell County Assessor
- Cabell County Schools
- Cabell County Public Library
Places adjacent to Cabell County, West Virginia | ||||||||||||||||
|---|---|---|---|---|---|---|---|---|---|---|---|---|---|---|---|---|
| ||||||||||||||||
Municipalities and communities of Cabell County, West Virginia, United States | ||
|---|---|---|
County seat: Huntington | ||
| City |  | |
| Town | ||
| Village | ||
| CDPs | ||
| Other communities | ||
| Footnotes | ‡This populated place also has portions in an adjacent county or counties | |
| ||
Huntington-Ashland-Ironton metropolitan area | ||
|---|---|---|
| Principal cities | 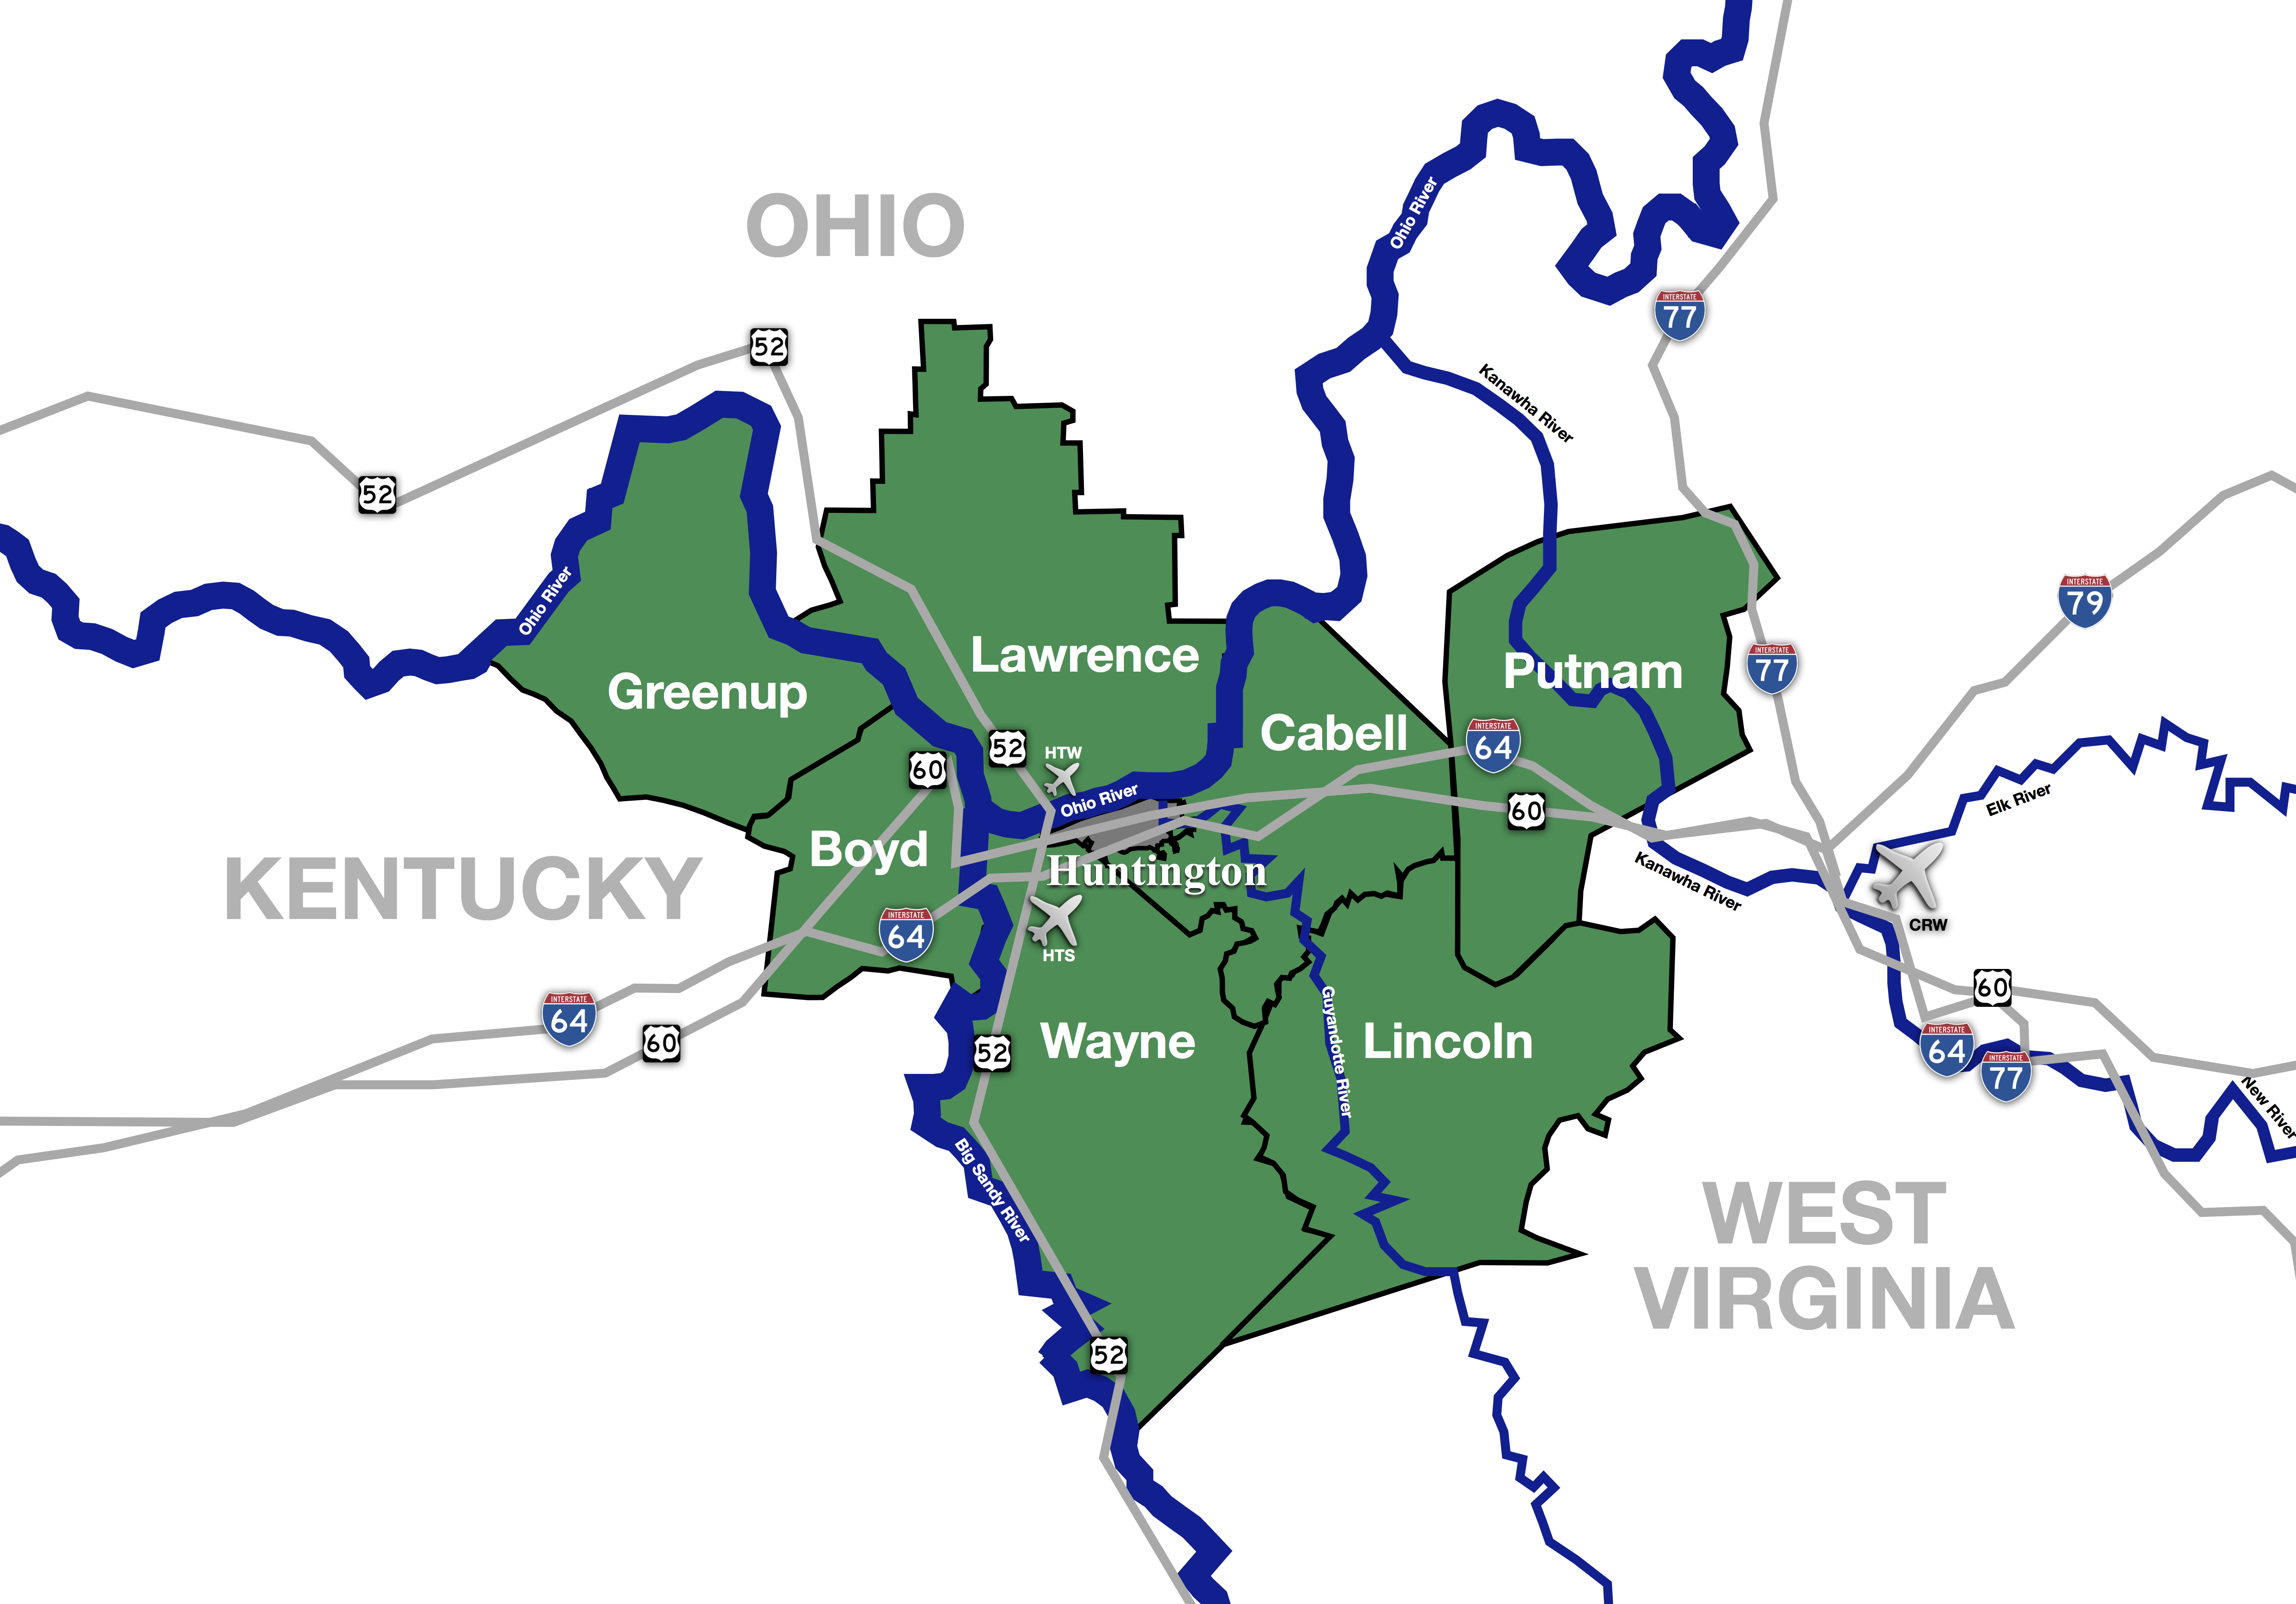 | |
| Municipalities with population over 5,000 | ||
| Municipalities with population 1,000–5,000 | ||
| Municipalities with population under 1,000 | ||
| West Virginia counties | ||
| Kentucky counties | ||
| Ohio counties | ||
State of West Virginia | |
|---|---|
Charleston (capital) | |
| Topics |
|
| Society |
|
| Insignia |
|
| Regions |
|
| Metro areas |
|
| Largest cities | |
| Counties |
|
Authority control | |
|---|---|
| General | |
| National libraries | |
На других языках
[de] Cabell County
Cabell County[1] ist ein County im US-Bundesstaat West Virginia der Vereinigten Staaten. Der Verwaltungssitz (County Seat) ist Huntington.- [en] Cabell County, West Virginia
[ru] Кабелл (округ)
Округ Кабелл (англ. Cabell County) располагается в США, штате Западная Виргиния. Официально образован 2-го января 1809 года, получил своё название в честь американского политического и государственного деятеля Уильяма Кабелла (англ.) (рус.. По состоянию на 2012 год, численность населения составляла 96 974 человека.Другой контент может иметь иную лицензию. Перед использованием материалов сайта WikiSort.org внимательно изучите правила лицензирования конкретных элементов наполнения сайта.
WikiSort.org - проект по пересортировке и дополнению контента Википедии