world.wikisort.org - United_Kingdom
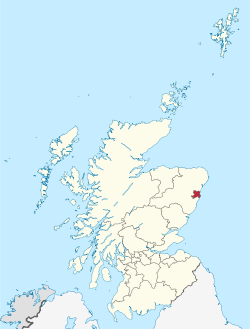
Aberdeen City Council represents the Aberdeen City council area of Scotland.
Aberdeen City Council
Scots: Aiberdeen Ceitie Cooncil Scottish Gaelic: Comhairle Cathair Obar Dheathain | |
|---|---|
 Aberdeen Town House | |
 Coat of arms | |
 | |
| Sovereign State | |
| Constituent Country | |
| Admin HQ | Aberdeen |
| Government | |
| • Body | Aberdeen City Council |
| • Control | No overall control: SNP-LD coalition |
| • Lord Provost | Cllr David Cameron |
| • Council co-leaders | Cllr Alex Nicoll Cllr Ian Yuill |
| • MPs | Kirsty Blackman Richard Thomson Stephen Flynn |
| • MSPs | Jackie Dunbar Kevin Stewart Audrey Nicoll |
| Area | |
| • Total | 71.7 sq mi (185.7 km2) |
| • Rank | Ranked 25th |
| Population (mid-2019 est.) | |
| • Total | 227,560 |
| • Rank | Ranked 8th |
| • Density | 3,200/sq mi (1,200/km2) |
| ONS code | S12000033 |
| ISO 3166 code | GB-ABE |
| Website | www |
The council area was created in 1996, under the Local Government etc. (Scotland) Act 1994. However, a sense of Aberdeen as a city, with its own city council, can be traced back to 1900, when the county of the city of Aberdeen was created.
From 1900 to 1975 the area and its administrative body were called ‘The County of the City of Aberdeen’ but unofficially either as ‘Aberdeen Corporation’, ‘Corporation of the City of Aberdeen’ or (more rarely) ‘Aberdeen City Council’.
In 1975, under the Local Government (Scotland) Act 1973, counties of cities were abolished. The area of the former county of a city was combined with Bucksburn, Dyce, Newhills, Old Machar, Peterculter and the Stoneywood areas of the county of Aberdeen, and the Nigg area of the county of Kincardine, (including Cove Bay) to form the Aberdeen district of the Grampian region. The title of the administrative body was then "City of Aberdeen District Council."
This district became the now existing unitary council area in 1996. On 9 May 1995, by resolution under section 23 of the Local Government (Scotland) Act 1973, the City of Aberdeen Council changed the name of the local government area of "City of Aberdeen" to "Aberdeen City".[1] and the administrative body's title to "Aberdeen City Council."
Composition

Aberdeen City Council currently comprises 45 councillors, who represent the city's wards, and is headed by the Lord Provost.[2] Prior to the 2012 council election there were 43 members of Aberdeen City Council.
Between 2003 and 2007, the council was under the control of a Liberal Democrat and Conservative coalition, holding 23 of the 43 seats on the council. Prior to the 2003 election, the council had been considered a Labour stronghold.[3] Following the May 2007 election, contested for the first time using a system of proportional representation, the Liberal Democrats and Scottish National Party (SNP) formed a coalition to run the council, holding 27 of the 43 seats (following an SNP by election gain from the Conservatives on 16 August 2007, the coalition held 28 of the 43 seats). Two Liberal Democrat councillors became independents during this period due to personal controversies, while the four strong Conservative group split in August 2010, with two councillors forming the Scottish Conservative Group and two others the Aberdeen Conservative Group.
After the May 2012 election, the control of the council shifted back to the Labour Party, supported in a coalition by three Conservative and three Independent councillors, giving the administration 23 seats.[4]
The Labour/Conservative/Independent coalition continued after the 2017 election, but with a change in the balance of power within the coalition. Labour were reduced to nine councillors (subsequently suspended from membership by the Scottish Labour Party for forming a coalition with the Conservatives), whilst the Conservatives had eleven councillors elected.[5] These Conservative and suspended "Aberdeen Labour" councillors were joined in coalition by three Independent councillors, one of who had left the Liberal Democrats just days after the council election.
In December 2019 a councillor elected as a Conservative became an Independent following his conviction for sexual assault.[6] This led to the ruling coalition becoming a minority administration comprising only 22 of the 45 councillors.
Between 2017 and 2021 the council had Co-Leaders Douglas Lumsden (Conservative) and Jenny Laing (“Aberdeen Labour”) as a result of the coalition agreement. Following Douglas Lumsden's election to the Scottish Parliament in May 2021 Jenny Laing became sole Leader of the council.[5]
Political composition (as at December 2021):
- Scottish National Party: 19 councillors
- Leader: Alex Nicoll
- Conservatives; 10 councillors
- Leader: Ryan Houghton
- So-called Aberdeen Labour: 9 councillors
- Leader: Jenny Laing
- Scottish Liberal Democrats: 3 councillors
- Leader: Ian Yuill
- Independent Alliance: 3 councillors
- Independent: 1 councillor
Following the council elections on 5th May 2022 the political composition of Aberdeen City Council became:
- Scottish National Party: 20
- Labour: 11
- Conservatives: 8
- Liberal Democrats: 4
- Independent: 2
After negotiations, the Scottish National Party and Liberal Democrats agreed to form a partnership to lead the Council for the next five years. At the Council’s statutory meeting on 18th May 2022 SNP councillor David Cameron was elected Lord Provost and Liberal Democrat Councillor Steve Delaney was elected Depute Provost. SNP Group Leader Alex Nicoll and Liberal Democrat Group Leader Ian Yuill became Co-Leaders of the Council.
Officers:
- Council Co-Leaders: Alex Nicoll and Ian Yuill
- Lord Provost of Aberdeen: David Cameron
- Chief Executive: Angela Scott
- Director of Resources: Stephen Whyte
- Chief Officer - Governance: Fraser Bell
Council Structure
Before May 2007, councillors represented 43 single-member wards election on a first-past-the-post basis.
On 3 May 2007, the single transferable vote system was used for the first time and multi-member wards were introduced, each ward electing three or four councillors. The Local Government Boundary Commission for Scotland completed its final recommendations for new wards for all the council areas of Scotland.
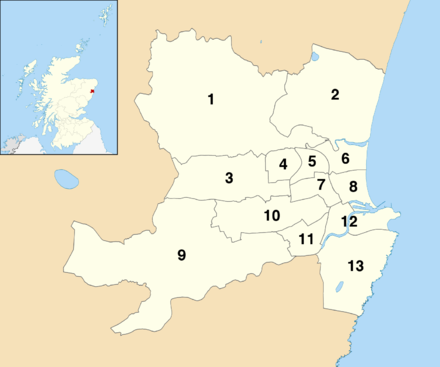
Aberdeen is divided into 13 multi-member wards, electing a total of 45 councillors. This system was introduced as a result of the Local Governance (Scotland) Act 2004, and is designed to produce a form of proportional representation.[7]
Current multi-member ward system
As of 4 May 2017, the current wards and representative numbers are:[8]
| Ward | Number of councillors |
|---|---|
| 1. Dyce/Bucksburn/Danestone | 4 members |
| 2. Bridge of Don | 4 members |
| 3. Kingswells/Sheddocksley/Summerhill | 3 members |
| 4. Northfield/Mastrick North | 3 members |
| 5. Hilton/Woodside/Stockethill | 3 members |
| 6. Tillydrone/Seaton/Old Aberdeen | 3 members |
| 7. Midstocket/Rosemount | 3 members |
| 8. George Street/Harbour | 4 members |
| 9. Lower Deeside | 3 members |
| 10. Hazlehead/Ashley/Queens Cross | 4 members |
| 11. Airyhall/Broomhill/Garthdee | 3 members |
| 12. Torry/Ferryhill | 4 members |
| 13. Kincorth/Nigg/Cove | 4 members |
Election results
2022
| Party | Seats | Gains | Losses | Net gain/loss | Seats % | Votes % | Votes | +/− | |
|---|---|---|---|---|---|---|---|---|---|
| SNP | 20 | 1 | 0 | 44.4 | 35.0 | 23,472 | |||
| Labour | 11 | 2 | 0 | 24.4 | 17.5 | 11,731 | |||
| Conservative | 8 | 0 | 3 | 17.8 | 21.6 | 14,493 | |||
| Liberal Democrats | 4 | 1 | 1 | 8.9 | 14.0 | 9,404 | |||
| Independent | 2 | 1 | 1 | 4.4 | 5.3 | 3,569 | |||
| Green | 0 | 0 | 0 | 0 | 5.1 | 3,414 | |||
| Alba | 0 | 0 | 0 | 0 | 0.7 | 464 | New | ||
| Scottish Family | 0 | 0 | 0 | 0 | 0.5 | 350 | New | ||
| Libertarian | 0 | 0 | 0 | 0 | 0.1 | 56 | |||
| Total | 45 | 66,953 | |||||||
2017
| Party | Seats | Gains | Losses | Net gain/loss | Seats % | Votes % | Votes | +/− | |
|---|---|---|---|---|---|---|---|---|---|
| SNP | 19 | - | - | +4 | 42.2% | 32.6% | 22,690 | +1.3% | |
| Conservative | 11 | - | - | +8 | 24.4% | 25.0% | 17,427 | +15.4% | |
| Labour | 9 | - | - | −8 | 17.8% | 16.9% | 11,784 | −12.8% | |
| Liberal Democrats | 4 | - | - | −1 | 8.9% | 15.4% | 10,753 | +0.3% | |
| Independent | 2 | - | - | −1 | 4.4% | 7.5% | 5,195 | −3.7% | |
| Green | 0 | - | - | - | 0 | 2.3% | 1,538 | −0.2% | |
| UKIP | 0 | - | - | - | 0 | 0.3% | 202 | +0.2% | |
| National Front | 0 | - | - | - | 0 | 39 | |||
| Libertarian | 0 | - | - | - | 0 | 31 | |||
| Solidarity | 0 | - | - | - | 0 | 28 | |||
| Total | 45 | 69,687 | |||||||
2012
| Party | Seats | Gains | Losses | Net gain/loss | Seats % | Votes % | Votes | +/− | |
|---|---|---|---|---|---|---|---|---|---|
| Labour | 17 | 7 | 0 | 7 | 39.5 | 29.7% | 16,264 | ||
| SNP | 15 | 4 | 1 | 3 | 34.9 | 31.3% | 17,131 | ||
| Liberal Democrats | 5 | 0 | 10 | −10 | 11.6 | 15.1% | 8,293 | ||
| Conservative | 3 | 0 | 2 | −2 | 7.0 | 9.7% | 5,285 | ||
| Independent | 3 | ||||||||
Note: The net gain/loss and percentage changes relate to the result of the previous Scottish local elections on 3 May 2007. This may differ from other published sources showing gain/loss relative to seats held at dissolution of Scotland's councils.
2007
| Party | Seats | Gains | Losses | Net gain/loss | Seats % | Votes % | Votes | +/− | |
|---|---|---|---|---|---|---|---|---|---|
| Liberal Democrats | 15 | N/A | N/A | −5 | 34.9 | 26.9 | 20,845 | ||
| SNP | 12 | N/A | N/A | +6 | 27.9 | 29.5 | 22,791 | ||
| Labour | 10 | N/A | N/A | −3 | 23.3 | 24.6 | 19,003 | ||
| Conservative | 5 | N/A | N/A | +2 | 11.6 | 14.1 | 10,889 | ||
| Independent | 1 | N/A | N/A | 0 | 2.3 | 2.7 | 2,090 | ||
| Green | 0 | N/A | N/A | 0 | 0.0 | 1.6 | 1,204 | ||
| Solidarity | 0 | N/A | N/A | 0 | 0.0 | 0.3 | 248 | ||
| Scottish Socialist | 0 | N/A | N/A | 0 | 0.0 | 0.3 | 218 | ||
| BNP | 0 | N/A | N/A | 0 | 0.0 | 0.1 | 81 | ||
References
- Scottish Statutory Instrument 2011 No. 443
- "Aberdeen Provost says Labour coalition row will be resolved". BBC News. 18 May 2017. Retrieved 21 May 2017.
- David, Scott (30 December 2002). "Labour is set to lose council strongholds in elections". The Scotsman. Archived from the original on 9 January 2006.
- "Labour-Conservative administration to run Aberdeen City Council". BBC News. 9 May 2012.
- "Labour councillors in Aberdeen suspended over Tory coalition". BBC News. 17 May 2017. Retrieved 21 May 2017.
- Daily Record, 14th December 2019
- "Scottish elections 2007". The Electoral Commission. Archived from the original on 27 January 2007. Retrieved 2007-02-08.
- "United Kingdom: Scotland | Council Areas and Electoral Wards". City Population. 30 June 2019. Retrieved 28 March 2021.
- "Local Election Results 3rd May 2007" (PDF). Local Election Archive Project. Retrieved 5 April 2011.
External links
Aberdeen | ||
|---|---|---|
| History |
|  |
| Politics |
| |
| Geography | ||
| Culture |
| |
| Transport |
| |
| Education |
| |
| Religion |
| |
| Sport |
| |
| Economy |
| |
| See also |
| |
Category | ||
| Aberdeen Corporation |
|
|---|---|
| Aberdeen City Council |
|
| Grampian Regional Council |
|
| Authority control |
|
|---|
Другой контент может иметь иную лицензию. Перед использованием материалов сайта WikiSort.org внимательно изучите правила лицензирования конкретных элементов наполнения сайта.
WikiSort.org - проект по пересортировке и дополнению контента Википедии