world.wikisort.org - Canada
Sainte-Marthe is a municipality located in the Vaudreuil-Soulanges Regional County Municipality of Quebec, Canada. The population as of the 2021 Canadian census was 1,014.
Sainte-Marthe | |
|---|---|
Municipality | |
 | |
 Location within Vaudreuil-Soulanges RCM | |
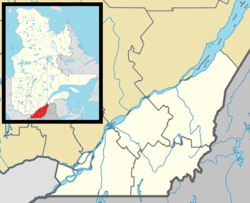 Ste-Marthe Location in southern Quebec | |
| Coordinates: 45°24′N 74°18′W[1] | |
| Country | Canada |
| Province | Quebec |
| Region | Montérégie |
| RCM | Vaudreuil-Soulanges |
| Constituted | 27 December 1980 |
| Government | |
| • Mayor | François Pleau |
| • Federal riding | Salaberry—Suroît |
| • Prov. riding | Soulanges |
| Area | |
| • Total | 79.92 km2 (30.86 sq mi) |
| • Land | 79.60 km2 (30.73 sq mi) |
| Population (2021)[4] | |
| • Total | 1,014 |
| • Density | 12.7/km2 (33/sq mi) |
| • Pop 2016-2021 | |
| • Dwellings | 448 |
| Time zone | UTC−5 (EST) |
| • Summer (DST) | UTC−4 (EDT) |
| Postal code(s) | J0P 1W0 |
| Area code(s) | 450 and 579 |
| Highways | |
| Website | www |
The local economy is based almost exclusively on agriculture.[1]
History
Settlement began in 1835 with the arrival of Irish immigrants. In 1846, the parish was founded and named after Martha, the sister of Lazarus, since the neighbouring parish was called Saint-Lazare.[1]
That same year, the Municipality of Sainte Marthe was created out of the Municipality of Rigaud, but abolished on September 1, 1847. In 1851, its post office opened.[1] On July 1, 1855, the municipality was reestablised, which became a parish municipality in 1857.[5]
In 1928, the village itself separated from the surrounding rural parish and became the Village Municipality of Sainte-Marthe.[6]
On December 27, 1980, the parish and village merged to form the Municipality of Sainte-Marthe.[1]
Demographics
| 2021 | 2016 | 2011 | |
|---|---|---|---|
| Population | 1,014 (-7.6% from 2016) | 1,097 (2.0% from 2011) | 1,075 (-0.5% from 2006) |
| Land area | 79.60 km2 (30.73 sq mi) | 79.73 km2 (30.78 sq mi) | 79.80 km2 (30.81 sq mi) |
| Population density | 12.7/km2 (33/sq mi) | 13.8/km2 (36/sq mi) | 13.5/km2 (35/sq mi) |
| Median age | 48.4 (M: 48.4, F: 48.8) | 46.7 (M: 47.1, F: 46.3) | 44.5 (M: 44.7, F: 44.3) |
| Total private dwellings | 448 | 451 | 430 |
| Median household income | $68,928 | $56,221 |
|
| ||||||||||||||||||||||||||||||||||||
| Population amounts prior to 1980 are total of Sainte-Marthe Village and Sainte-Marthe Parish. Source: Statistics Canada[12] | |||||||||||||||||||||||||||||||||||||
Language
| Canada Census Mother Tongue - Sainte-Marthe, Quebec[12] | ||||||||||||||||||
|---|---|---|---|---|---|---|---|---|---|---|---|---|---|---|---|---|---|---|
| Census | Total | French |
English |
French & English |
Other | |||||||||||||
| Year | Responses | Count | Trend | Pop % | Count | Trend | Pop % | Count | Trend | Pop % | Count | Trend | Pop % | |||||
2011 |
1,075 |
875 | 81.40% | 150 | 13.95% | 15 | 1.40% | 35 | 3.25% | |||||||||
2006 |
1,075 |
890 | 82.79% | 145 | 13.49% | 25 | 2.32% | 15 | 1.40% | |||||||||
2001 |
1,090 |
945 | 86.70% | 120 | 11.01% | 10 | 0.92% | 15 | 1.38% | |||||||||
1996 |
1,095 |
860 | n/a | 78.54% | 135 | n/a | 12.33% | 10 | n/a | 0.91% | 90 | n/a | 8.22% | |||||
Local government

List of former mayors (since formation of current municipality):[13]
- Léon-Henri Bourbonnais (1980–1984)
- Joseph Antoine Wilfrid Germain Roy (1984–1994)
- Joseph Aimé Jean Guy Durocher (1994–2005)
- Aline Guillotte (2005–2017)
- François Pleau (2017–present)
Education
Commission Scolaire des Trois-Lacs operates Francophone schools.[14]
- École Sainte-Marthe
Lester B. Pearson School Board operates Anglophone schools.[15]
- Soulanges Elementary School in Saint-Télesphore or Evergreen Elementary and Forest Hill Elementary (Junior Campus and Senior campus) in Saint-Lazare
See also
- List of municipalities in Quebec
References
- "Reference number 98667 in Banque de noms de lieux du Québec". toponymie.gouv.qc.ca (in French). Commission de toponymie du Québec.
- "Répertoire des municipalités: Sainte-Marthe". www.mamh.gouv.qc.ca (in French). Ministère des Affaires municipales et de l'Habitation. Retrieved 12 May 2022.
- Parliament of Canada Federal Riding History: VAUDREUIL--SOULANGES (Quebec)
- "Sainte-Marthe, Municipalité (MÉ) Census Profile, 2021 Census of Population". www12.statcan.gc.ca. Government of Canada - Statistics Canada. Retrieved 12 May 2022.
- "Répertoire des entités géopolitiques: Sainte-Marthe (paroisse) 11.25.1846 - 1.9.1847 ? 1.7.1855 - 12.27.1980". www.mairesduquebec.com. Institut généalogique Drouin. Retrieved 11 January 2022.
- "Répertoire des entités géopolitiques: Sainte-Marthe (village) 13.3.1928 - 27.12.1980". www.mairesduquebec.com. Institut généalogique Drouin. Retrieved 11 January 2022.
- "2021 Community Profiles". 2021 Canadian Census. Statistics Canada. 4 February 2022. Retrieved 12 May 2022.
- "2016 Community Profiles". 2016 Canadian Census. Statistics Canada. 12 August 2021. Retrieved 11 January 2022.
- "2011 Community Profiles". 2011 Canadian Census. Statistics Canada. 21 March 2019. Retrieved 20 February 2014.
- "2006 Community Profiles". 2006 Canadian Census. Statistics Canada. 20 August 2019.
- "2001 Community Profiles". 2001 Canadian Census. Statistics Canada. 18 July 2021.
- 1996, 2001, 2006, 2011 census
- "Répertoire des entités géopolitiques: Sainte-Marthe (municipalité) 27.12.1980 - ..." www.mairesduquebec.com. Institut généalogique Drouin. Retrieved 11 January 2022.
- "Les écoles et les centres". Commission Scolaire des Trois-Lacs. Retrieved 18 January 2013.
- "School Board Map." Lester B. Pearson School Board. Retrieved on 28 September 2017.
External links
 Media related to Sainte-Marthe, Quebec at Wikimedia Commons
Places adjacent to Sainte-Marthe, Quebec | |
|---|---|
| Cities & towns | |
|---|---|
| Municipalities |
|
| Villages | |
| |
Authority control | |
|---|---|
| General | |
| National libraries | |
На других языках
- [en] Sainte-Marthe, Quebec
[es] Sainte-Marthe (Quebec)
Sainte-Marthe, también conocido como Sainte-Marthe de Rigaud y Sainte-Marthe de Vaudreuil,,[2] es un municipio de la provincia de Quebec en Canadá. Es uno de los municipios que conforman el municipio regional de condado (MRC) de Vaudreuil-Soulanges en la región del Valle del Alto San Lorenzo en Montérégie.[1][3]Другой контент может иметь иную лицензию. Перед использованием материалов сайта WikiSort.org внимательно изучите правила лицензирования конкретных элементов наполнения сайта.
WikiSort.org - проект по пересортировке и дополнению контента Википедии