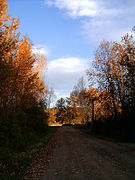
 Beautiful Autumn Colors
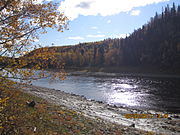 Petitot River just before it meets the Liard River
 Roman Catholic Church
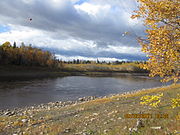 Petiot River looking toward the Liard River
 The Sleeping Giant in Fall
world.wikisort.org - Canada
Fort Liard /liˈɑːrd/ (Slavey language: Echaot'l Koe[pronunciation?] "people from the land of the giants" or Acho Dene Kue) is a hamlet in the Dehcho Region of the Northwest Territories, Canada. It is located 37 km (23 mi) north of the British Columbia border. It became accessible by road in 1984 with the completion of the Liard Highway (Northwest Territories Highway 7 and British Columbia Highway 77).
Fort Liard
Echaot'l Koe or Acho Dene Kue | |
|---|---|
Hamlet | |
 The Sleeping Giant - the view from the top of the hill heading into the Hamlet | |
 Fort Liard  Fort Liard | |
| Coordinates: 60°14′21″N 123°28′31″W[1] | |
| Country | Canada |
| Territory | Northwest Territories |
| Region | Dehcho Region |
| Constituency | Nahendeh |
| Census division | Region 4 |
| Incorporated (hamlet) | 1 April 1987 |
| Government | |
| • Mayor | Genevieve McLeod |
| • Senior Administrative Officer | John McKee |
| • MLA | Shane Thompson |
| Area | |
| • Land | 67.61 km2 (26.10 sq mi) |
| Elevation | 216 m (709 ft) |
| Population (2021)[3] | |
| • Total | 468 |
| • Density | 6.9/km2 (18/sq mi) |
| Time zone | UTC−07:00 (MST) |
| • Summer (DST) | UTC−06:00 (MDT) |
| Canadian Postal code | X0G 0A0 |
| Area code | 867 |
| Telephone exchange | 770 |
| - Living cost (2018) | 132.5A |
| - Food price index (2019) | 145.4B |
| Website | www.fortliard.com |
| Sources: Department of Municipal and Community Affairs,[4] Prince of Wales Northern Heritage Centre,[5] Canada Flight Supplement[6] ^A 2018 figure based on Edmonton = 100[7] ^B 2019 figure based on Yellowknife = 100[7] | |
The Hamlet of Fort Liard is served by two general merchandise stores: The General Store and The North West Company store. The K-12 community school, "Echo Dene School", has a student population of about 150. It also has a community health centre with four nurses, a Royal Canadian Mounted Police detachment with four members, and a recreation centre, including a swimming pool, skating rink, youth centre and multi-court.[8] There is a fuel centre that sells gasoline, diesel fuel, propane, emergency survival kits and convenience items. There is also a traditional craft store which sells locally made craft items.
Demographics
In the 2021 Census of Population conducted by Statistics Canada, Fort Liard had a population of 468 living in 170 of its 209 total private dwellings, a change of -6.4% from its 2016 population of 500. With a land area of 67.61 km2 (26.10 sq mi), it had a population density of 6.9/km2 (17.9/sq mi) in 2021.[3]
In the 2016 Census the majority of the population, 445 people out of a total of 500, were Indigenous, either First Nations or Métis.[9]
| Year | Pop. | ±% |
|---|---|---|
| 1976 | 299 | — |
| 1981 | 405 | +35.5% |
| 1986 | 395 | −2.5% |
| 1991 | 485 | +22.8% |
| 1996 | 512 | +5.6% |
| 2001 | 530 | +3.5% |
| 2006 | 583 | +10.0% |
| 2011 | 536 | −8.1% |
| 2016 | 500 | −6.7% |
| 2021 | 468 | −6.4% |
| Source: Statistics Canada [3][9][10][11][12][13][14][15][16] | ||
|
| ||||||||||||||||||||||||||||||||||||||||||||||||||||||||||||||||||||||||||||||
| Sources: NWT Bureau of Statistics (2008 - 2019),[7] NWT Bureau of Statistics (2001 - 2017)[17] | |||||||||||||||||||||||||||||||||||||||||||||||||||||||||||||||||||||||||||||||
First Nations
The Dene of the community are represented by the Acho Dene Koe Band and the Métis by Fort Liard Metis Local 67. Both groups belong to the Deh Cho First Nations Tribal Council.[18][19]
Gallery


Climate
Fort Liard has a borderline subarctic climate (Köppen climate classification Dfc), just short of a humid continental climate (Köppen climate classification Dfb), characterized by extreme variation of temperatures between seasons. Temperatures can be warm in the summer, and cold in the winter.
The highest temperature ever recorded in Fort Liard was 35.2 °C (95.4 °F) on 13 July 2014 and 27 June 2021.[20][21] [22] The coldest temperature ever recorded was −46.7 °C (−52.1 °F) on 15 January 1974.[23]
| Climate data for Fort Liard (Fort Liard Airport} Climate ID: 2201575; coordinates 60°14′06″N 123°28′01″W; elevation: 215.8 m (708 ft); 1981–2010 normals, extremes 1973–present | |||||||||||||
|---|---|---|---|---|---|---|---|---|---|---|---|---|---|
| Month | Jan | Feb | Mar | Apr | May | Jun | Jul | Aug | Sep | Oct | Nov | Dec | Year |
| Record high humidex | 7.3 | 14.2 | 18.1 | 23.2 | 29.7 | 37.8 | 38.8 | 37.5 | 30.8 | 24.5 | 9.4 | 14.6 | 38.8 |
| Record high °C (°F) | 14.8 (58.6) |
15.0 (59.0) |
19.9 (67.8) |
25.0 (77.0) |
32.6 (90.7) |
35.2 (95.4) |
35.2 (95.4) |
34.9 (94.8) |
30.5 (86.9) |
26.5 (79.7) |
13.5 (56.3) |
15.3 (59.5) |
35.2 (95.4) |
| Average high °C (°F) | −17.9 (−0.2) |
−11.8 (10.8) |
−3.0 (26.6) |
8.6 (47.5) |
16.5 (61.7) |
22.2 (72.0) |
23.3 (73.9) |
21.4 (70.5) |
15.2 (59.4) |
3.9 (39.0) |
−10.6 (12.9) |
−15.4 (4.3) |
4.4 (39.9) |
| Daily mean °C (°F) | −21.8 (−7.2) |
−17.1 (1.2) |
−9.5 (14.9) |
2.0 (35.6) |
9.8 (49.6) |
15.6 (60.1) |
17.3 (63.1) |
15.3 (59.5) |
9.6 (49.3) |
0.0 (32.0) |
−14.0 (6.8) |
−19.1 (−2.4) |
−1.0 (30.2) |
| Average low °C (°F) | −25.5 (−13.9) |
−22.3 (−8.1) |
−15.9 (3.4) |
−4.6 (23.7) |
3.0 (37.4) |
8.9 (48.0) |
11.3 (52.3) |
9.1 (48.4) |
3.9 (39.0) |
−3.9 (25.0) |
−17.4 (0.7) |
−22.7 (−8.9) |
−6.4 (20.5) |
| Record low °C (°F) | −46.7 (−52.1) |
−44.0 (−47.2) |
−39.8 (−39.6) |
−31.6 (−24.9) |
−14.5 (5.9) |
−1.6 (29.1) |
−0.1 (31.8) |
−1.7 (28.9) |
−11.7 (10.9) |
−30.0 (−22.0) |
−43.0 (−45.4) |
−45.0 (−49.0) |
−46.7 (−52.1) |
| Record low wind chill | −63 | −52 | −48 | −36 | −18 | 0 | 0 | −3 | −17 | −33 | −53 | −55 | −63 |
| Average precipitation mm (inches) | 24.9 (0.98) |
19.7 (0.78) |
16.2 (0.64) |
23.0 (0.91) |
41.4 (1.63) |
59.5 (2.34) |
83.4 (3.28) |
55.3 (2.18) |
44.0 (1.73) |
34.7 (1.37) |
28.4 (1.12) |
21.2 (0.83) |
451.7 (17.78) |
| Average rainfall mm (inches) | 0.0 (0.0) |
0.0 (0.0) |
0.0 (0.0) |
5.5 (0.22) |
37.7 (1.48) |
59.5 (2.34) |
83.4 (3.28) |
55.0 (2.17) |
41.4 (1.63) |
11.6 (0.46) |
0.1 (0.00) |
0.0 (0.0) |
294.1 (11.58) |
| Average snowfall cm (inches) | 26.3 (10.4) |
21.3 (8.4) |
16.8 (6.6) |
17.9 (7.0) |
3.8 (1.5) |
0.0 (0.0) |
0.0 (0.0) |
0.2 (0.1) |
2.7 (1.1) |
23.5 (9.3) |
30.3 (11.9) |
22.5 (8.9) |
165.4 (65.1) |
| Average precipitation days (≥ 0.2 mm) | 8.0 | 7.0 | 6.4 | 5.2 | 9.6 | 9.6 | 12.0 | 10.7 | 10.1 | 8.8 | 9.6 | 6.7 | 103.7 |
| Average rainy days (≥ 0.2 mm) | 0.0 | 0.0 | 0.0 | 2.0 | 8.6 | 9.6 | 12.0 | 10.7 | 9.6 | 3.7 | 0.1 | 0.0 | 56.4 |
| Average snowy days (≥ 0.2 cm) | 8.1 | 7.0 | 6.5 | 3.7 | 1.4 | 0.0 | 0.0 | 0.1 | 0.7 | 6.0 | 9.6 | 6.7 | 49.7 |
| Source: Environment and Climate Change Canada[23][24][25][26][27][28][20][29][30][31][22] | |||||||||||||
See also
- List of municipalities in the Northwest Territories
- Fort Liard Airport
References
- "Fort Liard". Geographical Names Data Base. Natural Resources Canada.
- "Fort Liard". Geographical Names Data Base. Natural Resources Canada.
- "Population and dwelling counts: Canada, provinces and territories, and census subdivisions (municipalities), Northwest Territories". Statistics Canada. 9 February 2022. Retrieved 18 February 2022.
- "NWT Communities - Fort Liard". Government of the Northwest Territories: Department of Municipal and Community Affairs. Retrieved 13 January 2014.
- "Northwest Territories Official Community Names and Pronunciation Guide". Prince of Wales Northern Heritage Centre. Yellowknife: Education, Culture and Employment, Government of the Northwest Territories. Archived from the original on 13 January 2016. Retrieved 13 January 2016.
- Canada Flight Supplement. Effective 0901Z 16 July 2020 to 0901Z 10 September 2020.
- "Fort Liard - Statistical Profile (2008-2019)" (PDF). NWT Bureau of Statistics.
- Infrastructure
- "Census Profile, 2016 Census Fort Liard, Hamlet [Census subdivision], Northwest Territories and Region 4, Region [Census division], Northwest Territories". Statistics Canada. 8 February 2017. Retrieved 1 February 2022.
- "1981 Census of Canada: Census subdivisions in decreasing population order" (PDF). Statistics Canada. May 1992. Retrieved 1 February 2021.
- "1986 Census: Population - Census Divisions and Census Subdivisions" (PDF). Statistics Canada. September 1987. Retrieved 1 February 2022.
- "91 Census: Census Divisions and Census Subdivisions - Population and Dwelling Counts" (PDF). Statistics Canada. April 1992. Retrieved 1 February 2022.
- "96 Census: A National Overview - Population and Dwelling Counts" (PDF). Statistics Canada. April 1997. Retrieved 1 February 2022.
- "Population and Dwelling Counts, for Canada, Provinces and Territories, and Census Subdivisions (Municipalities), 2001 and 1996 Censuses - 100% Data (Northwest Territories)". Statistics Canada. 15 August 2012. Retrieved 1 February 2022.
- "Population and dwelling counts, for Canada, provinces and territories, and census subdivisions (municipalities), 2006 and 2001 censuses - 100% data (Northwest Territories)". Statistics Canada. 20 August 2021. Retrieved 1 February 2022.
- "Population and dwelling counts, for Canada, provinces and territories, and census subdivisions (municipalities), 2011 and 2006 censuses (Northwest Territories)". Statistics Canada. 25 July 2021. Retrieved 1 February 2022.
- Population Estimates By Community from the GNWT
- Acho Dene Koe Band Archived 2 March 2008 at the Wayback Machine
- Fort Liard Métis Archived 2 March 2008 at the Wayback Machine
- "Daily Data Report for July 2014". Canadian Climate Data. Environment and Climate Change Canada. Retrieved 14 May 2016.
- "Daily Data Report for June 2021". Canadian Climate Data. Environment and Climate Change Canada. Retrieved 9 July 2021.
- "Environment Canada FTP". Environment and Climate Change Canada. Government of Canada. Archived from the original on 13 March 2020. Retrieved 3 October 2016.
- "Fort Liard A". Canadian Climate Normals 1981–2010. Environment and Climate Change Canada. Retrieved 13 May 2016.
- "Daily Data Report for August 1999". Canadian Climate Data. Environment and Climate Change Canada. Retrieved 28 September 2016.
- "Daily Data Report for October 2003". Canadian Climate Data. Environment and Climate Change Canada. Retrieved 28 September 2016.
- "Daily Data Report for June 2011". Canadian Climate Data. Environment and Climate Change Canada. Retrieved 28 September 2016.
- "Daily Data Report for July 2013". Canadian Climate Data. Environment and Climate Change Canada. Retrieved 28 September 2016.
- "Daily Data Report for January 2014". Canadian Climate Data. Environment and Climate Change Canada. Retrieved 28 September 2016.
- "Daily Data Report for March 2016". Canadian Climate Data. Environment and Climate Change Canada. Retrieved 28 September 2016.
- "Daily Data Report for November 2015". Canadian Climate Data. Environment and Climate Change Canada. Retrieved 28 September 2016.
- "Daily Data Report for May 2016". Canadian Climate Data. Environment and Climate Change Canada. Retrieved 13 May 2016.
External links
| Dehcho Region | |
|---|---|
| Inuvik Region | |
| North Slave Region | |
| Sahtu Region |
|
| South Slave Region |
|
| |
Authority control | |
|---|---|
| General |
|
| National libraries | |
На других языках
[de] Fort Liard
Fort Liard (Slavey: Echaot'l Koe oder Echaot’įe Kų́ę́ – „Ort/Heimat der Menschen aus dem Land der Riesen“) ist ein Weiler in der Dehcho Region in den Nordwest-Territorien, Kanada. Er liegt 37 km nördlich der Grenze zu British Columbia an der Mündung des Petitot River in den Liard River. Seit 1984 ist der Weiler an den Liard Highway (Northwest Territories Highway 7 und British Columbia Highway 77) angebunden. 583 Einwohner lebten nach dem Zensus von 2006 in Fort Liard. Die Mehrheit von ihnen gehört den First Nations an.[2] Die Dene-Bevölkerung wird durch den Acho Dene Koe Band und die Métis durch Fort Liard Metis Local 67 vertreten. Beide Gruppen gehören zu den Dehcho First Nations.[3][4]- [en] Fort Liard
[ru] Форт-Лиард
Форт-Лиард (англ. Fort Liard) — деревня в Северо-Западных территориях, Канада.Текст в блоке "Читать" взят с сайта "Википедия" и доступен по лицензии Creative Commons Attribution-ShareAlike; в отдельных случаях могут действовать дополнительные условия.
Другой контент может иметь иную лицензию. Перед использованием материалов сайта WikiSort.org внимательно изучите правила лицензирования конкретных элементов наполнения сайта.
Другой контент может иметь иную лицензию. Перед использованием материалов сайта WikiSort.org внимательно изучите правила лицензирования конкретных элементов наполнения сайта.
2019-2026
WikiSort.org - проект по пересортировке и дополнению контента Википедии
WikiSort.org - проект по пересортировке и дополнению контента Википедии