world.wikisort.org - USA
Sullivan County is a county located in the U.S. state of Tennessee on its northeast border. As of the 2020 census, the population was 158,163.[2] Its county seat is Blountville.[3]
Sullivan County | |
|---|---|
U.S. county | |
 Sullivan County Courthouse in Blountville | |
 Location within the U.S. state of Tennessee | |
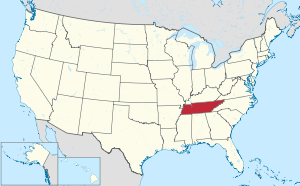 Tennessee's location within the U.S. | |
| Coordinates: 36°31′N 82°18′W | |
| Country | |
| State | |
| Founded | 1779 |
| Named for | General John Sullivan[1] |
| Seat | Blountville |
| Largest city | Kingsport |
| Government | |
| • County Mayor | Richard Venable (R) |
| Area | |
| • Total | 430 sq mi (1,100 km2) |
| • Land | 413 sq mi (1,070 km2) |
| • Water | 16 sq mi (40 km2) 3.8%% |
| Population (2020) | |
| • Total | 158,163 |
| • Density | 379/sq mi (146/km2) |
| Time zone | UTC−5 (Eastern) |
| • Summer (DST) | UTC−4 (EDT) |
| Congressional district | 1st |
| Website | sullivancountytn |
Sullivan County is part of the Kingsport–Johnson City–Bristol, TN-VA Metropolitan Statistical Area, which is a component of the Kingsport–Johnson City–Bristol, TN-VA Combined Statistical Area, commonly known as the "Tri-Cities" region.
Sullivan is Tennessee's second-oldest county;[4] it was established in 1779 when the area was still part of North Carolina. From 1784 to 1788, it was part of the extra-legal State of Franklin.[5]
History
Sullivan County was created in 1779 from a portion of Washington County, and named for John Sullivan, a Patriot general in the Revolutionary War.[6] Long Island of the Holston in Kingsport was long an important center for the Cherokee, who occupied much of this territory. Later in 1761 the British colonists built Fort Robinson on Long Island, following the fall of Fort Loudoun further to the south. This attracted other settlers, and the Sullivan area became one of the earliest areas of Tennessee to be settled by European Americans.[1]
As political tensions rose prior to the American Civil War, Sullivan County was one of the few East Tennessee counties to support secession. It became known as the Little Confederacy. In Tennessee's June 1861 referendum, the county voted 1,586 to 627 in favor of secession.[7]
Geography
According to the U.S. Census Bureau, the county has a total area of 430 square miles (1,100 km2), of which 413 square miles (1,070 km2) is land and 16 square miles (41 km2) (3.8%) is water.[8] The western portion of the county lies within the Ridge-and-Valley Appalachians, which are characterized by long, narrow ridges roughly oriented northeast-to-southwest. The northeastern end of Bays Mountain, part of the Ridge-and-Valley range, rises southwest of Kingsport. The eastern portion of the county lies within the Blue Ridge Mountains.[9] Holston Mountain, which at 4,284 feet (1,306 m) is the highest point in Sullivan, straddles the county's eastern boundary with Johnson County.
In Kingsport, the South Fork Holston River and the North Fork Holston River join to form the Holston River, one of the tributaries of the Tennessee River. The Watauga River, a tributary of the South Fork Holston, forms part of Sullivan's boundary with Washington County to the south. The North Fork Holston forms part of Sullivan's boundary with Hawkins County to the west. Fort Patrick Henry Dam and Boone Dam both create large artificial lakes along the South Fork Holston southeast of Kingsport.
Blountville, Sullivan's county seat, is Tennessee's only unincorporated county seat.
Morrell Cave
Morrell Cave (also known as Worleys Cave) is a Tennessee State Natural Area. The cave has a surveyed length of 4.4 miles (7.1 km), making it the second-longest cave in East Tennessee and the 177th longest cave in the United States.[10][11] Morrell Cave is located on the south side of the Holston River, 2.5 miles (4.0 km) east of Bluff City.
During the Civil War, the cave was a major source of saltpeter, the main ingredient of gunpowder. Significant evidence of this mining activity remains in the cave, including evidence of large amounts of saltpeter-bearing dirt having been removed, pick marks in the dirt, and an elaborate system of trails used by the miners. Cave historian Marion O. Smith has determined that two companies of the Confederate Nitre and Mining Bureau, District No. 7, were active in Sullivan County.[12]
Adjacent counties and independent city
- Scott County, Virginia (north)
- Washington County, Virginia (northeast)
- Bristol, Virginia (northeast)
- Johnson County (east)
- Carter County (southeast)
- Washington County (south)
- Hawkins County (west)
National protected areas
- Appalachian Trail (part)
- Cherokee National Forest (part)
State protected areas
- Morrell's Cave State Natural Area
- Rocky Mount State Historic Site
- Warriors' Path State Park
Other protected areas
- Bays Mountain Park (part)
Major highways
 I-26
I-26 I-81
I-81 US 11E
 US 11W
 US 19
US 19 US 19E
 US 19W
 US 23
US 23 US 421
 SR 1
SR 1 SR 34
SR 34 SR 36
SR 36 SR 44
SR 44 SR 75
SR 75 SR 93
SR 93 SR 126
 SR 346
 SR 347
 SR 357
 SR 358
 SR 390
 SR 394
 SR 435
Demographics
| Historical population | |||
|---|---|---|---|
| Census | Pop. | %± | |
| 1800 | 10,218 | — | |
| 1810 | 6,847 | −33.0% | |
| 1820 | 7,015 | 2.5% | |
| 1830 | 10,073 | 43.6% | |
| 1840 | 10,736 | 6.6% | |
| 1850 | 11,742 | 9.4% | |
| 1860 | 13,552 | 15.4% | |
| 1870 | 13,136 | −3.1% | |
| 1880 | 18,321 | 39.5% | |
| 1890 | 20,879 | 14.0% | |
| 1900 | 24,935 | 19.4% | |
| 1910 | 28,120 | 12.8% | |
| 1920 | 36,259 | 28.9% | |
| 1930 | 51,087 | 40.9% | |
| 1940 | 69,085 | 35.2% | |
| 1950 | 95,063 | 37.6% | |
| 1960 | 114,139 | 20.1% | |
| 1970 | 127,329 | 11.6% | |
| 1980 | 143,968 | 13.1% | |
| 1990 | 143,596 | −0.3% | |
| 2000 | 153,048 | 6.6% | |
| 2010 | 156,823 | 2.5% | |
| 2020 | 158,163 | 0.9% | |
| U.S. Decennial Census[13] 1790-1960[14] 1900-1990[15] 1990-2000[16] 2010-2019[2] | |||
![Age pyramid Sullivan County[17]](http://upload.wikimedia.org/wikipedia/commons/thumb/0/04/USA_Sullivan_County%2C_Tennessee.csv_age_pyramid.svg/150px-USA_Sullivan_County%2C_Tennessee.csv_age_pyramid.svg.png)
2020 census
| Race | Number | Percentage |
|---|---|---|
| White (non-Hispanic) | 143,354 | 90.64% |
| Black or African American (non-Hispanic) | 3,197 | 2.02% |
| Native American | 350 | 0.22% |
| Asian | 1,270 | 0.8% |
| Pacific Islander | 36 | 0.02% |
| Other/Mixed | 6,408 | 4.05% |
| Hispanic or Latino | 3,548 | 2.24% |
As of the 2020 United States census, there were 158,163 people, 68,560 households, and 44,284 families residing in the county.
2010 census
As of the 2010 United States Census, there were 156,281 people living in the county. 95.5% were White, 0.6% Black or African American, 0.4% Asian, 0.2% Native American, 2.2% of some other race and 1.0% of two or more races. 4.8% were Hispanic or Latino (of any race).
2000 census
As of the census[19] of 2000, there were 153,048 people, 63,556 households, and 44,806 families living in the county. The population density was 371 people per square mile (143/km2). There were 69,052 housing units at an average density of 167 per square mile (65/km2). The racial makeup of the county was 96.55% White, 1.89% Black or African American, 0.22% Native American, 0.43% Asian, 0.01% Pacific Islander, 0.21% from other races, and 0.69% from two or more races. 0.71% of the population were Hispanic or Latino of any race.
There were 63,556 households, out of which 28.40% had children under the age of 18 living with them, 57.10% were married couples living together, 10.20% had a female householder with no husband present, and 29.50% were non-families according to the United States Census Bureau. Of 63,556 households, 1,915 are unmarried partner households: 1,702 heterosexual, 97 same-sex male, 116 same-sex female. 26.40% of all households were made up of individuals, and 11.10% had someone living alone who was 65 years of age or older. The average household size was 2.36 and the average family size was 2.84.
In the county, the population was spread out, with 21.80% under the age of 18, 7.30% from 18 to 24, 28.40% from 25 to 44, 26.50% from 45 to 64, and 15.90% who were 65 years of age or older. The median age was 40 years. For every 100 females, there were 93.30 males. For every 100 females age 18 and over, there were 90.20 males.
The median income for a household in the county was $33,529, and the median income for a family was $41,025. Males had a median income of $31,204 versus $21,653 for females. The per capita income for the county was $19,202. About 9.70% of families and 12.90% of the population were below the poverty line, including 17.10% of those under age 18 and 11.90% of those age 65 or over.
Government
Sullivan County, like most of rural Tennessee, is heavily Republican, but, unlike most of East Tennessee, has not voted consistently Republican since the Civil War. Being one of only six counties in East Tennessee and the only county in Northeast Tennessee to support the Confederacy, Sullivan County voted mostly consistently Democratic between the end of the Civil War and the mid-20th century, the only county in East Tennessee to do so. The last Democratic presidential candidate to carry Sullivan County was southerner Jimmy Carter in 1976.
Richard Venable is the county mayor. The county commission has 24 members.[20] Before 2010, commissioners were elected on a nonpartisan basis, but Sullivan County's commission election became a partisan election in 2010 after the county Republican Party decided to conduct a primary election for commission seats.[21] The county elections also cover Circuit Court Judges, Chancellor, Criminal Court Judge, District Attorney General, Public Defender, County Trustee, General Session Judge, Sherriff, Circuit Court Clerk, County Clerk, Register of Deeds, Commissioner of Highways, County Attorney, and School Board.
| Year | Republican | Democratic | Third party | |||
|---|---|---|---|---|---|---|
| No. | % | No. | % | No. | % | |
| 2020 | 55,860 | 75.12% | 17,272 | 23.23% | 1,225 | 1.65% |
| 2016 | 46,979 | 75.43% | 12,578 | 20.20% | 2,721 | 4.37% |
| 2012 | 43,562 | 72.74% | 15,321 | 25.58% | 1,004 | 1.68% |
| 2008 | 44,808 | 70.02% | 18,354 | 28.68% | 835 | 1.30% |
| 2004 | 42,555 | 67.94% | 19,637 | 31.35% | 447 | 0.71% |
| 2000 | 33,482 | 60.08% | 21,354 | 38.32% | 891 | 1.60% |
| 1996 | 29,296 | 54.42% | 20,571 | 38.21% | 3,970 | 7.37% |
| 1992 | 28,801 | 50.55% | 20,935 | 36.74% | 7,244 | 12.71% |
| 1988 | 32,996 | 64.73% | 17,396 | 34.13% | 585 | 1.15% |
| 1984 | 36,516 | 67.83% | 16,925 | 31.44% | 394 | 0.73% |
| 1980 | 25,963 | 51.44% | 22,341 | 44.27% | 2,166 | 4.29% |
| 1976 | 22,087 | 47.23% | 23,353 | 49.94% | 1,322 | 2.83% |
| 1972 | 27,593 | 71.64% | 10,007 | 25.98% | 917 | 2.38% |
| 1968 | 20,251 | 50.60% | 9,783 | 24.44% | 9,991 | 24.96% |
| 1964 | 17,703 | 47.59% | 19,496 | 52.41% | 0 | 0.00% |
| 1960 | 22,354 | 59.46% | 14,731 | 39.18% | 513 | 1.36% |
| 1956 | 18,903 | 56.42% | 14,106 | 42.10% | 497 | 1.48% |
| 1952 | 15,596 | 56.58% | 11,849 | 42.99% | 118 | 0.43% |
| 1948 | 6,984 | 46.19% | 7,626 | 50.44% | 510 | 3.37% |
| 1944 | 5,223 | 45.24% | 6,290 | 54.49% | 31 | 0.27% |
| 1940 | 4,153 | 36.36% | 7,234 | 63.34% | 34 | 0.30% |
| 1936 | 3,492 | 35.65% | 6,269 | 64.00% | 34 | 0.35% |
| 1932 | 2,999 | 35.52% | 5,322 | 63.04% | 121 | 1.43% |
| 1928 | 4,149 | 56.33% | 3,216 | 43.67% | 0 | 0.00% |
| 1924 | 2,247 | 39.95% | 3,313 | 58.90% | 65 | 1.16% |
| 1920 | 3,593 | 45.37% | 4,327 | 54.63% | 0 | 0.00% |
| 1916 | 1,776 | 40.51% | 2,601 | 59.33% | 7 | 0.16% |
| 1912 | 538 | 12.72% | 2,413 | 57.07% | 1,277 | 30.20% |
| 1908 | 1,836 | 43.09% | 2,393 | 56.16% | 32 | 0.75% |
| 1904 | 1,506 | 41.06% | 2,116 | 57.69% | 46 | 1.25% |
| 1900 | 1,739 | 41.25% | 2,421 | 57.42% | 56 | 1.33% |
| 1896 | 1,914 | 42.70% | 2,512 | 56.05% | 56 | 1.25% |
| 1892 | 1,304 | 33.26% | 2,281 | 58.17% | 336 | 8.57% |
| 1888 | 1,513 | 39.36% | 2,255 | 58.66% | 76 | 1.98% |
| 1884 | 1,298 | 36.98% | 2,176 | 61.99% | 36 | 1.03% |
| 1880 | 1,207 | 34.77% | 2,264 | 65.23% | 0 | 0.00% |
Current composition of the Sullivan County Commission
| District | Member | Location |
|---|---|---|
| District 1 | Randy C. Morrell | Bristol, TN |
| District 2 | David Akard | Bristol, TN |
| Mark Hutton | Bristol, TN | |
| Mark Vance | Bristol, TN | |
| District 3 | Andrew Cross | Bristol, TN |
| District 4 | Michael Cole | Blountville, TN |
| Joyce Crosswhite | Blountville, TN | |
| Tony Leonard | Bristol, TN | |
| District 5 | Hershel Glover | Bluff City, TN |
| Dwight Kings | Piney Flats, TN | |
| District 6 | Judy Blalock | Kingsport, TN |
| Todd Broughton | Kingsport, TN | |
| Terry Harkleroad | Kingsport, TN | |
| District 7 | Sam Jones | Kingsport, TN |
| Angie Stanley | Kingsport, TN | |
| District 8 | Darlene Calton | Kingsport, TN |
| Alicia Starnes | Kingsport, TN | |
| District 9 | Collette George | Kingsport, TN |
| Doug Woods | Kingsport, TN | |
| District 10 | Larry Crawford | Kingsport, TN |
| Gary Stidham | Kingsport, TN | |
| District 11 | John Gardner | Kingsport, TN |
| Hunter Locke | Kingsport, TN | |
| Archie Pierce | Kingsport, TN |
Law enforcement
The Sullivan County Sheriffs Office has a staff of 260 deputies, corrections officers, and support personnel. The department also staffs a 24-7 9-1-1 dispatch center that provides dispatching for the sheriff's office, Bluff City Police Department, Sullivan County Fire Departments, and Sullivan County EMS. The dispatch center receives approximately 100,000 calls each year.[24]
As of 2022[update] the sheriff is Jeff Cassidy, who won election in 2018 after a very contentious race against previous sheriff Wayne Anderson.[25] Anderson apologized after sending text messages to a corrections employee that threatened to fire anyone who voted for his opponent, Jeff Cassidy, and saying that department employees would urinate on Cassidy's grave.[26]
A 2022 lawsuit claims that sheriff's deputies retaliated against a woman who had asked them to wear face masks due to the COVID-19 pandemic.[27]
Since the organization was established, 10 members of the sheriff's office have died in the line of duty.[28]
Communities
Cities
- Bluff City
- Bristol
- Johnson City (mostly in Washington County and a small portion in Carter County)
- Kingsport (partial)
Census-designated places
- Bloomingdale
- Blountville (county seat)
- Colonial Heights
- Orebank
- Spurgeon (partial)
- Sullivan Gardens
- Walnut Hill
Unincorporated communities
- Arcadia
- Boring
- Buffalo
- Cedar Grove (east)
- Cedar Grove (west)
- Fordtown
- Holston Valley
- Lynn Garden
- Morrison City
- Piney Flats
Education
The three school districts are Bristol Tennessee City Schools, Kingsport City School District, and Sullivan County School District.[29]
Notable people
- Besse Cooper, (1896-2012), age 116, the world's oldest living person from June 21, 2011, until her death on December 4, 2012.
- Austin Augustus King (1802–1870), American lawyer, politician, and military officer. Tenth governor of Missouri and a one-term United States congressman.
- John Smith, early leader in the Restoration Movement.
See also
- National Register of Historic Places listings in Sullivan County, Tennessee
- Rader v. State (1880)
References
- Blythe Semmer, "Sullivan County," Tennessee Encyclopedia of History and Culture. Retrieved: 7 April 2013.
- "State & County QuickFacts". United States Census Bureau. Archived from the original on July 7, 2011. Retrieved December 7, 2013.
- "Find a County". National Association of Counties. Retrieved June 7, 2011.
- Sullivan County official website. Retrieved: 6 November 2013.
- J.D. Lewis, "North Carolina Counties from 1664 to Present," 2004. Retrieved: 7 April 2013.
- Tennessee's Counties, Tennessee Blue Book, 2006.
- Oliver Perry Temple, East Tennessee and the Civil War (R. Clarke Company, 1899), p. 199.
- "2010 Census Gazetteer Files". United States Census Bureau. August 22, 2012. Retrieved April 14, 2015.
- Tennessee Department of Environment and Conservation, et al., "Ambient Air Monitoring Plan," Environmental Protection Agency website, 1 July 2010. Accessed: 18 March 2015.
- Bob Gulden, USA Long Cave List, April 16, 2007
- Larry E. Matthews, Caves of Knoxville and the Great Smoky Mountains (National Speleological Society, June 2008), pp. 253-276. ISBN 978-1-879961-30-2
- Laurie Adams, "History of Morrell Cave, Part I" (Flittermouse Grotto of the National Speleological Society, August 1984).
- "U.S. Decennial Census". United States Census Bureau. Retrieved April 14, 2015.
- "Historical Census Browser". University of Virginia Library. Retrieved April 14, 2015.
- Forstall, Richard L., ed. (March 27, 1995). "Population of Counties by Decennial Census: 1900 to 1990". United States Census Bureau. Retrieved April 14, 2015.
- "Census 2000 PHC-T-4. Ranking Tables for Counties: 1990 and 2000" (PDF). United States Census Bureau. April 2, 2001. Archived (PDF) from the original on October 9, 2022. Retrieved April 14, 2015.
- Based on 2000 census data
- "Explore Census Data". data.census.gov. Retrieved December 26, 2021.
- "U.S. Census website". United States Census Bureau. Retrieved May 14, 2011.
- Sullivan County Commissioner Information, official county website. Retrieved: 7 April 2013.
- John Osbourne, Partisan elections on tap for Sullivan County Commission, Kingsport Times News, November 20, 2009
- Leip, David. "Dave Leip's Atlas of U.S. Presidential Elections". uselectionatlas.org. Retrieved March 12, 2018.
- "ATLAS DES ÉLECTIONS PRÉSIDENTIELLES AMÉRICAINES DEPUIS 1789" (in French). Retrieved July 12, 2022.
- "Sheriff | Sullivan County TN". Retrieved November 6, 2022.
- Spell, Lurah (August 10, 2018). "Sullivan sheriff-elect plans to shake up current staff". Bristol Herald Courier - Tricities. Retrieved October 16, 2022.
- Smith, Rain (July 29, 2018). "Sullivan Co. sheriff apologizes for texts blasting opponent, threatening employees". Johnson City Press. Retrieved October 16, 2022.
- Satterfield, Jamie (May 23, 2022). "Sullivan County woman claims sheriff's deputies retaliated after she insisted on masks". Tennessee Lookout. Retrieved October 16, 2022.
- "Sullivan County Sheriff's Office, TN".
- "2020 CENSUS - SCHOOL DISTRICT REFERENCE MAP: Sullivan County, TN" (PDF). U.S. Census Bureau. Archived (PDF) from the original on October 9, 2022. Retrieved September 24, 2021. - Text list
Further reading
- Sullivan County, Tennessee Veterans History. Nashville: Turner Publishing Company (2001). ISBN 1-56311-774-6
External links
- Official website

- NETWORKS - Sullivan Partnership
- Sullivan County Dept. of Education
- Sullivan Co, TN American Local History Network
- Sullivan County TNGenWeb
- Sullivan County at Curlie
Places adjacent to Sullivan County, Tennessee | ||||||||||||||||
|---|---|---|---|---|---|---|---|---|---|---|---|---|---|---|---|---|
| ||||||||||||||||
Municipalities and communities of Sullivan County, Tennessee, United States | ||
|---|---|---|
County seat: Blountville | ||
| Cities |  | |
| CDPs |
| |
| Other communities |
| |
| Footnotes | ‡This populated place also has portions in an adjacent county or counties | |
| ||
Authority control | |
|---|---|
| General | |
| National libraries | |
| Other | |
На других языках
[de] Sullivan County (Tennessee)
Sullivan County[1] ist ein County im Bundesstaat Tennessee der Vereinigten Staaten. Der Verwaltungssitz (County Seat) ist Blountville.- [en] Sullivan County, Tennessee
[es] Condado de Sullivan (Tennessee)
El condado de Sullivan (en inglés: Sullivan County, Tennessee), fundado en 1779, es uno de los 95 condados del estado estadounidense de Tennessee. En el año 2000 tenía una población de 153.048 habitantes con una densidad poblacional de 143 personas por km².[1] La sede del condado es Shelbyville.[2][ru] Салливан (округ, Теннесси)
Округ Салливан (англ. Sullivan County) располагается в штате Теннесси, США. Официально образован в 1779 году. По состоянию на 2010 год, численность населения составляла 156 823 человека.Другой контент может иметь иную лицензию. Перед использованием материалов сайта WikiSort.org внимательно изучите правила лицензирования конкретных элементов наполнения сайта.
WikiSort.org - проект по пересортировке и дополнению контента Википедии