world.wikisort.org - USA
Haywood County is a county located in the U.S. state of Tennessee, in the region known as West Tennessee. As of the 2020 census, the population was 17,864. Its county seat and largest city is Brownsville.[2] It is one of only two remaining counties in Tennessee, along with Shelby County, with a majority African-American population.
This article needs additional citations for verification. (October 2021) |
Haywood County | |
|---|---|
U.S. county | |
 Haywood County Courthouse | |
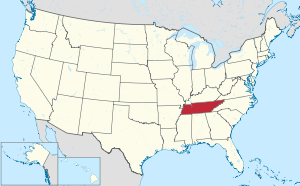
 Location within the U.S. state of Tennessee | |
 Tennessee's location within the U.S. | |
| Coordinates: 35°35′N 89°17′W | |
| Country | |
| State | |
| Founded | 1823 |
| Named for | John Haywood[1] |
| Seat | Brownsville |
| Largest city | Brownsville |
| Area | |
| • Total | 534 sq mi (1,380 km2) |
| • Land | 533 sq mi (1,380 km2) |
| • Water | 0.9 sq mi (2 km2) 0.2%% |
| Population (2020) | |
| • Total | 17,864 |
| • Density | 35/sq mi (14/km2) |
| Time zone | UTC−6 (Central) |
| • Summer (DST) | UTC−5 (CDT) |
| Congressional district | 8th |
| Website | Haywood County |
History
Haywood County was created from part of Madison County in 1823–24, and was named for Tennessee judge and historian John Haywood. The state legislature designated Brownsville as the county seat.[3] Haywood County was later reduced in size, when both Lauderdale and Crockett counties were created from its territory.
For much of the county's history, agriculture, especially growing cotton as a commodity, was the basis of the local economy, as it was throughout western Tennessee, which was in the Mississippi Valley. Before the Civil War, this was accomplished by a plantation system based on the use of enslaved African-American workers.
After Emancipation in 1865, many planters hired freedmen as tenant farmers and sharecroppers to produce the cotton crops, which were still important to the state.[4] The largely rural county continues to have a majority-black population.
Whites lynched three African Americans in the county, most at the county seat of Brownsville, in the period following Reconstruction and into the early 20th century.[5]
On June 20, 1940, Elbert Williams, an African American, was killed in Brownsville for "attempting to qualify to vote" and "an interest in Negro affairs."[6] He had organized a local chapter of the NAACP (National Association for the Advancement of Colored People). He was the last recorded lynching victim in the state.[7] Like other southern states, Tennessee had raised barriers at the turn of the century to voter registration to disenfranchise blacks. Whites maintained the political exclusion, sometimes with violence. Williams was murdered and his body was thrown into the Hatchie River.[6] It was later recovered.
Geography
According to the U.S. Census Bureau, the county has a total area of 534 square miles (1,380 km2), of which 533 square miles (1,380 km2) is land and 0.9 square miles (2.3 km2) (0.2%) is water.[8]
Haywood County is situated on the southeastern edge of the New Madrid Seismic Zone, an area with a high earthquake risk.
Adjacent counties
- Crockett County (north)
- Madison County (east)
- Hardeman County (southeast)
- Fayette County (south)
- Tipton County (west)
- Lauderdale County (northwest)
National protected area
- Hatchie National Wildlife Refuge
Demographics
From 1940 to 1970, the county population declined. Many Black Americans left after confrontations and the murder of Elbert Williams in 1940 related to Black attempts to register to vote. In addition, mechanization of agriculture reduced the need for farm workers, and other African Americans left as part of the second wave of the Great Migration. A total of more than five million migrated out of the south during those decades, moving especially to the West Coast for the expanding defense industry, and to industrial cities for work opportunities.
| Historical population | |||
|---|---|---|---|
| Census | Pop. | %± | |
| 1830 | 5,334 | — | |
| 1840 | 13,870 | 160.0% | |
| 1850 | 17,259 | 24.4% | |
| 1860 | 19,232 | 11.4% | |
| 1870 | 25,094 | 30.5% | |
| 1880 | 26,053 | 3.8% | |
| 1890 | 23,558 | −9.6% | |
| 1900 | 25,189 | 6.9% | |
| 1910 | 25,910 | 2.9% | |
| 1920 | 25,386 | −2.0% | |
| 1930 | 26,063 | 2.7% | |
| 1940 | 27,699 | 6.3% | |
| 1950 | 26,212 | −5.4% | |
| 1960 | 23,393 | −10.8% | |
| 1970 | 19,596 | −16.2% | |
| 1980 | 20,318 | 3.7% | |
| 1990 | 19,437 | −4.3% | |
| 2000 | 19,797 | 1.9% | |
| 2010 | 18,787 | −5.1% | |
| 2020 | 17,864 | −4.9% | |
| U.S. Decennial Census[9] 1790–1960[10] 1900–1990[11] 1990–2000[12] 2010–2014[13] | |||
![Age pyramid Haywood County[14]](http://upload.wikimedia.org/wikipedia/commons/thumb/d/d3/USA_Haywood_County%2C_Tennessee.csv_age_pyramid.svg/150px-USA_Haywood_County%2C_Tennessee.csv_age_pyramid.svg.png)
2020 census
| Race | Num. | Perc. |
|---|---|---|
| White (non-Hispanic) | 7,554 | 42.29% |
| Black or African American (non-Hispanic) | 8,993 | 50.34% |
| Native American | 33 | 0.18% |
| Asian | 26 | 0.15% |
| Pacific Islander | 6 | 0.03% |
| Other/Mixed | 414 | 2.32% |
| Hispanic or Latino | 838 | 4.69% |
As of the 2020 United States census, there were 17,864 people, 7,181 households, and 4,727 families residing in the county.
2010 census
As of the 2010 United States Census, there were 18,787 people living in the county. 50.4% were Black or African American, 45.9% White, 0.2% Native American, 0.1% Asian, 2.5% of some other race and 0.9% of two or more races. 3.8% were Hispanic or Latino (of any race).
2000 census
As of the census[16] of 2000, there were 19,797 people, 7,558 households, and 5,419 families living in the county. The population density was 37 people per square mile (14/km2). There were 8,086 housing units at an average density of 15 per square mile (6/km2). The racial makeup of the county was 51.05% Black or African American, 46.73% White, 0.12% Native American, 0.09% Asian, 0.05% Pacific Islander, 1.38% from other races, and 0.58% from two or more races. 2.65% of the population were Hispanic or Latino of any race. Haywood and Shelby Counties are the only counties in Tennessee with a black majority.
There were 7,558 households, out of which 33.40% had children under the age of 18 living with them, 45.80% were married couples living together, 22.00% had a female householder with no husband present, and 28.30% were non-families. 25.40% of all households were made up of individuals, and 11.10% had someone living alone who was 65 years of age or older. The average household size was 2.59 and the average family size was 3.09.
In the county, the population was spread out, with 27.20% under the age of 18, 9.80% from 18 to 24, 27.30% from 25 to 44, 21.90% from 45 to 64, and 13.80% who were 65 years of age or older. The median age was 35 years. For every 100 females there were 87.80 males. For every 100 females age 18 and over, there were 82.40 males.
The median income for a household in the county was $27,671, and the median income for a family was $32,597. Males had a median income of $27,333 versus $21,361 for females. The per capita income for the county was $14,669. About 16.30% of families and 19.50% of the population were below the poverty line, including 24.00% of those under age 18 and 25.70% of those age 65 or over.
Economy
The largest industry in Haywood County is agriculture. Haywood County grows more cotton that any other county in Tennessee and produced 189,000 bales in 2003 on 103,000 acres (420 km2). Soybeans were the county's #2 crop, followed by corn.[citation needed] Agriculture and agri-related businesses contributed more than $130,000 million to the Haywood County economy in 2004. By 2017, grains, oilseeds, drybeans, drypeas and tobacco drew the most income, but Haywood country still grew the most cotton in the state.[17]
In 2009, under the leadership of Tennessee Governor Phil Bredesen and Haywood County Mayor Franklin Smith, a 3,836-acre (1,552 ha) tract in southwestern Haywood County near Stanton was designated for a state-supported industrial "megasite," intended for a large-scale industrial or business development such as an automobile assembly plant. In September 2009, Tennessee's State Building Commission authorized spending of $40 million for purchase of the land.[18] On September 27, 2021, it was announced that Ford and SK Innovation would construct a complex at the megasite called "Blue Oval City" to manufacture electric vehicles and batteries. The facility, which is expected to be operational in 2025, will cost approximately $5.6 billion, making it the most expensive single investment in state history, and employ approximately 5,700.[19][20]
Communities

City
- Brownsville (county seat)
Town
Unincorporated communities
- Belle Eagle
- Christmasville
- Dancyville
- Nutbush
Notable residents
One of Haywood County's most notable residents was Sleepy John Estes, a blues guitarist songwriter and vocalist. Born in 1899 or 1904 in Ripley, Tennessee, he lived most of his life in Brownsville.[21] He died on June 5, 1977, in Brownsville.[22][23][24] Sleepy John is buried at Elam Baptist Church Cemetery in Durhamville, Lauderdale County.[24]
Other notable county residents include:
- Tony Delk, a first round NBA draft pick spent his adolescent years in Brownsville.
- Hambone Willie Newbern, blues musician from the Brownsville area
- Singer Tina Turner spent her childhood in Nutbush, Haywood County. Her song "Nutbush City Limits" was based off by the town.
- Elbert Williams, voting rights activist
Politics
| Year | Republican | Democratic | Third party | |||
|---|---|---|---|---|---|---|
| No. | % | No. | % | No. | % | |
| 2020 | 3,343 | 44.94% | 4,012 | 53.93% | 84 | 1.13% |
| 2016 | 3,013 | 44.09% | 3,711 | 54.30% | 110 | 1.61% |
| 2012 | 2,960 | 39.11% | 4,569 | 60.36% | 40 | 0.53% |
| 2008 | 3,165 | 38.97% | 4,893 | 60.25% | 63 | 0.78% |
| 2004 | 3,140 | 41.60% | 4,359 | 57.75% | 49 | 0.65% |
| 2000 | 2,554 | 39.43% | 3,887 | 60.00% | 37 | 0.57% |
| 1996 | 2,293 | 38.03% | 3,565 | 59.12% | 172 | 2.85% |
| 1992 | 2,518 | 39.49% | 3,511 | 55.07% | 347 | 5.44% |
| 1988 | 2,687 | 47.64% | 2,923 | 51.83% | 30 | 0.53% |
| 1984 | 2,839 | 46.04% | 3,308 | 53.65% | 19 | 0.31% |
| 1980 | 2,435 | 40.97% | 3,445 | 57.97% | 63 | 1.06% |
| 1976 | 1,952 | 34.48% | 3,681 | 65.02% | 28 | 0.49% |
| 1972 | 3,123 | 59.45% | 1,966 | 37.43% | 164 | 3.12% |
| 1968 | 1,152 | 20.51% | 1,709 | 30.42% | 2,757 | 49.07% |
| 1964 | 2,407 | 51.25% | 2,290 | 48.75% | 0 | 0.00% |
| 1960 | 1,188 | 35.63% | 1,867 | 56.00% | 279 | 8.37% |
| 1956 | 516 | 17.04% | 2,217 | 73.22% | 295 | 9.74% |
| 1952 | 940 | 27.80% | 2,432 | 71.93% | 9 | 0.27% |
| 1948 | 148 | 6.95% | 1,050 | 49.32% | 931 | 43.73% |
| 1944 | 208 | 7.61% | 2,525 | 92.36% | 1 | 0.04% |
| 1940 | 128 | 3.56% | 3,466 | 96.33% | 4 | 0.11% |
| 1936 | 29 | 1.65% | 1,725 | 98.23% | 2 | 0.11% |
| 1932 | 77 | 4.09% | 1,788 | 95.01% | 17 | 0.90% |
| 1928 | 178 | 8.08% | 2,024 | 91.92% | 0 | 0.00% |
| 1924 | 60 | 3.08% | 1,872 | 96.15% | 15 | 0.77% |
| 1920 | 101 | 4.64% | 2,068 | 95.04% | 7 | 0.32% |
| 1916 | 61 | 3.49% | 1,677 | 95.88% | 11 | 0.63% |
| 1912 | 34 | 2.79% | 1,069 | 87.69% | 116 | 9.52% |
In presidential elections, Haywood County trends Democratic; in the 2020 election it was one of only three counties (along with Davidson and Shelby) to vote for Democrat Joe Biden over Republican Donald Trump. However, Trump came the closest a Republican has gotten to winning the county in 2020, losing by 9 percent, since President George H. W. Bush lost by slightly over 4 percent in 1988. Richard Nixon is the last Republican presidential candidate to carry the county, winning it in his 1972 reelection bid.
See also
- National Register of Historic Places listings in Haywood County, Tennessee
Further reading
- West, Carroll Van; Duncan Binnicker, Margaret (2004). A History of Tennessee Arts. Knoxville, TN: The University of Tennessee Press. ISBN 1-57233-239-5.
- Norris, Sharon (2000). Black America Series: Haywood County Tennessee. Mount Pleasant, SC: Arcadia Publishing. ISBN 0-7385-0605-2.
- Nunn, Emma (2017). "Haywood Country." Tennessee Encyclopedia. Nashville: Tennessee Historical Society.
References
- Emma Nunn, "Haywood County," Tennessee Encyclopedia of History and Culture. Retrieved: October 16, 2013.
- "Find a County". National Association of Counties. Archived from the original on May 31, 2011. Retrieved 2011-06-07.
- Gannett, Henry (1905). The Origin of Certain Place Names in the United States. Govt. Print. Off. pp. 153.
- Nunn, Emma. "Haywood County", in The Tennessee Encyclopedia of History and Culture, Version 2.0
- Lynching in America/ Supplement: Lynchings by County Archived June 27, 2018, at the Wayback Machine, Equal Justice Initiative, 2015, p. 6
- Jessie P. Guzzman & W. Hardin Hughes, “Lynching-Crime,” Negro Year Book: A Review of Events Affecting Negro Life, 1944-1946, 1947; part of National Humanities Center, The Making of African American Identity, Vol. III, 1917-1968; accessed 04 June 2018
- Kathy Bennett, "Lynching", Tennessee Encyclopedia, 2017/updated 2018
- "2010 Census Gazetteer Files". United States Census Bureau. August 22, 2012. Retrieved April 5, 2015.
- "U.S. Decennial Census". United States Census Bureau. Retrieved April 5, 2015.
- "Historical Census Browser". University of Virginia Library. Retrieved April 5, 2015.
- Forstall, Richard L., ed. (March 27, 1995). "Population of Counties by Decennial Census: 1900 to 1990". United States Census Bureau. Retrieved April 5, 2015.
- "Census 2000 PHC-T-4. Ranking Tables for Counties: 1990 and 2000" (PDF). United States Census Bureau. April 2, 2001. Archived (PDF) from the original on October 9, 2022. Retrieved April 5, 2015.
- "State & County QuickFacts". United States Census Bureau. Archived from the original on June 7, 2011. Retrieved December 2, 2013.
- Based on 2000 census data
- "Explore Census Data". data.census.gov. Retrieved December 8, 2021.
- "U.S. Census website". United States Census Bureau. Retrieved 2011-05-14.
- "2017 Census of Agriculture County Profile" (PDF). US Department of Agriculture, National Agricultural Statistics Service. Retrieved February 3, 2021.
{{cite web}}: CS1 maint: url-status (link) - Chad Sisk, $40M approved for West TN megasite development[permanent dead link], The Tennessean, September 30, 2009
- "Ford to invest $5.6 billion in Memphis-area Megasite to build electric vehicles and batteries". WHBQ-TV. Memphis. September 27, 2021. Retrieved September 28, 2021.
- Round, Ian; Dries, Bill; Moore, Rob (September 27, 2021). "Ford, SK Innovation to invest $5.6B in Memphis Regional Megasite". The Daily Memphian. Retrieved September 28, 2021.
- Biography at 7digital.com from the Encyclopedia of Popular Music – accessed February 2008
- Allaboutjazz.com birth and death details Archived January 18, 2009, at the Wayback Machine
- Brian Dempsey. "'Sleepy' John Estes". Tennessee Encyclopedia of History and Culture. Retrieved December 16, 2008.
- Norris, Sharon (2000). Black America Series: Haywood County Tennessee. Mount Pleasant, SC: Arcadia Publishing. ISBN 0-7385-0605-2.
- Leip, David. "Dave Leip's Atlas of U.S. Presidential Elections". uselectionatlas.org. Retrieved March 10, 2018.
External links
- Chamber of Commerce site
- Haywood County, TNGenWeb – free genealogy resources for the county
- Haywood County at Curlie
- The Goodspeed History Haywood County, Tennessee, 1887
Places adjacent to Haywood County, Tennessee | ||||||||||||||||
|---|---|---|---|---|---|---|---|---|---|---|---|---|---|---|---|---|
| ||||||||||||||||
Municipalities and communities of Haywood County, Tennessee, United States | ||
|---|---|---|
County seat: Brownsville | ||
| City |  | |
| Town | ||
| CDP |
| |
| Other communities |
| |
| ||
Authority control | |
|---|---|
| General | |
| National libraries | |
| Other |
|
На других языках
[de] Haywood County (Tennessee)
Das Haywood County[1] ist ein County im US-amerikanischen Bundesstaat Tennessee. Im Jahr 2010 hatte das County 18.787 Einwohner und eine Bevölkerungsdichte von 13,6 Einwohnern pro Quadratkilometer.[2] Der Verwaltungssitz (County Seat) ist Brownsville.[3]- [en] Haywood County, Tennessee
[ru] Хейвуд (округ, Теннесси)
Округ Хейвуд (англ. Haywood County) располагается в штате Теннесси, США. Официально образован в 1823 году. По состоянию на 2010 год, численность населения составляла 18 787 человек.Другой контент может иметь иную лицензию. Перед использованием материалов сайта WikiSort.org внимательно изучите правила лицензирования конкретных элементов наполнения сайта.
WikiSort.org - проект по пересортировке и дополнению контента Википедии