world.wikisort.org - USA
Benton County is a county located in the U.S. state of Tennessee. As of the 2020 census, the population was 15,864.[2] Its county seat is Camden.[3] The county was created in December 1835 and organized in 1836.[4][5]
Benton County | |
|---|---|
U.S. county | |
 Benton County Courthouse in Camden | |
 Seal | |
 Location within the U.S. state of Tennessee | |
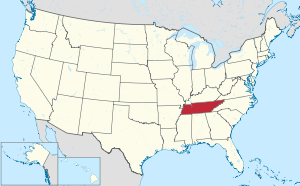 Tennessee's location within the U.S. | |
| Coordinates: 36°04′N 88°04′W | |
| Country | |
| State | |
| Founded | 1836 |
| Named for | David Benton (early settler)[1] |
| Seat | Camden |
| Largest city | Camden |
| Area | |
| • Total | 436 sq mi (1,130 km2) |
| • Land | 394 sq mi (1,020 km2) |
| • Water | 41 sq mi (110 km2) 9.6%% |
| Population (2020) | |
| • Total | 15,864 |
| • Density | 40.26/sq mi (15.54/km2) |
| Time zone | UTC−6 (Central) |
| • Summer (DST) | UTC−5 (CDT) |
| Congressional districts | 7th, 8th |
| Website | www |
Benton County is located in northwest Tennessee, bordering the western branch of the Tennessee River and 30 miles south of the Kentucky border. Aside from Camden, other major communities include agrarian communities Big Sandy and Holladay. It is known well in the area for its duck hunting and fishing industries, and in the past, was recognized for sorghum production, although it is no longer produced there.
History
Benton County was formed in 1835 from part of Humphreys County. It was named in honor of David Benton (1779–1860), who was an early settler in the county and a member of the Third Regiment, Tennessee Militia in the Creek War.
Geography
According to the U.S. Census Bureau, the county has a total area of 436 square miles (1,130 km2), of which 394 square miles (1,020 km2) is land and 42 square miles (110 km2) (9.6%) is water.[6]
Adjacent counties
- Stewart County (northeast)
- Houston County (northeast)
- Humphreys County (east)
- Perry County (southeast)
- Decatur County (south)
- Carroll County (west)
- Henry County (northwest)
National protected area
- Tennessee National Wildlife Refuge (part)
State protected areas
- Big Sandy Wildlife Management Area (part)
- Camden Wildlife Management Area
- Nathan Bedford Forrest State Park
- Harmon Creek Wildlife Management Area
- Lick Creek Wildlife Management Area
- Natchez Trace State Forest (part)
- Natchez Trace State Park (part)
- New Hope Wildlife Management Area
Demographics
| Historical population | |||
|---|---|---|---|
| Census | Pop. | %± | |
| 1840 | 4,772 | — | |
| 1850 | 6,315 | 32.3% | |
| 1860 | 8,463 | 34.0% | |
| 1870 | 8,234 | −2.7% | |
| 1880 | 9,780 | 18.8% | |
| 1890 | 11,230 | 14.8% | |
| 1900 | 11,888 | 5.9% | |
| 1910 | 12,452 | 4.7% | |
| 1920 | 12,046 | −3.3% | |
| 1930 | 11,237 | −6.7% | |
| 1940 | 11,976 | 6.6% | |
| 1950 | 11,495 | −4.0% | |
| 1960 | 10,662 | −7.2% | |
| 1970 | 12,126 | 13.7% | |
| 1980 | 14,901 | 22.9% | |
| 1990 | 14,524 | −2.5% | |
| 2000 | 16,537 | 13.9% | |
| 2010 | 16,489 | −0.3% | |
| 2020 | 15,864 | −3.8% | |
| U.S. Decennial Census[7] 1790-1960[8] 1900-1990[9] 1990-2000[10] 2010-2020[2] | |||
![Age pyramid Benton County[11]](http://upload.wikimedia.org/wikipedia/commons/thumb/b/b5/USA_Benton_County%2C_Tennessee.csv_age_pyramid.svg/150px-USA_Benton_County%2C_Tennessee.csv_age_pyramid.svg.png)
2020 census
| Race | Num. | Perc. |
|---|---|---|
| White (non-Hispanic) | 14,378 | 90.63% |
| Black or African American (non-Hispanic) | 316 | 1.99% |
| Native American | 50 | 0.32% |
| Asian | 107 | 0.67% |
| Pacific Islander | 4 | 0.03% |
| Other/Mixed | 634 | 4.0% |
| Hispanic or Latino | 375 | 2.36% |
As of the 2020 United States census, there were 15,864 people, 6,762 households, and 3,832 families residing in the county.
2000 census
As of the census[13] of 2000, there were 16,537 people, 6,863 households, and 4,886 families residing in the county. The population density was 42 people per square mile (16/km2). There were 8,595 housing units at an average density of 22 per square mile (8/2). The racial makeup of the county was 96.44% White, 2.10% Black or African American, 0.33% Native American, 0.24% Asian, 0.20% from other races, and 0.69% from two or more races. 0.95% of the population were Hispanic or Latino of any race.
There were 6,863 households, out of which 27.30% had children under the age of 18 living with them, 58.10% were married couples living together, 9.50% had a female householder with no husband present, and 28.80% were non-families. 25.70% of all households were made up of individuals, and 12.30% had someone living alone who was 65 years of age or older. The average household size was 2.37 and the average family size was 2.82.
In the county, the population was spread out, with 22.00% under the age of 18, 7.00% from 18 to 24, 26.20% from 25 to 44, 27.00% from 45 to 64, and 17.70% who were 65 years of age or older. The median age was 42 years. For every 100 females there were 93.80 males. For every 100 females age 18 and over, there were 91.40 males.
The median income for a household in the county was $28,679, and the median income for a family was $32,727. Males had a median income of $29,177 versus $19,038 for females. The per capita income for the county was $14,646. About 11.90% of families and 15.60% of the population were below the poverty line, including 23.90% of those under age 18 and 11.70% of those age 65 or over.
Of the 16,459 people living in Benton County 0.03 percent are on some form of state advised probation. [citation needed]
Media
Radio stations
- WRJB-FM 95.9 "Magic 95.9 the Valley"
- WRQR-FM 105.5 (Henry Co) "Today's Best Music with Ace & TJ in the Morning"
- WTPR-AM 710 (Henry Co) "The Greatest Hits of All Time"
- WTPR-FM 101.7 (Henry Co) "The Greatest Hits of All Time"
Newspapers
The Camden Chronicle
- Tennessee Magnet Publications
Communities
City
- Camden (county seat)
Town
Census-designated place
Unincorporated communities
Politics
Benton County, like most West Tennessee counties, was historically a Democratic county. The Democratic nominee for president carried the county in every election prior to 2008 with the exception of 1968, when the county was won by third-party candidate George Wallace, and 1972, when it was won by Republican Richard Nixon. Like most rural counties in the South, Benton County has swung dramatically toward the GOP in the 21st century, and since 2008, it has been a Republican stronghold. The last Democrat to carry this county was John Kerry in 2004.
| Year | Republican | Democratic | Third party | |||
|---|---|---|---|---|---|---|
| No. | % | No. | % | No. | % | |
| 2020 | 5,668 | 78.07% | 1,529 | 21.06% | 63 | 0.87% |
| 2016 | 4,716 | 74.53% | 1,474 | 23.29% | 138 | 2.18% |
| 2012 | 3,850 | 61.84% | 2,258 | 36.27% | 118 | 1.90% |
| 2008 | 3,696 | 57.05% | 2,645 | 40.82% | 138 | 2.13% |
| 2004 | 3,161 | 44.58% | 3,869 | 54.57% | 60 | 0.85% |
| 2000 | 2,484 | 39.36% | 3,700 | 58.63% | 127 | 2.01% |
| 1996 | 2,395 | 32.15% | 4,341 | 58.27% | 714 | 9.58% |
| 1992 | 1,625 | 26.58% | 3,896 | 63.72% | 593 | 9.70% |
| 1988 | 2,167 | 43.26% | 2,826 | 56.42% | 16 | 0.32% |
| 1984 | 2,481 | 42.07% | 3,398 | 57.62% | 18 | 0.31% |
| 1980 | 2,281 | 36.83% | 3,811 | 61.54% | 101 | 1.63% |
| 1976 | 1,678 | 28.90% | 4,088 | 70.41% | 40 | 0.69% |
| 1972 | 2,614 | 61.83% | 1,479 | 34.98% | 135 | 3.19% |
| 1968 | 1,468 | 30.70% | 1,059 | 22.15% | 2,255 | 47.16% |
| 1964 | 1,363 | 34.30% | 2,611 | 65.70% | 0 | 0.00% |
| 1960 | 1,773 | 45.20% | 2,030 | 51.75% | 120 | 3.06% |
| 1956 | 1,279 | 36.22% | 2,231 | 63.18% | 21 | 0.59% |
| 1952 | 1,304 | 34.57% | 2,452 | 65.01% | 16 | 0.42% |
| 1948 | 908 | 32.57% | 1,757 | 63.02% | 123 | 4.41% |
| 1944 | 1,195 | 38.25% | 1,901 | 60.85% | 28 | 0.90% |
| 1940 | 858 | 29.82% | 1,996 | 69.38% | 23 | 0.80% |
| 1936 | 661 | 27.21% | 1,762 | 72.54% | 6 | 0.25% |
| 1932 | 455 | 22.51% | 1,540 | 76.20% | 26 | 1.29% |
| 1928 | 949 | 43.08% | 1,241 | 56.33% | 13 | 0.59% |
| 1924 | 714 | 38.53% | 1,097 | 59.20% | 42 | 2.27% |
| 1920 | 1,514 | 44.04% | 1,914 | 55.67% | 10 | 0.29% |
| 1916 | 805 | 37.58% | 1,313 | 61.30% | 24 | 1.12% |
| 1912 | 652 | 31.56% | 1,095 | 53.00% | 319 | 15.44% |
See also
- National Register of Historic Places listings in Benton County, Tennessee
References
- Johnathan K.T. Smith, "Benton County," Tennessee Encyclopedia of History and Culture. Retrieved: 31 March 2013.
- "Benton County, Tennessee". quickfacts.census.gov. United States Census Bureau. Retrieved August 29, 2021.
- "Find a County". National Association of Counties. Archived from the original on May 31, 2011. Retrieved June 7, 2011.
- "Tennessee: Individual County Chronologies". Tennessee Atlas of Historical County Boundaries. The Newberry Library. 2007. Archived from the original on February 3, 2018. Retrieved April 15, 2015.
- "Benton County". Tennessee Encyclopedia of History and Culture. Tennessee Historical Society. December 25, 2009. Retrieved April 15, 2015.
- "2010 Census Gazetteer Files". United States Census Bureau. August 22, 2012. Retrieved April 1, 2015.
- "U.S. Decennial Census". United States Census Bureau. Retrieved April 1, 2015.
- "Historical Census Browser". University of Virginia Library. Retrieved April 1, 2015.
- Forstall, Richard L., ed. (March 27, 1995). "Population of Counties by Decennial Census: 1900 to 1990". United States Census Bureau. Retrieved April 1, 2015.
- "Census 2000 PHC-T-4. Ranking Tables for Counties: 1990 and 2000" (PDF). United States Census Bureau. April 2, 2001. Archived (PDF) from the original on October 9, 2022. Retrieved April 1, 2015.
- Based on 2000 census data
- "Explore Census Data". data.census.gov. Retrieved December 8, 2021.
- "U.S. Census website". United States Census Bureau. Retrieved May 14, 2011.
- Leip, David. "Dave Leip's Atlas of U.S. Presidential Elections". uselectionatlas.org. Retrieved March 9, 2018.
External links
- Benton County, TN Government Web Site
- Benton County-Camden Chamber of Commerce
- Benton County Schools
- Benton County at Curlie
- TNGenWeb
Places adjacent to Benton County, Tennessee | ||||||||||||||||
|---|---|---|---|---|---|---|---|---|---|---|---|---|---|---|---|---|
| ||||||||||||||||
Municipalities and communities of Benton County, Tennessee, United States | ||
|---|---|---|
County seat: Camden | ||
| City |  | |
| Town | ||
| CDPs | ||
| Other community | ||
| Footnotes | ‡This populated place also has portions in an adjacent county or counties. | |
| ||
State of Tennessee | |
|---|---|
Nashville (capital) | |
| Topics |
|
| Culture |
|
| Grand Divisions | |
| Regions |
|
| Largest cities | |
| Counties |
|
Authority control | |
|---|---|
| General | |
| National libraries | |
| Other |
|
На других языках
[de] Benton County (Tennessee)
Das Benton County[1] ist ein County im US-amerikanischen Bundesstaat Tennessee. Im Jahr 2010 hatte das County 16.489 Einwohner und eine Bevölkerungsdichte von 16,1 Einwohnern pro Quadratkilometer. Bis 2013 verringerte sich die Einwohnerzahl auf 16.290.[2] Der Verwaltungssitz (County Seat) ist Camden.[3]- [en] Benton County, Tennessee
[ru] Бентон (округ, Теннесси)
Округ Бентон (англ. Benton County) располагается в штате Теннесси, США. Официально образован 19-го декабря 1835 года. По состоянию на 2010 год, численность населения составляла 16 489 человек.Другой контент может иметь иную лицензию. Перед использованием материалов сайта WikiSort.org внимательно изучите правила лицензирования конкретных элементов наполнения сайта.
WikiSort.org - проект по пересортировке и дополнению контента Википедии