world.wikisort.org - USA
Los Alamos County (English: "The Poplars" or "Cottonwoods") is a county in the U.S. state of New Mexico. As of the 2010 census, the population was 17,950.[1] The smallest county by area in the state, Los Alamos County was formerly administered exclusively by the U.S. federal government during the Manhattan Project, but it now has equal status to New Mexico's other counties. The county has two census-designated places: Los Alamos and White Rock.[2]
Los Alamos County | |
|---|---|
U.S. county | |
 Ashley Pond in Los Alamos | |
 Seal | |
 Location within the U.S. state of New Mexico | |
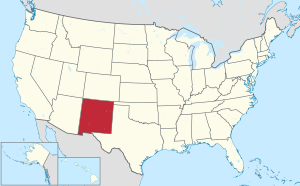 New Mexico's location within the U.S. | |
| Coordinates: 35°52′N 106°19′W | |
| Country | |
| State | |
| Founded | 1949 |
| Seat | Los Alamos |
| Largest community | Los Alamos |
| Area | |
| • Land | 109 sq mi (280 km2) |
| • Water | 0.09 sq mi (0.2 km2) 0.08%% |
| Population | |
| • Estimate (2019) | 19,369 |
| • Density | 164/sq mi (63/km2) |
| Time zone | UTC−7 (Mountain) |
| • Summer (DST) | UTC−6 (MDT) |
| Congressional district | 3rd |
| Website | www |
Los Alamos County comprises the Los Alamos, NM Micropolitan Statistical Area, which is also included in the Albuquerque–Santa Fe–Las Vegas, NM Combined Statistical Area.
The county is home to the Los Alamos National Laboratory. Los Alamos County is noted for having the lowest level of child poverty of any county in the United States.[3]
Geography
According to the U.S. Census Bureau, the county has a total area of 109 square miles (280 km2), of which 109 square miles (280 km2) is land and 0.09 square miles (0.23 km2) (0.08%) is water.[4] It is the smallest county by area in New Mexico. There is no significant open water in the county. The county's highest point is located along its northern border, near the summit of Caballo Mountain, at 10,480 feet (3,190 m) above sea level.
Adjacent counties
- Rio Arriba County – northeast
- Santa Fe County – east
- Sandoval County – south, west, north (and the Sandoval exclave to the east)
Pueblos with adjacent territories
- Santa Clara Pueblo – northeast
- San Ildefonso Pueblo – east
National protected areas
- Bandelier National Monument (part)
- Santa Fe National Forest (part)
Demographics
| Historical population | |||
|---|---|---|---|
| Census | Pop. | %± | |
| 1950 | 10,476 | — | |
| 1960 | 13,037 | 24.4% | |
| 1970 | 15,198 | 16.6% | |
| 1980 | 17,599 | 15.8% | |
| 1990 | 18,115 | 2.9% | |
| 2000 | 18,343 | 1.3% | |
| 2010 | 17,950 | −2.1% | |
| 2019 (est.) | 19,369 | [5] | 7.9% |
| U.S. Decennial Census[6] 1790–1960[7] 1900–1990[8] 1990–2000[9] 2010–2016[1] | |||
2000 census
As of the 2000 census,[10] there were 18,343 people, 7,497 households, and 5,337 families living in the county. The population density was 168 people per square mile (65/km2). There were 7,937 housing units at an average density of 73 per square mile (28/km2). The racial makeup of the county was 90.3% White, 0.4% Black or African American, 0.6% Native American, 3.8% Asian, <0.1% Pacific Islander, 2.7% from other races, and 2.3% from two or more races. 11.8% of the population were Hispanic or Latino of any race.
There were 7,497 households, out of which 33.5% had children under the age of 18 living with them, 62.7% were married couples living together, 5.7% had a female householder with no husband present, and 28.8% were non-families. 24.9% of all households were made up of individuals, and 6.7% had someone living alone who was 65 years of age or older. The average household size was 2.43 and the average family size was 2.92.
In the county, the population was spread out, with 25.8% under the age of 18, 4.4% from 18 to 24, 27.7% from 25 to 44, 30.0% from 45 to 64, and 12.1% who were 65 years of age or older. The median age was 41 years. For every 100 females there were 101.40 males. For every 100 females age 18 and over, there were 99.70 males.
The median income for a household in the county was $78,993, and the median income for a family was $90,032. Males had a median income of $70,063 versus $40,246 for females. The per capita income for the county was $34,646. 2.9% of the population and 1.9% of families were below the poverty line. 1.8% of those under the age of 18 and 4.7% of those 65 and older were living below the poverty line.
2010 census
As of the 2010 census, there were 17,950 people, 7,663 households, and 5,199 families living in the county.[11] The population density was 164.4 inhabitants per square mile (63.5/km2). There were 8,354 housing units at an average density of 76.5 per square mile (29.5/km2).[12] The racial makeup of the county was 87.8% white, 6.0% Asian, 0.8% American Indian, 0.6% black or African American, 0.1% Pacific islander, 2.2% from other races, and 2.6% from two or more races. Those of Hispanic or Latino origin made up 14.7% of the population.[11] In terms of ancestry, 18.9% were German, 16.5% were English, 13.2% were Irish, and 6.5% were American.[13]
Of the 7,663 households, 31.3% had children under the age of 18 living with them, 58.1% were married couples living together, 6.4% had a female householder with no husband present, 32.2% were non-families, and 28.5% of all households were made up of individuals. The average household size was 2.33 and the average family size was 2.86. The median age was 44.3 years.[11]
The median income for a household in the county was $103,643 and the median income for a family was $118,993. Males had a median income of $93,040 versus $51,753 for females. The per capita income for the county was $49,474. About 1.4% of families and 2.4% of the population were below the poverty line, including 1.8% of those under age 18 and 2.4% of those age 65 or over.[14]
Government
County council
The County council was created by the Los Alamos County Charter. The Council consists of seven members elected at large for four-year, staggered terms. Each year the party in control of the council selects the new chair.[15]
| Position | Name | Party reg. |
|---|---|---|
| County councilor, Chair | Randall Ryti | Democrat |
| County councilor, Vice Chair | Denise Derkacs | Democrat |
| County councilor, At-large | David Izraelevitz | Democrat |
| County councilor, At–large | Sara Scott | Democrat |
| County councilor, At–large | David Reagor | Republican |
| County councilor, At–large | Keith Lepsch | Democrat |
| County councilor, At–large | Melanee Hand | Democrat |
County offices
| Name | Position | Party reg. |
|---|---|---|
| County Assessor | Kenneth Milder | Democrat |
| County Clerk | Naomi Maestas | Democrat[16] |
| Municipal Judge | Elizabeth K. Allen | Democrat |
| Sheriff | Joe Granville | Democrat |
Quality of life
In a study conducted by American City Business Journals in 2004, Los Alamos County topped the list as the best place to live in the United States in terms of quality of life. This was attributed to the high levels of job stability, income and education of Los Alamos residents, many of whom are employed as scientists and engineers at the Los Alamos National Laboratory. The county has one of the highest number of PhDs per capita and the 2011 median household income of $110,204 per year is the second highest among all the counties in the U.S. In per capita income, Los Alamos County ranks 1st in New Mexico and 7th in the United States, and has the second-lowest level of poverty in the United States, and the lowest level of child poverty.[3] Other factors contributing to Los Alamos's high quality-of-life index were the access to affordable housing and short commuting times.
In 2021, Los Alamos County was judged by the U.S. News & World Report to be the healthiest of 3,143 counties and county-equivalents of the United States based on 84 different factors. Residents of the county lived 83.4 years on the average compared to the U.S. average of 77.5 years.[17]
Communities
- Los Alamos (county seat)
- White Rock
Education
All of the county is in the boundary of Los Alamos Public Schools.[18] Los Alamos High School is the comprehensive high school.
Politics
Formerly solidly Republican, Los Alamos County has voted Democratic in the four most recent presidential elections. It has seen high percentages of third-party votes in years with major third-party candidates, such as with John B. Anderson in 1980, Ross Perot in 1992 and 1996, and Gary Johnson in 2012 and 2016. Los Alamos County had the highest percentage of support for Gary Johnson in New Mexico in the 2016 election, at 13.89% (a total of 1,512 votes out of 10,885 cast).[19]
| Year | Republican | Democratic | Third party | |||
|---|---|---|---|---|---|---|
| No. | % | No. | % | No. | % | |
| 2020 | 4,278 | 34.80% | 7,554 | 61.45% | 461 | 3.75% |
| 2016 | 3,359 | 30.86% | 5,562 | 51.10% | 1,964 | 18.04% |
| 2012 | 4,796 | 45.02% | 5,191 | 48.72% | 667 | 6.26% |
| 2008 | 5,064 | 45.75% | 5,824 | 52.62% | 181 | 1.64% |
| 2004 | 5,810 | 51.89% | 5,206 | 46.49% | 181 | 1.62% |
| 2000 | 5,623 | 55.03% | 4,149 | 40.60% | 446 | 4.36% |
| 1996 | 4,999 | 50.33% | 3,983 | 40.10% | 950 | 9.57% |
| 1992 | 4,320 | 40.59% | 3,897 | 36.62% | 2,425 | 22.79% |
| 1988 | 6,622 | 65.22% | 3,275 | 32.26% | 256 | 2.52% |
| 1984 | 6,882 | 69.60% | 2,859 | 28.91% | 147 | 1.49% |
| 1980 | 5,460 | 58.19% | 2,368 | 25.24% | 1,555 | 16.57% |
| 1976 | 5,383 | 64.43% | 2,890 | 34.59% | 82 | 0.98% |
| 1972 | 5,039 | 66.09% | 2,435 | 31.94% | 150 | 1.97% |
| 1968 | 3,447 | 54.92% | 2,552 | 40.66% | 277 | 4.41% |
| 1964 | 1,895 | 33.32% | 3,767 | 66.23% | 26 | 0.46% |
| 1960 | 2,574 | 48.72% | 2,692 | 50.96% | 17 | 0.32% |
| 1956 | 2,406 | 51.98% | 2,214 | 47.83% | 9 | 0.19% |
| 1952 | 2,226 | 49.30% | 2,281 | 50.52% | 8 | 0.18% |
See also
- National Register of Historic Places listings in Los Alamos County, New Mexico
- Mesa Public Library
References
- "State & County QuickFacts". United States Census Bureau. Archived from the original on June 8, 2011. Retrieved September 29, 2013.
- "Find a County". National Association of Counties. Retrieved June 7, 2011.
- "Table 1: 2011 Poverty and Median Income Estimates – Counties". Small Area Income and Poverty Estimates. U.S. Census Bureau. 2011. Archived from the original on October 10, 2013.
- "2010 Census Gazetteer Files". United States Census Bureau. August 22, 2012. Archived from the original on January 1, 2015. Retrieved January 2, 2015.
- "Population and Housing Unit Estimates". Retrieved December 24, 2019.
- "U.S. Decennial Census". United States Census Bureau. Retrieved January 2, 2015.
- "Historical Census Browser". University of Virginia Library. Retrieved January 2, 2015.
- "Population of Counties by Decennial Census: 1900 to 1990". United States Census Bureau. Retrieved January 2, 2015.
- "Census 2000 PHC-T-4. Ranking Tables for Counties: 1990 and 2000" (PDF). United States Census Bureau. Retrieved January 2, 2015.
- "U.S. Census website". United States Census Bureau. Retrieved January 31, 2008.
- "DP-1 Profile of General Population and Housing Characteristics: 2010 Demographic Profile Data". United States Census Bureau. Archived from the original on February 13, 2020. Retrieved January 24, 2016.
- "Population, Housing Units, Area, and Density: 2010 – County". United States Census Bureau. Archived from the original on February 13, 2020. Retrieved January 24, 2016.
- "DP02 SELECTED SOCIAL CHARACTERISTICS IN THE UNITED STATES – 2006–2010 American Community Survey 5-Year Estimates". United States Census Bureau. Archived from the original on February 13, 2020. Retrieved January 24, 2016.
- "DP03 SELECTED ECONOMIC CHARACTERISTICS – 2006–2010 American Community Survey 5-Year Estimates". United States Census Bureau. Archived from the original on February 13, 2020. Retrieved January 24, 2016.
- "Los Alamos County Council". Los Alamos County Official County Web Site. losalamosnm.us. Retrieved June 9, 2017.
- "County Clerk Naomi Maestas Announces Bid for Re-Election, Changes Registration to Democrat". losalamosreporter.com. June 8, 2019. Retrieved June 11, 2020.
- "Healthiest communities ranking 2021". Us News and World Report. Retrieved July 11, 2021.
- "2020 CENSUS - SCHOOL DISTRICT REFERENCE MAP: Los Alamos County, NM" (PDF). U.S. Census Bureau. Retrieved July 13, 2022. - Text list
- electionresults.sos.state.nm.us http://electionresults.sos.state.nm.us/resultsCTY.aspx?eid=84&type=FED&rid=4067&osn=100&map=CTY. Retrieved June 11, 2020.
{{cite web}}: Missing or empty|title=(help) - Leip, David. "Dave Leip's Atlas of U.S. Presidential Elections". uselectionatlas.org. Retrieved April 1, 2018.
External links
- County website
- Los Alamos County at Curlie
- MSNBC: Where's the best place to live in America
- Los Alamos Monitor newspaper
- Los Alamos County Councilors
Places adjacent to Los Alamos County, New Mexico | ||||||||||||||||
|---|---|---|---|---|---|---|---|---|---|---|---|---|---|---|---|---|
| ||||||||||||||||
Municipalities and communities of Los Alamos County, New Mexico, United States | ||
|---|---|---|
County seat: Los Alamos | ||
| CDPs |
|  |
| ||
State of New Mexico | |
|---|---|
Santa Fe (capital) | |
| Topics |
|
| Society |
|
| Regions |
|
| Cities |
|
| Counties | |
Authority control | |
|---|---|
| General | |
| National libraries | |
| Other | |
На других языках
[de] Los Alamos County
Los Alamos County[1] ist ein County im Bundesstaat New Mexico der Vereinigten Staaten. Einzige Stadt im County und Sitz der Countyverwaltung (County Seat) ist Los Alamos.- [en] Los Alamos County, New Mexico
[ru] Лос-Аламос (округ)
Лос-А́ламос (англ. Los Alamos County) — округ в штате Нью-Мексико, США. Административный центр — Лос-Аламос. По данным переписи за 2010 год число жителей округа составляло 17 950 человек. Округ был создан в 1949 году. На территории округа находится Лос-Аламосская национальная лаборатория.Другой контент может иметь иную лицензию. Перед использованием материалов сайта WikiSort.org внимательно изучите правила лицензирования конкретных элементов наполнения сайта.
WikiSort.org - проект по пересортировке и дополнению контента Википедии