world.wikisort.org - South_Africa
Amajuba is one of the 11 districts of KwaZulu-Natal province. The seat of Amajuba is Newcastle. The majority of its 468,040 people speak Zulu (2001 Census). The district code is DC25
Amajuba
North Umzimyathi | |
|---|---|
District municipality | |
 Seal | |
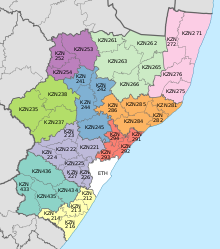
 Location of Amajuba District Municipality within KwaZulu-Natal | |
| Coordinates: 27°45′S 29°55′E | |
| Country | South Africa |
| Province | KwaZulu-Natal |
| Seat | Newcastle |
| Local municipalities | List
|
| Government | |
| • Type | Municipal council |
| • Mayor | Cllr V.V Bam |
| Area | |
| • Total | 6,911 km2 (2,668 sq mi) |
| Population (2011)[2] | |
| • Total | 499,839 |
| • Density | 72/km2 (190/sq mi) |
| Racial makeup (2011) | |
| • Black African | 93.1% |
| • Coloured | 0.7% |
| • Indian/Asian | 2.6% |
| • White | 3.4% |
| First languages (2011) | |
| • Zulu | 87.5% |
| • English | 5.2% |
| • Afrikaans | 3.1% |
| • Other | 4.2% |
| Time zone | UTC+2 (SAST) |
| Municipal code | DC25 |
Tourism
The Amajuba District is marketed as a battlefields tourism destination. Amajuba is an isiZulu name meaning “a place of doves”. The impis of King Shaka named the area Amajuba in 1825. The area is also the site of a battle in which the Boers defeated the British in 1881.
Geography

Neighbours
Amajuba is surrounded by:
- Gert Sibande in Mpumalanga to the north (DC30)
- Zululand to the east (DC26)
- Umzinyathi to the south (DC24)
- Uthukela to the south-west (DC23)
- Thabo Mofutsanyane in the Free State to the west (DC19)
Local municipalities
The district contains the following local municipalities:
| Local municipality | Population | % | Dominant language |
|---|---|---|---|
| Newcastle | 332 978 | 71.14% | Zulu |
| Dannhauser | 102 786 | 21.96% | Zulu |
| eMadlangeni | 32 276 | 6.90% | Zulu |
Demographics
The following statistics are from the 2001 census.
| Language | Population | % |
|---|---|---|
| Zulu | 418 215 | 89.35% |
| English | 19 388 | 4.14% |
| Afrikaans | 17 848 | 3.81% |
| Sotho | 6 897 | 1.47% |
| Swati | 1 715 | 0.37% |
| Xhosa | 1 598 | 0.34% |
| Other | 746 | 0.16% |
| Ndebele | 701 | 0.15% |
| Northern Sotho | 424 | 0.09% |
| Tswana | 347 | 0.07% |
| Tsonga | 103 | 0.02% |
| Venda | 58 | 0.01% |
Gender
| Gender | Population | % |
|---|---|---|
| Female | 243 891 | 52.11% |
| Male | 224 149 | 47.89% |
Ethnic group
| Ethnic group | Population | % |
|---|---|---|
| African | 431 609 | 92.22% |
| Caucasian | 21 469 | 4.59% |
| Indian/Asian | 11 928 | 2.55% |
| Coloured | 3 034 | 0.65% |
Age
| Age | Population | % |
|---|---|---|
| 000 - 004 | 52 102 | 11.13% |
| 005 - 009 | 56 841 | 12.14% |
| 010 - 014 | 56 912 | 12.16% |
| 015 - 019 | 56 815 | 12.14% |
| 020 - 024 | 45 785 | 9.78% |
| 025 - 029 | 38 031 | 8.13% |
| 030 - 034 | 30 130 | 6.44% |
| 035 - 039 | 27 487 | 5.87% |
| 040 - 044 | 25 040 | 5.35% |
| 045 - 049 | 20 881 | 4.46% |
| 050 - 054 | 16 384 | 3.50% |
| 055 - 059 | 11 858 | 2.53% |
| 060 - 064 | 10 378 | 2.22% |
| 065 - 069 | 7 285 | 1.56% |
| 070 - 074 | 5 414 | 1.16% |
| 075 - 079 | 3 107 | 0.66% |
| 080 - 084 | 2 400 | 0.51% |
| 085 - 089 | 681 | 0.15% |
| 090 - 094 | 300 | 0.06% |
| 095 - 099 | 138 | 0.03% |
| 100 plus | 71 | 0.02% |
Politics
Election results
Election results for Amajuba in the South African general election, 2004.
- Population 18 and over: 267 712 [57.20% of total population]
- Total votes: 118 344 [25.29% of total population]
- Voting % estimate: 44.21% votes as a % of population 18 and over
| Party | Votes | % |
|---|---|---|
| African National Congress | 54 142 | 45.75% |
| Inkhata Freedom Party | 42 529 | 35.94% |
| Democratic Alliance | 12 134 | 10.25% |
| African Christian Democratic Party | 2 799 | 2.37% |
| United Democratic Movement | 1 515 | 1.28% |
| Freedom Front Plus | 1 053 | 0.89% |
| New National Party | 728 | 0.62% |
| Azanian People's Organisation | 497 | 0.42% |
| Minority Front | 456 | 0.39% |
| Pan African Congress | 424 | 0.36% |
| UF | 408 | 0.34% |
| Independent Democrats | 366 | 0.31% |
| United Christian Democratic Party | 205 | 0.17% |
| NA | 173 | 0.15% |
| SOPA | 168 | 0.14% |
| PJC | 159 | 0.13% |
| CDP | 157 | 0.13% |
| TOP | 137 | 0.12% |
| EMSA | 131 | 0.11% |
| KISS | 102 | 0.09% |
| NLP | 61 | 0.05% |
| Total | 118 344 | 100.00% |
References
- "Contact list: Executive Mayors". Government Communication & Information System. Archived from the original on 14 July 2010. Retrieved 22 February 2012.
- "Statistics by place". Statistics South Africa. Retrieved 27 September 2015.
- "Statistics by place". Statistics South Africa. Retrieved 27 September 2015.
- Municipal Demarcation Board
- Stats SA Census 2001 page
- Independent Electoral Commission 2004 election results
External links
Municipalities of KwaZulu-Natal | |||||||||||||||||||||
|---|---|---|---|---|---|---|---|---|---|---|---|---|---|---|---|---|---|---|---|---|---|
| Metropolitan |
|  | |||||||||||||||||||
| District and local |
| ||||||||||||||||||||
List of municipalities in KwaZulu-Natal | |||||||||||||||||||||
На других языках
- [en] Amajuba District Municipality
[ru] Амаджуба
Амаджуба (зулу Amajuba) — район провинции Квазулу-Натал (ЮАР). Название района происходит от слова языка зулу, означающего «земля голубей» (то есть «место мира»). Административный центр — Ньюкасл. По данным переписи 2001 года большинство населения района говорит на языке зулу. Название района происходит от языка зулу, и означает «земля голубей» (то есть «место мира»).Текст в блоке "Читать" взят с сайта "Википедия" и доступен по лицензии Creative Commons Attribution-ShareAlike; в отдельных случаях могут действовать дополнительные условия.
Другой контент может иметь иную лицензию. Перед использованием материалов сайта WikiSort.org внимательно изучите правила лицензирования конкретных элементов наполнения сайта.
Другой контент может иметь иную лицензию. Перед использованием материалов сайта WikiSort.org внимательно изучите правила лицензирования конкретных элементов наполнения сайта.
2019-2025
WikiSort.org - проект по пересортировке и дополнению контента Википедии
WikiSort.org - проект по пересортировке и дополнению контента Википедии