world.wikisort.org - South_Africa
Greater Kokstad Local Municipality is an administrative area in the Harry Gwala District of KwaZulu-Natal in South Africa. Kokstad is derived from Dutch, and it means "town of Kok". It was named after Adam Kok III.[4]
Greater Kokstad | |
|---|---|
Local municipality | |
 Seal | |
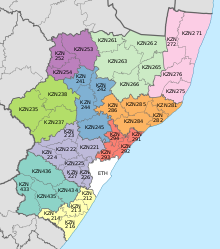
 Location in KwaZulu-Natal | |
| Coordinates: 30°33′S 29°25′E | |
| Country | South Africa |
| Province | KwaZulu-Natal |
| District | Harry Gwala District |
| Seat | Kokstad |
| Wards | 8 |
| Government | |
| • Type | Municipal council |
| • Mayor | Mbulelo Sithole |
| Area | |
| • Total | 2,680 km2 (1,030 sq mi) |
| Population (2011)[2] | |
| • Total | 65,981 |
| • Density | 25/km2 (64/sq mi) |
| Racial makeup (2011) | |
| • Black African | 87.1% |
| • Coloured | 8.2% |
| • Indian/Asian | 1.1% |
| • White | 3.3% |
| First languages (2011) | |
| • Xhosa | 70.5% |
| • English | 8.8% |
| • Zulu | 7.5% |
| • Afrikaans | 6.9% |
| • Other | 6.3% |
| Time zone | UTC+2 (SAST) |
| Municipal code | KZN433 |
Kokstad serves as the service centre and commercial hub for most of East Griqualand and nearby parts of the Eastern Cape it borders with.[5]
Main places
The 2011 census for the Greater Kokstad Local Municipality states a population of 65,981 with these most populated main places:[6]
| Place | Code | Area (km2) | Population |
|---|---|---|---|
| Greater Kokstad NU | 596002 | 2,611.04 | 9,926 |
| Kokstad | 596004 | 51.57 | 51,561 |
| Franklin | 596003 | 6.89 | 2,018 |
| Full 2011 Census Report | 596 | 2,679.82 | 65,981 |
Politics
The municipal council consists of nineteen members elected by mixed-member proportional representation. Ten councillors are elected by first-past-the-post voting in ten wards, while the remaining nine are chosen from party lists so that the total number of party representatives is proportional to the number of votes received. In the election of 1 November 2021 the African National Congress (ANC) won a majority of twelve seats on the council. The following table shows the results of the election.[7]
| Party | Ward | List | Total seats | |||||
|---|---|---|---|---|---|---|---|---|
| Votes | % | Seats | Votes | % | Seats | |||
| African National Congress | 11,886 | 59.54 | 10 | 11,888 | 59.21 | 2 | 12 | |
| Economic Freedom Fighters | 4,256 | 21.32 | 0 | 4,249 | 21.16 | 4 | 4 | |
| Democratic Alliance | 2,409 | 12.07 | 0 | 2,359 | 11.75 | 2 | 2 | |
| African Independent Congress | 293 | 1.47 | 0 | 380 | 1.89 | 1 | 1 | |
| Patriotic Alliance | 231 | 1.16 | 0 | 266 | 1.32 | 0 | 0 | |
| African Christian Democratic Party | 237 | 1.19 | 0 | 259 | 1.29 | 0 | 0 | |
| African Transformation Movement | 204 | 1.02 | 0 | 270 | 1.34 | 0 | 0 | |
| Inkatha Freedom Party | 218 | 1.09 | 0 | 232 | 1.16 | 0 | 0 | |
| United Democratic Movement | 128 | 0.64 | 0 | 150 | 0.75 | 0 | 0 | |
| Independent candidates | 71 | 0.36 | 0 | 0 | ||||
| Abantu Batho Congress | 29 | 0.15 | 0 | 26 | 0.13 | 0 | 0 | |
| Total | 19,962 | 100.00 | 10 | 20,079 | 100.00 | 9 | 19 | |
| Valid votes | 19,962 | 96.95 | 20,079 | 97.11 | ||||
| Invalid/blank votes | 629 | 3.05 | 597 | 2.89 | ||||
| Total votes | 20,591 | 100.00 | 20,676 | 100.00 | ||||
| Registered voters/turnout | 43,691 | 47.13 | 43,691 | 47.32 | ||||
References
- "Contact list: Executive Mayors". Government Communication & Information System. Archived from the original on 14 July 2010. Retrieved 22 February 2012.
- "Statistics by place". Statistics South Africa. Retrieved 27 September 2015.
- "Statistics by place". Statistics South Africa. Retrieved 27 September 2015.
- South African Languages - Place names
- KwaZulu-Natal Top Business - Umzimkhulu Municipality
- "Census 2011: Local Municipality: Greater Kokstad". census2011.adrianfrith.com. Retrieved 2020-08-14.
- "Election Result Table for LGE2021 — Greater Kokstad". wikitable.frith.dev. Retrieved 2021-12-02.
External links
Municipalities of KwaZulu-Natal | |||||||||||||||||||||
|---|---|---|---|---|---|---|---|---|---|---|---|---|---|---|---|---|---|---|---|---|---|
| Metropolitan |
|  | |||||||||||||||||||
| District and local |
| ||||||||||||||||||||
List of municipalities in KwaZulu-Natal | |||||||||||||||||||||
Другой контент может иметь иную лицензию. Перед использованием материалов сайта WikiSort.org внимательно изучите правила лицензирования конкретных элементов наполнения сайта.
WikiSort.org - проект по пересортировке и дополнению контента Википедии