world.wikisort.org - South_Africa
Ntambanana Local Municipality was a local municipality within the uThungulu District of KwaZulu-Natal in South Africa. In 2016 the municipality was dissolved and its territory divided between Mthonjaneni Local Municipality, uMhlathuze Local Municipality and uMfolozi Local Municipality.
Ntambanana | |
|---|---|
Local municipality | |
 Seal | |
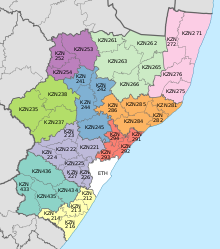
 Location in KwaZulu-Natal | |
| Coordinates: 28°35′S 31°44′E | |
| Country | South Africa |
| Province | KwaZulu-Natal |
| District | uThungulu |
| Seat | Bhucanana |
| Wards | 8 |
| Government | |
| • Type | Municipal council |
| • Mayor | Bhekuyise Justice Biyela |
| Area | |
| • Total | 1,083 km2 (418 sq mi) |
| Population (2011)[2] | |
| • Total | 74,336 |
| • Density | 69/km2 (180/sq mi) |
| Racial makeup (2011) | |
| • Black African | 99.4% |
| • Coloured | 0.2% |
| • Indian/Asian | 0.2% |
| • White | 0.2% |
| First languages (2011) | |
| • Zulu | 95.6% |
| • Southern Ndebele | 1.4% |
| • English | 1.3% |
| • Other | 1.7% |
| Time zone | UTC+2 (SAST) |
| Municipal code | KZN283 |
The municipality was named after the Ntambanana River, which passes through the municipality.[3]
The Ingonyama Trust owns 85% of the land in the former municipal area, with the remaining 15% being privately owned by commercial farmers.[4]
Main places
The 2001 census divided the municipality into the following main places:[5]
| Place | Code | Area (km2) | Population |
|---|---|---|---|
| Bhukhanana | 53901 | 22.61 | 6,348 |
| Biyela | 53902 | 508.06 | 44,698 |
| Cebekhulu | 53903 | 56.57 | 7,334 |
| Mambuka | 53904 | 66.50 | 11,755 |
| Mhlana | 53905 | 7.28 | 493 |
| Somopho | 53907 | 92.86 | 12,223 |
| Remainder of the municipality | 53906 | 330.93 | 1,918 |
Politics
The municipal council consisted of sixteen members elected by mixed-member proportional representation. Eight councillors were elected by first-past-the-post voting in eight wards, while the remaining eight were chosen from party lists so that the total number of party representatives was proportional to the number of votes received. In the election of 18 May 2011 no party obtained a majority, and the African National Congress (ANC) and the National Freedom Party (NFP) formed a coalition to govern the municipality. The following table shows the results of the election.[6][7]
| Party | Votes | Seats | ||||||
|---|---|---|---|---|---|---|---|---|
| Ward | List | Total | % | Ward | List | Total | ||
| ANC | 8,657 | 9,297 | 17,954 | 43.7 | 4 | 3 | 7 | |
| IFP | 7,468 | 7,423 | 14,891 | 36.3 | 3 | 3 | 6 | |
| NFP | 3,840 | 3,802 | 7,642 | 18.6 | 1 | 2 | 3 | |
| Independent | 584 | – | 584 | 1.4 | 0 | – | 0 | |
| Total | 20,549 | 20,522 | 41,071 | 100.0 | 8 | 8 | 16 | |
| Spoilt votes | 366 | 461 | 827 | |||||
References
- "Contact list: Executive Mayors". Government Communication & Information System. Archived from the original on 14 July 2010. Retrieved 22 February 2012.
- "Statistics by place". Statistics South Africa. Retrieved 27 September 2015.
- South African Languages - Place names
- "Home". Ntambanana Municipal Website. Retrieved 12 September 2013.
- Lookup Tables - Statistics South Africa
- "Results Summary – All Ballots: Ntambanana" (PDF). Independent Electoral Commission. Retrieved 3 December 2013.
- "Seat Calculation Detail: Ntambanana" (PDF). Independent Electoral Commission. Retrieved 3 December 2013.
External links
Municipalities of KwaZulu-Natal | |||||||||||||||||||||
|---|---|---|---|---|---|---|---|---|---|---|---|---|---|---|---|---|---|---|---|---|---|
| Metropolitan |
|  | |||||||||||||||||||
| District and local |
| ||||||||||||||||||||
List of municipalities in KwaZulu-Natal | |||||||||||||||||||||
Другой контент может иметь иную лицензию. Перед использованием материалов сайта WikiSort.org внимательно изучите правила лицензирования конкретных элементов наполнения сайта.
WikiSort.org - проект по пересортировке и дополнению контента Википедии