world.wikisort.org - Japan
Shōbara (庄原市, Shōbara-shi) is a city located in northeastern Hiroshima Prefecture, Japan. The city was founded on March 31, 1954. As of November 1, 2021, the city has an estimated population of 33,476 and a population density of 26.85 persons per km².[1] The total area is 1,246.60 km².
This article includes a list of general references, but it lacks sufficient corresponding inline citations. (May 2015) |
Shōbara
庄原市 | |
|---|---|
City | |
 Taishaku Valley | |
|
Flag Seal | |
Location of Shōbara in Hiroshima Prefecture | |
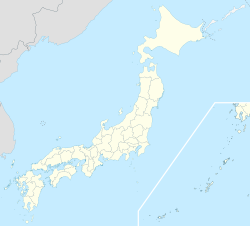 Shōbara Location in Japan | |
| Coordinates: 34°51′16″N 133°01′09″E | |
| Country | Japan |
| Region | Chūgoku (San'yō) |
| Prefecture | Hiroshima Prefecture |
| Government | |
| • Mayor | Suehiko Takiguchi (since December 2002) |
| Area | |
| • Total | 1,246.60 km2 (481.31 sq mi) |
| Population (November 1, 2021.) | |
| • Total | 33,476 |
| • Density | 27/km2 (70/sq mi) |
| Time zone | UTC+09:00 (JST) |
| City hall address | 1-10-1 Nakamoto-chō, Shōbara-shi, Hiroshima-ken 727-8501 |
| Climate | Cfa |
| Website | www |
| Symbols | |
| Flower | Sakura, Azalea |
| Tree | Pine |
On March 31, 2005, the towns of Hiwa, Kuchiwa, Saijō, Takano, and Tōjō (all from Hiba District), and the town of Sōryō (from Kōnu District) were merged into Shōbara. Hiba District and Kōnu District were both dissolved as a result of this merger.
Geography
Climate
Shōbara has a humid subtropical climate (Köppen climate classification Cfa) characterized by cool to mild winters and hot, humid summers. The average annual temperature in Shōbara is 12.7 °C (54.9 °F). The average annual rainfall is 1,488.8 mm (58.61 in) with July as the wettest month. The temperatures are highest on average in August, at around 25.0 °C (77.0 °F), and lowest in January, at around 1.0 °C (33.8 °F).[2] The highest temperature ever recorded in Shōbara was 38.1 °C (100.6 °F) on 5 August 2021; the coldest temperature ever recorded was −18.5 °C (−1.3 °F) on 26 February 1991.[3]
| Climate data for Shōbara (1991−2020 normals, extremes 1976−present) | |||||||||||||
|---|---|---|---|---|---|---|---|---|---|---|---|---|---|
| Month | Jan | Feb | Mar | Apr | May | Jun | Jul | Aug | Sep | Oct | Nov | Dec | Year |
| Record high °C (°F) | 15.6 (60.1) |
21.4 (70.5) |
24.7 (76.5) |
30.4 (86.7) |
32.8 (91.0) |
34.6 (94.3) |
37.1 (98.8) |
38.1 (100.6) |
35.6 (96.1) |
30.0 (86.0) |
25.5 (77.9) |
18.4 (65.1) |
38.1 (100.6) |
| Average high °C (°F) | 6.0 (42.8) |
7.8 (46.0) |
12.6 (54.7) |
19.1 (66.4) |
23.7 (74.7) |
26.3 (79.3) |
29.7 (85.5) |
31.2 (88.2) |
26.8 (80.2) |
21.0 (69.8) |
14.8 (58.6) |
8.3 (46.9) |
18.9 (66.1) |
| Daily mean °C (°F) | 1.0 (33.8) |
2.0 (35.6) |
5.6 (42.1) |
11.4 (52.5) |
16.4 (61.5) |
20.3 (68.5) |
24.2 (75.6) |
25.0 (77.0) |
20.6 (69.1) |
14.2 (57.6) |
8.2 (46.8) |
3.0 (37.4) |
12.7 (54.8) |
| Average low °C (°F) | −2.6 (27.3) |
−2.5 (27.5) |
−0.2 (31.6) |
4.4 (39.9) |
9.8 (49.6) |
15.4 (59.7) |
20.2 (68.4) |
20.7 (69.3) |
16.1 (61.0) |
9.2 (48.6) |
3.3 (37.9) |
−0.8 (30.6) |
7.8 (46.0) |
| Record low °C (°F) | −11.7 (10.9) |
−13.8 (7.2) |
−8.5 (16.7) |
−4.8 (23.4) |
−1.5 (29.3) |
5.1 (41.2) |
9.1 (48.4) |
12.4 (54.3) |
3.5 (38.3) |
−1.0 (30.2) |
−4.2 (24.4) |
−10.1 (13.8) |
−13.8 (7.2) |
| Average precipitation mm (inches) | 71.2 (2.80) |
71.9 (2.83) |
101.4 (3.99) |
105.5 (4.15) |
140.5 (5.53) |
187.5 (7.38) |
249.9 (9.84) |
147.6 (5.81) |
164.8 (6.49) |
96.2 (3.79) |
68.9 (2.71) |
83.6 (3.29) |
1,488.8 (58.61) |
| Average precipitation days (≥ 1.0 mm) | 12.5 | 11.2 | 11.6 | 9.9 | 10.0 | 11.7 | 12.5 | 9.9 | 10.1 | 7.9 | 8.9 | 12.7 | 128.9 |
| Mean monthly sunshine hours | 89.2 | 106.1 | 154.8 | 181.4 | 196.0 | 139.8 | 147.1 | 180.8 | 143.7 | 153.3 | 124.9 | 93.5 | 1,718.9 |
| Source: Japan Meteorological Agency[2][3] | |||||||||||||
| Climate data for Takano, Shōbara (1991−2020 normals, extremes 1978−present) | |||||||||||||
|---|---|---|---|---|---|---|---|---|---|---|---|---|---|
| Month | Jan | Feb | Mar | Apr | May | Jun | Jul | Aug | Sep | Oct | Nov | Dec | Year |
| Record high °C (°F) | 13.0 (55.4) |
18.4 (65.1) |
22.2 (72.0) |
27.8 (82.0) |
30.5 (86.9) |
32.2 (90.0) |
34.0 (93.2) |
34.3 (93.7) |
31.8 (89.2) |
27.7 (81.9) |
23.6 (74.5) |
17.6 (63.7) |
34.3 (93.7) |
| Average high °C (°F) | 3.4 (38.1) |
4.7 (40.5) |
9.4 (48.9) |
16.3 (61.3) |
21.2 (70.2) |
24.0 (75.2) |
27.3 (81.1) |
28.6 (83.5) |
24.2 (75.6) |
18.7 (65.7) |
12.8 (55.0) |
6.3 (43.3) |
16.4 (61.5) |
| Daily mean °C (°F) | −0.5 (31.1) |
−0.1 (31.8) |
3.5 (38.3) |
9.3 (48.7) |
14.5 (58.1) |
18.5 (65.3) |
22.5 (72.5) |
23.1 (73.6) |
18.8 (65.8) |
12.5 (54.5) |
6.9 (44.4) |
1.7 (35.1) |
10.9 (51.6) |
| Average low °C (°F) | −4.4 (24.1) |
−4.7 (23.5) |
−2.1 (28.2) |
2.3 (36.1) |
7.8 (46.0) |
13.6 (56.5) |
18.6 (65.5) |
18.9 (66.0) |
14.3 (57.7) |
7.2 (45.0) |
1.7 (35.1) |
−2.2 (28.0) |
5.9 (42.6) |
| Record low °C (°F) | −17.0 (1.4) |
−18.5 (−1.3) |
−14.9 (5.2) |
−8.5 (16.7) |
−3.6 (25.5) |
2.4 (36.3) |
5.3 (41.5) |
8.9 (48.0) |
0.1 (32.2) |
−3.2 (26.2) |
−6.4 (20.5) |
−15.4 (4.3) |
−18.5 (−1.3) |
| Average precipitation mm (inches) | 147.9 (5.82) |
128.0 (5.04) |
150.9 (5.94) |
134.4 (5.29) |
156.9 (6.18) |
211.3 (8.32) |
294.5 (11.59) |
170.1 (6.70) |
189.6 (7.46) |
125.9 (4.96) |
104.5 (4.11) |
158.0 (6.22) |
1,969.4 (77.54) |
| Average snowfall cm (inches) | 208 (82) |
163 (64) |
77 (30) |
3 (1.2) |
0 (0) |
0 (0) |
0 (0) |
0 (0) |
0 (0) |
0 (0) |
6 (2.4) |
118 (46) |
578 (228) |
| Average precipitation days (≥ 1.0 mm) | 19.0 | 16.1 | 14.8 | 11.5 | 10.6 | 12.6 | 13.5 | 11.3 | 11.6 | 9.7 | 12.3 | 17.9 | 160.9 |
| Average snowy days (≥ 3 cm) | 16.2 | 14.5 | 8.5 | 0.3 | 0 | 0 | 0 | 0 | 0 | 0 | 0.5 | 9.1 | 49.1 |
| Mean monthly sunshine hours | 51.3 | 66.3 | 128.4 | 178.1 | 196.7 | 140.5 | 134.1 | 160.3 | 128.2 | 143.7 | 108.3 | 69.7 | 1,504.1 |
| Source: Japan Meteorological Agency[4][5] | |||||||||||||
Demographics
Per Japanese census data, the population of Shōbara in 2020 is 33,633 people.[6] Shōbara has been conducting censuses since 1920.
| Year | Pop. | ±% |
|---|---|---|
| 1950 | 90,957 | — |
| 1955 | 88,748 | −2.4% |
| 1960 | 81,162 | −8.5% |
| 1965 | 67,983 | −16.2% |
| 1970 | 60,072 | −11.6% |
| 1975 | 56,336 | −6.2% |
| 1980 | 53,506 | −5.0% |
| 1985 | 52,157 | −2.5% |
| 1990 | 50,624 | −2.9% |
| 1995 | 48,539 | −4.1% |
| 2000 | 45,678 | −5.9% |
| 2005 | 43,149 | −5.5% |
| 2010 | 40,255 | −6.7% |
| 2015 | 37,000 | −8.1% |
| 2020 | 33,633 | −9.1% |
| Shōbara population statistics[6] | ||
References
- "Official website of Shōbara City" (in Japanese). Japan: Shōbara City. Retrieved 17 May 2017.
- 気象庁 / 平年値(年・月ごとの値). JMA. Retrieved May 16, 2022.
- 観測史上1~10位の値(年間を通じての値). JMA. Retrieved May 16, 2022.
- 気象庁 / 平年値(年・月ごとの値). JMA. Retrieved May 16, 2022.
- 観測史上1~10位の値(年間を通じての値). JMA. Retrieved May 16, 2022.
- Shōbara population statistics
External links
| Wikimedia Commons has media related to Shōbara, Hiroshima. |
- Shōbara City official website (in Japanese) (Translate to English: Google, Bing, Yandex)
Hiroshima (capital) | |||
| Hiroshima |
| ||
| Core cities |
| ||
| Cities | |||
| Districts |
| ||
List of mergers in Hiroshima Prefecture | |||
This Hiroshima Prefecture location article is a stub. You can help Wikipedia by expanding it. |
На других языках
[de] Shōbara
Shōbara (jap. .mw-parser-output .Hani{font-size:110%}庄原市) ist eine Stadt in der Präfektur Hiroshima in Japan.- [en] Shōbara, Hiroshima
[ru] Сёбара
Сё́бара[1] (яп. 庄原市 Сё:бара-си) — город в Японии, находящийся в префектуре Хиросима. Площадь города составляет 1246,60 км²[2], население — 37 735 человек (1 июля 2014)[3], плотность населения — 30,27 чел./км².Другой контент может иметь иную лицензию. Перед использованием материалов сайта WikiSort.org внимательно изучите правила лицензирования конкретных элементов наполнения сайта.
WikiSort.org - проект по пересортировке и дополнению контента Википедии