world.wikisort.org - Canada
Simcoe North is a provincial electoral district in Ontario, Canada. It was established as a provincial riding in 1996. Its population was 119,401 in 2006.
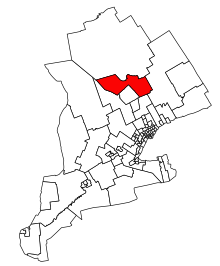 Simcoe North in relation to southern Ontario ridings | |||
| Provincial electoral district | |||
| Legislature | Legislative Assembly of Ontario | ||
| MPP |
Progressive Conservative | ||
| District created | 1996 | ||
| First contested | 1999 | ||
| Last contested | 2022 | ||
| Demographics | |||
| Population (2016) | 111,335 | ||
| Electors (2018) | 92,450 | ||
| Area (km²) | 3,143 | ||
| Pop. density (per km²) | 35.4 | ||
| Census division(s) | Simcoe County | ||
| Census subdivision(s) | Midland, Orillia, Penetanguishene, Tay, Tiny, Christian Island, Severn, Ramara, Oro-Medonte, Mnjikaning First Nation | ||
Demographics
Ethnic groups: 88.5% White, 9.0% Aboriginal
Languages: 90.5% English, 3.8% French, 1.4% German
Religions: 71.7% Christian (28.5% Catholic, 13.0% United Church, 10.1% Anglican, 5.6% Presbyterian, 2.9% Baptist, 1.2% Lutheran, 1.0% Pentecostal, 9.4% Other Christian), 26.9% None.
Median income: $28,718 (2010)
Average income: $37,989 (2010)
Geography
The district includes all of the north and eastern parts of Simcoe County. The major municipalities include Midland, Orillia, Penetanguishene, Tay, Tiny, Christian Island, Severn, Ramara, Oro-Medonte and Mnjikaning First Nation The area is 2,381 km2.
Members of Provincial Parliament
| Simcoe North | ||||
|---|---|---|---|---|
| Assembly | Years | Member | Party | |
| Riding created | ||||
| 1st | 1867–1871 | William Lount | Liberal | |
| 2nd | 1871–1874 | William Davis Ardagh | Conservative | |
| Riding dissolved | ||||
| Riding created from Simcoe East and Muskoka–Georgian Bay | ||||
| 37th | 1999–2003 | Garfield Dunlop | Progressive Conservative | |
| 38th | 2003–2007 | |||
| 39th | 2007–2011 | |||
| 40th | 2011–2014 | |||
| 41st | 2014–2015 | |||
| 2015–2018 | Patrick Brown | |||
| 2018–2018 | Independent | |||
| 42nd | 2018–2022 | Jill Dunlop | Progressive Conservative | |
| 43rd | 2022–present | |||
| Sourced from the Ontario Legislative Assembly[3] | ||||
Election results
| 2022 Ontario general election | ||||||||
|---|---|---|---|---|---|---|---|---|
| Party | Candidate | Votes | % | ±% | ||||
| Progressive Conservative | Jill Dunlop | 23,041 | 49.80 | +2.88 | ||||
| New Democratic | Elizabeth Van Houtte | 8,208 | 17.74 | -10.29 | ||||
| Liberal | Aaron Cayden Hiltz | 8,070 | 17.44 | -0.26 | ||||
| Green | Krystal Brooks | 4,071 | 8.80 | +2.05 | ||||
| New Blue | Mark Douris | 1,438 | 3.11 | |||||
| Ontario Party | Aaron Macdonald | 1,119 | 2.42 | |||||
| Libertarian | William Joslin | 318 | 0.69 | |||||
| Total valid votes | 46,265 | |||||||
| Total rejected, unmarked and declined ballots | 228 | |||||||
| Turnout | ||||||||
| Eligible voters | ||||||||
| Progressive Conservative hold | Swing | +6.59 | ||||||
| Source: Elections Ontario[4] | ||||||||
| 2018 Ontario general election | ||||||||
|---|---|---|---|---|---|---|---|---|
| Party | Candidate | Votes | % | ±% | ||||
| Progressive Conservative | Jill Dunlop | 25,236 | 46.92 | +2.98 | ||||
| New Democratic | Elizabeth Van Houtte | 15,078 | 28.03 | +12.48 | ||||
| Liberal | Gerry Marshall | 9,523 | 17.70 | -14.82 | ||||
| Green | Valerie Powell | 3,632 | 6.75 | -1.24 | ||||
| Libertarian | Cynthia Sneath | 320 | 0.59 | |||||
| Total valid votes | 53,789 | 100.0 | ||||||
| Progressive Conservative gain from Independent | Swing | -8.97 | ||||||
| Source: Elections Ontario[5] | ||||||||
| Ontario provincial by-election, September 3, 2015 Resignation of Garfield Dunlop | ||||||||
|---|---|---|---|---|---|---|---|---|
| Party | Candidate | Votes | % | ±% | Expenditures | |||
| Progressive Conservative | Patrick Brown | 21,095 | 53.68 | +9.74 | $117,157.00 | |||
| Liberal | Fred Larsen | 9,281 | 23.62 | –8.90 | $94,892.00 | |||
| New Democratic | Elizabeth Van Houtte | 6,637 | 16.89 | +1.34 | $54,795.23 | |||
| Green | Valerie Powell | 1,791 | 4.56 | –3.43 | $183.33 | |||
| New Reform | James Gault | 200 | 0.51 | – | – | |||
| People's Political Party | Kevin Clarke | 146 | 0.37 | – | – | |||
| Libertarian | Darren Roskam | 104 | 0.26 | – | – | |||
| Pauper | John Turmel | 47 | 0.12 | – | – | |||
| Total valid votes | 39,301 | 100.0 | ||||||
| Total rejected, unmarked and declined ballots | 170 | 0.43 | ||||||
| Turnout | 39,471 | 40.71 | ||||||
| Eligible voters | 96,950 | |||||||
| Progressive Conservative hold | Swing | +9.32 | ||||||
Source(s)
Elections Ontario (2015). "Official Returns from the Records, 086 Simcoe North" (PDF). Retrieved 17 November 2015. | ||||||||
| 2014 Ontario general election | ||||||||
|---|---|---|---|---|---|---|---|---|
| Party | Candidate | Votes | % | ±% | ||||
| Progressive Conservative | Garfield Dunlop | 22,179 | 43.94 | -11.22 | ||||
| Liberal | Fred Larsen | 16,412 | 32.52 | +10.11 | ||||
| New Democratic | Doris Middleton | 7,846 | 15.55 | -1.41 | ||||
| Green | Peter Stubbins | 4,013 | 7.99 | +2.52 | ||||
| Total valid votes | 50,451 | 100.00 | ||||||
| Progressive Conservative hold | Swing | -10.67 | ||||||
| Source: Elections Ontario[6] | ||||||||
| 2011 Ontario general election | ||||||||
|---|---|---|---|---|---|---|---|---|
| Party | Candidate | Votes | % | ±% | ||||
| Progressive Conservative | Garfield Dunlop | 25,081 | 55.16 | +5.34 | ||||
| Liberal | Fred Larsen | 10,191 | 22.41 | -8.13 | ||||
| New Democratic | Doris Middleton | 7,710 | 16.96 | +7.77 | ||||
| Green | Peter Stubbins | 2,488 | 5.47 | -4.74 | ||||
| Total valid votes | 45,470 | 100.00 | ||||||
| Total rejected, unmarked and declined ballots | 142 | 0.31 | ||||||
| Turnout | 45,612 | 50.98 | ||||||
| Eligible voters | 89,474 | |||||||
| Progressive Conservative hold | Swing | +6.74 | ||||||
| Source: Elections Ontario[7] | ||||||||
| 2007 Ontario general election | ||||||||
|---|---|---|---|---|---|---|---|---|
| Party | Candidate | Votes | % | ±% | ||||
| Progressive Conservative | Garfield Dunlop | 22,986 | 49.82 | +3.69 | ||||
| Liberal | Laura Domsy | 14,094 | 30.54 | -8.33 | ||||
| Green | Wayne Varcoe | 4,709 | 10.21 | +7.17 | ||||
| New Democratic | Andrew Hill | 4,240 | 9.19 | -1.68 | ||||
| Libertarian | Dane-Train Reybould | 112 | 0.24 | |||||
| Total valid votes | 46,141 | 100.00 | ||||||
| Progressive Conservative hold | Swing | +12.02 | ||||||
| 2003 Ontario general election | ||||||||
|---|---|---|---|---|---|---|---|---|
| Party | Candidate | Votes | % | ±% | ||||
| Progressive Conservative | Garfield Dunlop | 23,393 | 46.13 | -7.02 | ||||
| Liberal | Paul Sloan | 19,713 | 38.87 | -0.16 | ||||
| New Democratic | John Niddery | 5,515 | 10.87 | +4.95 | ||||
| Green | Nina Pruesse | 1,540 | 3.04 | +1.75 | ||||
| Family Coalition | Blaine Scott | 453 | 0.89 | |||||
| Independent | Karnail Singh | 101 | 0.2 | |||||
| Total valid votes | 50,715 | 100.0 | ||||||
| Progressive Conservative hold | Swing | -3.43 | ||||||
| 1999 Ontario general election | ||||||||
|---|---|---|---|---|---|---|---|---|
| Party | Candidate | Votes | % | |||||
| Progressive Conservative | Garfield Dunlop | 26,160 | 53.15 | |||||
| Liberal | George J. Macdonald | 19,209 | 39.03 | |||||
| New Democratic | Ann Billings | 2,913 | 5.92 | |||||
| Green | Harry Promm | 633 | 1.29 | |||||
| Natural Law | William Robert Ayling | 305 | 0.62 | |||||
| Total valid votes | 49,220 | 100.0 | ||||||
2007 electoral reform referendum
| 2007 Ontario electoral reform referendum | |||
|---|---|---|---|
| Side | Votes | % | |
| First Past the Post | 28,215 | 62.6 | |
| Mixed member proportional | 16,883 | 37.4 | |
| Total valid votes | 45,098 | 100.0 | |
Sources
- "National Household Survey (NHS) Profile, 2011". 8 May 2013.
- "National Household Survey (NHS) Profile, 2011". 8 May 2013.
- For a listing of each MPP's Queen's Park curriculum vitae see below:
- For William Lount's Legislative Assembly information see "William Lount, MPP". Parliamentary History. Toronto: Legislative Assembly of Ontario. 2017.
- For William Davis Ardagh's Legislative Assembly information see "William Davis Ardagh, MPP". Parliamentary History. Toronto: Legislative Assembly of Ontario. 2017.
- For Garfield Dunlop's Legislative Assembly information see "Garfield Dunlop, MPP". Parliamentary History. Toronto: Legislative Assembly of Ontario. 2017.
- For Patrick Brown's Legislative Assembly information see "Patrick Brown, MPP". Parliamentary History. Toronto: Legislative Assembly of Ontario. 2017.
- "Candidates in: Simcoe North (100)". Elections Ontario. Retrieved May 6, 2022.
- "Summary of Valid Votes Cast for each Candidate" (PDF). Elections Ontario. p. 10. Retrieved 20 January 2019.
- Elections Ontario. "General Election Results by District, 086 Simcoe North". Retrieved 13 June 2014.
- Elections Ontario (2011). "Official return from the records / Rapport des registres officiels - Simcoe North" (PDF). Retrieved 2 June 2014.
Текст в блоке "Читать" взят с сайта "Википедия" и доступен по лицензии Creative Commons Attribution-ShareAlike; в отдельных случаях могут действовать дополнительные условия.
Другой контент может иметь иную лицензию. Перед использованием материалов сайта WikiSort.org внимательно изучите правила лицензирования конкретных элементов наполнения сайта.
Другой контент может иметь иную лицензию. Перед использованием материалов сайта WikiSort.org внимательно изучите правила лицензирования конкретных элементов наполнения сайта.
2019-2026
WikiSort.org - проект по пересортировке и дополнению контента Википедии
WikiSort.org - проект по пересортировке и дополнению контента Википедии