world.wikisort.org - Canada
Haldimand—Norfolk is a provincial electoral district in southwestern Ontario, Canada. It was created for the 2007 provincial election. 88.0% of the riding came from Haldimand—Norfolk—Brant while 12.0% came from Erie—Lincoln.
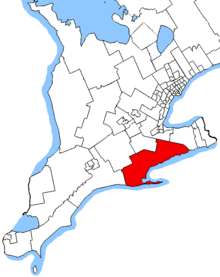 Haldimand—Norfolk in relation to other southwestern Ontario electoral districts | |||
| Provincial electoral district | |||
| Legislature | Legislative Assembly of Ontario | ||
| MPP |
Independent | ||
| District created | 1996 | ||
| First contested | 1999 | ||
| Last contested | 2022 | ||
| Demographics | |||
| Population (2016) | 109,655 | ||
| Electors (2018) | 86,342 | ||
| Area (km²) | 4,337 | ||
| Pop. density (per km²) | 25.3 | ||
| Census division(s) | Haldimand-Norfolk | ||
| Census subdivision(s) | Haldimand, Norfolk | ||
The riding includes all of the counties of Haldimand and Norfolk except those parts of Haldimand found in the Six Nations and New Credit Indian Reserves.
The riding also existed from 1934 to 1987.
Members of Provincial Parliament
| Norfolk/Haldimand—Norfolk | ||||
|---|---|---|---|---|
| Assembly | Years | Member | Party | |
| Norfolk North and Norfolk South combined to form Norfolk | ||||
| 17th | 1926–1929 | John Strickler Martin | Conservative | |
| 18th | 1929–1931 | |||
| 1931–1934 | Arthur Campbell Burt | |||
| Haldimand and Norfolk combined to form Haldimand—Norfolk | ||||
| 19th | 1934–1937 | Richard Colter | Liberal | |
| 20th | 1937–1943 | Eric Cross | ||
| 21st | 1943–1944 | William Walsh | Progressive Conservative | |
| 1944–1945 | Charles Martin | |||
| 22nd | 1945–1948 | |||
| 23rd | 1948–1951 | |||
| 24th | 1951–1955 | James Allan | ||
| 25th | 1955–1959 | |||
| 26th | 1959–1963 | |||
| 27th | 1963–1967 | |||
| 28th | 1967–1971 | |||
| 29th | 1971–1975 | |||
| 30th | 1975–1977 | Gord Miller | Liberal | |
| 31st | 1977–1981 | |||
| 32nd | 1981–1985 | |||
| 33rd | 1985–1987 | |||
| Riding renamed to Norfolk | ||||
| 34th | 1987–1990 | Gord Miller | Liberal | |
| 35th | 1990–1995 | Norm Jamison | New Democratic | |
| 36th | 1995–1999 | Toby Barrett | Progressive Conservative | |
| Riding renamed to Haldimand—Norfolk—Brant | ||||
| 37th | 1999–2003 | Toby Barrett | Progressive Conservative | |
| 38th | 2003–2007 | |||
| Riding renamed to Haldimand—Norfolk | ||||
| 39th | 2007–2011 | Toby Barrett | Progressive Conservative | |
| 40th | 2011–2014 | |||
| 41st | 2014–2018 | |||
| 42nd | 2018–2022 | |||
| 43rd | 2022–present | Bobbi Ann Brady | Independent | |
Election results
| 2022 Ontario general election | ||||||||
|---|---|---|---|---|---|---|---|---|
| ** Preliminary results — Not yet official ** | ||||||||
| Party | Candidate | Votes | % | ±% | ||||
| Independent | Bobbi Ann Brady | 15,921 | 35.05 | |||||
| Progressive Conservative | Ken Hewitt | 13,851 | 30.49 | -26.61 | ||||
| New Democratic | Sarah Lowe | 6,311 | 13.89 | -13.01 | ||||
| Liberal | Aziz Chouhdery | 3,329 | 7.33 | -1.87 | ||||
| Ontario Party | Sheldon Simpson | 2,353 | 5.18 | |||||
| Green | Erik Cloverdale | 1,841 | 4.05 | -0.09 | ||||
| New Blue | Nate Hawkins | 1,454 | 3.20 | |||||
| Freedom | Thecla Ross | 268 | 0.59 | +0.27 | ||||
| Independent | George McMorrow | 99 | 0.22 | |||||
| Total valid votes | 45,427 | |||||||
| Total rejected, unmarked and declined ballots | ||||||||
| Turnout | 48.58 | -10.62 | ||||||
| Eligible voters | 93,511 | |||||||
| Independent gain from Progressive Conservative | Swing | +30.83 | ||||||
| Source: Elections Ontario[1] | ||||||||
| 2018 Ontario general election | ||||||||
|---|---|---|---|---|---|---|---|---|
| Party | Candidate | Votes | % | ±% | ||||
| Progressive Conservative | Toby Barrett | 28,889 | 57.10 | +4.88 | ||||
| New Democratic | Danielle Du Sablon | 13,609 | 26.90 | +3.74 | ||||
| Liberal | Dan Matten | 4,656 | 9.20 | -10.51 | ||||
| Green | Anne Faulkner | 2,095 | 4.14 | -0.76 | ||||
| None of the Above | Dan Preston | 817 | 1.61 | |||||
| Libertarian | Christopher Rosser | 251 | 0.50 | |||||
| Freedom | Thecla Ross | 160 | 0.32 | |||||
| Multicultural | Wasyl Ivan Luczkiw | 64 | 0.13 | |||||
| Pauper | Carolyn Ritchie | 52 | 0.10 | |||||
| Total valid votes | 50,593 | 98.97 | ||||||
| Total rejected, unmarked and declined ballots | 524 | 1.03 | -2.21 | |||||
| Turnout | 51,117 | 59.20 | +5.23 | |||||
| Eligible voters | 86,342 | |||||||
| Progressive Conservative hold | Swing | +0.57 | ||||||
| Source: Elections Ontario[2] | ||||||||
| 2014 Ontario general election | ||||||||
|---|---|---|---|---|---|---|---|---|
| Party | Candidate | Votes | % | ±% | ||||
| Progressive Conservative | Toby Barrett | 22,066 | 52.22 | -8.59 | ||||
| New Democratic | Ian Nichols | 9,786 | 23.16 | +3.74 | ||||
| Liberal | Karen Robinson | 8,331 | 19.72 | +2.62 | ||||
| Green | Anne Faulkner | 2,071 | 4.90 | +2.81 | ||||
| Total valid votes | 42,254 | 96.76 | ||||||
| Total rejected, unmarked and declined ballots | 1,414 | 3.24 | ||||||
| Turnout | 43,668 | 53.97 | ||||||
| Eligible voters | 80,907 | |||||||
| Progressive Conservative hold | Swing | -6.16 | ||||||
| Source: Elections Ontario[3] | ||||||||
| 2011 Ontario general election | ||||||||
|---|---|---|---|---|---|---|---|---|
| Party | Candidate | Votes | % | ±% | ||||
| Progressive Conservative | Toby Barrett | 25,203 | 60.81 | -0.13 | ||||
| New Democratic | Ian Nichols | 8,048 | 19.42 | +8.88 | ||||
| Liberal | Greg Crone | 7,087 | 17.10 | -5.15 | ||||
| Green | Justin Blake | 868 | 2.09 | -3.11 | ||||
| Family Coalition | John G. Gots | 242 | 0.58 | -0.49 | ||||
| Total valid votes | 41,448 | 100.0 | ||||||
| Total rejected, unmarked and declined ballots | 148 | 0.36 | ||||||
| Turnout | 41,596 | 53.31 | ||||||
| Eligible voters | 78,030 | |||||||
| Progressive Conservative hold | Swing | -4.51 | ||||||
| Source: Elections Ontario[4] | ||||||||
| 2007 Ontario general election | ||||||||
|---|---|---|---|---|---|---|---|---|
| Party | Candidate | Votes | % | |||||
| Progressive Conservative | Toby Barrett | 26,105 | 60.94 | |||||
| Liberal | Lorraine Bergstrand | 9,534 | 22.25 | |||||
| New Democratic | Jan Watson | 4,515 | 10.54 | |||||
| Green | Chad Squizzato | 2,229 | 5.20 | |||||
| Family Coalition | Steven Elgersma | 457 | 1.07 | |||||
| Total valid votes | 42,840 | 100.0 | ||||||
2007 electoral reform referendum
| 2007 Ontario electoral reform referendum | |||
|---|---|---|---|
| Side | Votes | % | |
| First Past the Post | 28,566 | 68.6 | |
| Mixed member proportional | 13,064 | 31.4 | |
| Total valid votes | 41,630 | 100.0 | |
Sources
References
- "Candidates in: Haldimand—Norfolk (034)". Elections Ontario. Retrieved May 19, 2022.
- "Summary of Valid Votes Cast for each Candidate" (PDF). Elections Ontario. Retrieved 16 January 2019.
- Elections Ontario (2014). "Official result from the records, 028 Haldimand-Norfolk" (PDF). Retrieved 27 June 2015.[permanent dead link]
- Elections Ontario (2011). "Official return from the records / Rapport des registres officiels - Haldimand—Norfolk" (PDF). Retrieved 2 June 2014.[permanent dead link]
This Ontario-related article is a stub. You can help Wikipedia by expanding it. |
Текст в блоке "Читать" взят с сайта "Википедия" и доступен по лицензии Creative Commons Attribution-ShareAlike; в отдельных случаях могут действовать дополнительные условия.
Другой контент может иметь иную лицензию. Перед использованием материалов сайта WikiSort.org внимательно изучите правила лицензирования конкретных элементов наполнения сайта.
Другой контент может иметь иную лицензию. Перед использованием материалов сайта WikiSort.org внимательно изучите правила лицензирования конкретных элементов наполнения сайта.
2019-2025
WikiSort.org - проект по пересортировке и дополнению контента Википедии
WikiSort.org - проект по пересортировке и дополнению контента Википедии