world.wikisort.org - CanadaOxford is a provincial electoral district in Ontario, Canada, that has been represented in the Legislative Assembly of Ontario since the 1999 provincial election.
Provincial electoral district in Ontario, Canada
Oxford Ontario electoral district Ontario electoral district |
|---|
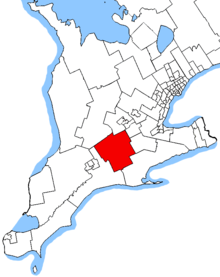 Oxford in relation to the southern Ontario ridings |
|
| Legislature | Legislative Assembly of Ontario |
|---|
| MPP | Ernie Hardeman
Progressive Conservative |
|---|
| District created | 1999 |
|---|
| First contested | 1999 |
|---|
| Last contested | 2022 |
|---|
|
| Population (2016) | 113,790 |
|---|
| Electors (2018) | 89,597 |
|---|
| Area (km²) | 2,270 |
|---|
| Pop. density (per km²) | 50.1 |
|---|
| Census division(s) | Oxford County |
|---|
| Census subdivision(s) | Woodstock, Tillsonburg, Ingersoll, Norwich, Zorra, South-West Oxford, East Zorra – Tavistock, Blandford-Blenheim |
|---|
It consists of the county of Oxford and a small portion of Brant.
Members of Provincial Parliament
| Oxford |
|---|
| Assembly |
Years |
Member |
Party |
| Created from Oxford North and Oxford South ridings in 1934 |
| 19th |
1934–1937 | | Patrick Dewan | Liberal |
| 20th |
1937–1943 |
| 21st |
1943–1945 | | Thomas Roy Dent | Progressive Conservative |
| 22nd |
1945–1948 |
| 23rd |
1948–1951 |
| 24th |
1951–1955 |
| 25th |
1955–1959 | | Gord Innes | Liberal |
| 26th |
1959–1963 |
| 27th |
1963–1967 | | Gord Pittock | Progressive Conservative |
| 28th |
1967–1971 | | Gord Innes | Liberal |
| 29th |
1971–1975 | | Harry Parrott | Progressive Conservative |
| 30th |
1975–1977 |
| 31st |
1977–1981 |
| 32nd |
1981–1985 | | Dick Treleaven | Progressive Conservative |
| 33rd |
1985–1987 |
| 34th |
1987–1990 | | Charlie Tatham | Liberal |
| 35th |
1990–1995 | | Kimble Sutherland | New Democratic |
| 36th |
1995–1999 | | Ernie Hardeman | Progressive Conservative |
| 37th |
1999–2003 |
| 38th |
2003–2007 |
| 39th |
2007–2011 |
| 40th |
2011–2014 |
| 41st |
2014–2018 |
| 42nd |
2018–2022 |
| 43rd |
2022–present |
Election results
| 2022 Ontario general election |
| Party |
Candidate |
Votes | % | |
|
Progressive Conservative | Ernie Hardeman | 22,166 | 50.01 | -5.72 |
|
New Democratic | Lindsay Wilson | 9,504 | 21.44 | -8.99 |
|
Liberal | Mary Holmes | 5,457 | 12.31 | +5.39 |
|
Ontario Party | Karl Toews | 3,579 | 8.08 | |
|
Green | Cheryle Baker | 2,097 | 4.73 | +0.42 |
|
New Blue | Connie Oldenburger | 1,518 | 3.43 | |
| Total valid votes |
44,321 |
| Total rejected, unmarked and declined ballots |
240 |
| Turnout |
|
| Eligible voters |
|
|
Progressive Conservative hold |
Swing |
+1.64 |
| Source: Elections Ontario[1] |
| 2018 Ontario general election |
| Party |
Candidate |
Votes | % | |
|
Progressive Conservative | Ernie Hardeman | 29,152 | 55.73 | +9.49 |
|
New Democratic | Tara King | 15,917 | 30.43 | +4.66 |
|
Liberal | James Howard | 3,620 | 6.92 | -14.41 |
|
Green | Albert De Jong | 2,254 | 4.31 | -0.53 |
|
Ontario Party | Robert Van Ryswyck | 447 | 0.85 | |
|
Libertarian | Chris Swift | 370 | 0.71 | -0.18 |
|
Independent | David Sikal | 335 | 0.64 | |
|
Freedom | Tim Hodges | 216 | 0.41 | -0.53 |
| Total valid votes |
52,311 | 100.0 |
| Total rejected, unmarked and declined ballots |
|
| Turnout |
| 60.20 |
| Eligible voters |
86,877 |
|
Progressive Conservative hold |
Swing |
+2.42 |
| Source: Elections Ontario[2] |
| 2014 Ontario general election |
| Party |
Candidate |
Votes | % | |
|
Progressive Conservative | Ernie Hardeman | 18,958 | 46.24 | -8.63 |
|
New Democratic | Bryan Smith | 10,573 | 25.79 | +10.14 |
|
Liberal | Dan Moulton | 8,736 | 21.31 | -3.66 |
|
Green | Mike Farlow | 1,985 | 4.84 | +1.29 |
|
Freedom | Tim Hodges | 384 | 0.94 | |
|
Libertarian | Devin Wright | 365 | 0.89 | |
| Total valid votes |
41001 | 100.00 |
|
Progressive Conservative hold |
Swing |
-9.39 |
| Source: Elections Ontario[3] |
| 2011 Ontario general election |
| Party |
Candidate |
Votes | % | |
|
Progressive Conservative | Ernie Hardeman | 20,658 | 54.87 | +7.60 |
|
Liberal | David Hilderley | 9,410 | 24.99 | -4.34 |
|
New Democratic | Dorothy Marie Eisen | 5,885 | 15.63 | +4.28 |
|
Green | Catherine Stewart-Mott | 1,336 | 3.55 | -5.26 |
|
Family Coalition | Leonard Vanderhoeven | 359 | 0.95 | -0.60 |
| Total valid votes |
37,648 | 100.0 |
| Total rejected, unmarked and declined ballots |
123 | 0.33 |
| Turnout |
37,771 | 49.18 |
| Eligible voters |
76,804 |
|
Progressive Conservative hold |
Swing |
+5.97 |
| Source: Elections Ontario[4] |
| 2007 Ontario general election |
| Party |
Candidate |
Votes | % | |
|
Progressive Conservative | Ernie Hardeman | 18,445 | 47.27 | +3.21 |
|
Liberal | Brian Jackson | 11,455 | 29.36 | -8.77 |
|
New Democratic | Mike Comeau | 4,421 | 11.33 | -1.21 |
|
Green | Tom Mayberry | 3,441 | 8.82 | +6.83 |
|
Independent | Jim Bender | 659 | 1.69 | |
|
Family Coalition | Leonard Vanderhoeven | 601 | 1.54 | -0.08 |
| Total valid votes |
39,022 | 100.0 |
| 2003 Ontario general election |
| Party |
Candidate |
Votes | % | |
|
Progressive Conservative | Ernie Hardeman | 18,656 | 44.06 | -9.19 |
|
Liberal | Brian Brown | 16,135 | 38.10 | +2.57 |
|
New Democratic | Shawn Rouse | 5,318 | 12.56 | +5.35 |
|
Green | Tom Mayberry | 838 | 1.98 | |
|
Family Coalition | Andre De Decker | 689 | 1.63 | -0.42 |
|
Freedom | Paul Blair | 404 | 0.95 | +0.22 |
|
Libertarian | Kaye Sargent | 306 | 0.72 | -0.03 |
| Total valid votes |
42,346 | 100.0 |
| 1999 Ontario general election |
| Party |
Candidate |
Votes | % |
|
Progressive Conservative | Ernie Hardeman | 22,726 | 53.25 |
|
Liberal | Brian Brown | 15,160 | 35.53 |
|
New Democratic | Martin Donlevy | 3,077 | 7.21 |
|
Family Coalition | Andre De Decker | 875 | 2.05 |
|
Libertarian | Kaye Sargent | 321 | 0.75 |
|
Freedom | Paul Blair | 312 | 0.73 |
|
Natural Law | Jim Morris | 203 | 0.48 |
| Total valid votes |
42,674 | 100.0 |
| 2007 Ontario electoral reform referendum |
| Side |
Votes |
|
|
First Past the Post |
25,059 |
66 |
|
Mixed member proportional |
12,917 |
34 |
|
Total valid votes |
37,976 |
100.0 |
References
Sources
Provincial ridings in Ontario |
|---|
| Northern | |
|---|
| Eastern | |
|---|
| Central | |
|---|
| Midwestern | |
|---|
| Southwestern | |
|---|
| Peel | |
|---|
Hamilton, Halton,
and Niagara | |
|---|
| Ottawa | |
|---|
| Durham and York | |
|---|
| Toronto | |
|---|
- See also: Federal ridings in Ontario
- List of elections
- Politics of Ontario
|
Текст в блоке "Читать" взят с сайта "Википедия" и доступен по лицензии Creative Commons Attribution-ShareAlike; в отдельных случаях могут действовать дополнительные условия.
Другой контент может иметь иную лицензию. Перед использованием материалов сайта WikiSort.org внимательно изучите правила лицензирования конкретных элементов наполнения сайта.
2019-2025
WikiSort.org - проект по пересортировке и дополнению контента Википедии
