world.wikisort.org - Canada
Leeds—Grenville—Thousand Islands and Rideau Lakes is a provincial electoral district in Ontario, Canada, that has been represented in the Legislative Assembly of Ontario since 1987. Before the 2018 election, it was known simply as Leeds—Grenville.
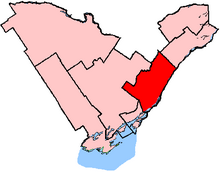 Leeds–Grenville shown within the Eastern Ontario region | |||
| Provincial electoral district | |||
| Legislature | Legislative Assembly of Ontario | ||
| MPP |
Progressive Conservative | ||
| District created | 1986 | ||
| First contested | 1987 | ||
| Last contested | 2022 | ||
| Demographics | |||
| Population (2016) | 100,545 | ||
| Electors (2018) | 82,511 | ||
| Area (km²) | 3,747 | ||
| Pop. density (per km²) | 26.8 | ||
| Census division(s) | Leeds and Grenville | ||
| Census subdivision(s) | Athens, Augusta, Brockville, Edwardsburgh/Cardinal, Elizabethtown–Kitley, Front of Yonge, Gananoque, Leeds and the Thousand Islands, Merrickville–Wolford, North Grenville, Prescott, Rideau Lakes, Westport | ||
It consists of the United Counties of Leeds and Grenville.
Since 1999, provincial ridings have been defined to have the same borders as federal ridings.
For the 2018 election, the district gave up a small portion of territory to Lanark—Frontenac—Kingston.
Members of Provincial Parliament
| Assembly | Years | Member | Party | |
|---|---|---|---|---|
| Leeds—Grenville Riding created from Leeds and Grenville |
||||
| 34th | 1987–1990 | Bob Runciman | Progressive Conservative | |
| 35th | 1990–1995 | |||
| 36th | 1995–1999 | |||
| 37th | 1999–2003 | |||
| 38th | 2003–2007 | |||
| 39th | 2007–2010 | |||
| 2010–2011 | Steve Clark | |||
| 40th | 2011–2014 | |||
| 41st | 2014–2018 | |||
| Leeds—Grenville—Thousand Islands and Rideau Lakes | ||||
| 42nd | 2018–present | Steve Clark | Progressive Conservative | |
Election results
| 2022 Ontario general election | ||||||||
|---|---|---|---|---|---|---|---|---|
| Party | Candidate | Votes | % | ±% | ||||
| Progressive Conservative | Steve Clark | 24,657 | 57.80 | -3.47 | ||||
| Liberal | Josh Bennett | 7,746 | 18.25 | +4.89 | ||||
| New Democratic | Chris Wilson | 5,799 | 13.30 | -6.48 | ||||
| Green | Fiona Jager | 2,583 | 6.06 | +1.27 | ||||
| New Blue | Daniel Kitsch | 944 | 2.21 | |||||
| Ontario Party | Glenn L. Malcolm | 536 | 1.26 | |||||
| Libertarian | Mark Snow | 202 | 0.47 | -0.32 | ||||
| Ontario People's Front | Stephen Ireland | 189 | 0.44 | |||||
| Populist | Dave Senger | 88 | 0.21 | |||||
| Total valid votes | 42,744 | 99.47 | ||||||
| Total rejected, unmarked and declined ballots | 227 | 0.53 | ||||||
| Turnout | 42,971 | 49.12 | -12.78 | |||||
| Eligible voters | 86,847 | |||||||
| Progressive Conservative hold | Swing | +4.18 | ||||||
| Source: Elections Ontario[1] | ||||||||
| 2018 Ontario general election | ||||||||
|---|---|---|---|---|---|---|---|---|
| Party | Candidate | Votes | % | ±% | ||||
| Progressive Conservative | Steve Clark | 30,002 | 61.27 | +5.20 | ||||
| New Democratic | Michelle Taylor | 9,688 | 19.78 | +2.67 | ||||
| Liberal | David Henderson | 6,543 | 13.36 | -7.13 | ||||
| Green | Derek Morley | 2,347 | 4.79 | -0.10 | ||||
| Libertarian | Bill Buckley | 389 | 0.79 | |||||
| Total valid votes | 48,969 | 100.00 | ||||||
| Turnout | 61.9 | |||||||
| Eligible voters | 79,115 | |||||||
| Progressive Conservative hold | Swing | |||||||
| Source: Elections Ontario[2] | ||||||||
| 2014 Ontario general election: Leeds—Grenville | ||||||||
|---|---|---|---|---|---|---|---|---|
| Party | Candidate | Votes | % | ±% | ||||
| Progressive Conservative | Steve Clark | 23,253 | 56.07 | −7.53 | ||||
| Liberal | Christine Milks | 8,499 | 20.49 | +3.06 | ||||
| New Democratic | David Lundy | 7,219 | 17.41 | +2.18 | ||||
| Green | Stephen Bowering | 2,030 | 4.89 | +1.44 | ||||
| Libertarian | Harold Gabriel | 471 | 1.14 | – | ||||
| Total valid votes | 41,472 | 100.0 | +8.43 | |||||
| Progressive Conservative hold | Swing | −5.30 | ||||||
Source(s)
Elections Ontario (2014). "Official result from the records, 042 Leeds-Grenville" (PDF). Retrieved 27 June 2015. | ||||||||
| 2011 Ontario general election: Leeds—Grenville | ||||||||
|---|---|---|---|---|---|---|---|---|
| Party | Candidate | Votes | % | ±% | Expenditures | |||
| Progressive Conservative | Steve Clark | 24,314 | 63.60 | −3.08 | $ 52,598.00 | |||
| Liberal | Ray Heffernan | 6,663 | 17.43 | −2.65 | 17,512.99 | |||
| New Democratic | David Lundy | 5,822 | 15.23 | +10.12 | 13,274.26 | |||
| Green | Charlie Taylor | 1,319 | 3.45 | −4.22 | 3,731.20 | |||
| Socialist | Lance Fulsom | 111 | 0.29 | 0.00 | ||||
| Total valid votes / Expense limit | 38,229 | 100.0 | +37.72 | $ 90,198.43 | ||||
| Total rejected, unmarked and declined ballots | 155 | 0.40 | +0.09 | |||||
| Turnout | 38,384 | 50.64 | +14.03 | |||||
| Eligible voters | 75,797 | −0.34 | ||||||
| Progressive Conservative hold | Swing | −0.22 | ||||||
Source(s)
"Official return from the records / Rapport des registres officiels - Leeds—Grenville" (PDF). "2011 Candidate Campaign Returns (CR-1)". Retrieved June 8, 2014. | ||||||||
| Ontario provincial by-election, March 4, 2010: Leeds—Grenville Resignation of Bob Runciman | ||||||||
|---|---|---|---|---|---|---|---|---|
| Party | Candidate | Votes | % | ±% | Expenditures | |||
| Progressive Conservative | Steve Clark | 18,510 | 66.68 | +10.44 | $ 27,511.00 | |||
| Liberal | Stephen Mazurek | 5,573 | 20.08 | −8.59 | 65,190.41 | |||
| Green | Neil Kudrinko | 2,130 | 7.67 | +0.49 | 14,799.66 | |||
| New Democratic | Steve Armstrong | 1,417 | 5.10 | −1.87 | 17,118.89 | |||
| Libertarian | Anthony Giles | 129 | 0.46 | 297.56 | ||||
| Total valid votes | 27,759 | 100.0 | −39.61 | |||||
| Total rejected ballots | 87 | 0.31 | −0.07 | |||||
| Turnout | 27,846 | 36.61 | −24.57 | |||||
| Eligible voters | 76,053 | +5.35 | ||||||
Source(s)
"Leeds—Grenville By-Election – March 4, 2010". Elections Ontario. Retrieved June 8, 2014. "2010 By-Election Returns – Ottawa West-Nepean – Candidate (CR-1) & Association (CR-3) Returns". "Ontario's Runciman among 5 new senators". Toronto Star. January 29, 2010. Retrieved June 8, 2014. | ||||||||
| 2007 Ontario general election: Leeds—Grenville | ||||||||
|---|---|---|---|---|---|---|---|---|
| Party | Candidate | Votes | % | ±% | Expenditures | |||
| Progressive Conservative | Bob Runciman | 22,755 | 56.24 | +7.54 | $ 51,680.90 | |||
| Liberal | Lori Bryden | 11,602 | 28.67 | −11.46 | 38,465.17 | |||
| Green | Jeanie Warnock | 2,907 | 7.18 | +3.10 | 1,870.14 | |||
| New Democratic | Pauline Kuhlmann | 2,821 | 6.97 | +1.36 | 2,619.71 | |||
| Family Coalition | Michael Dwyer | 377 | 0.93 | −0.54 | 0.00 | |||
| Total valid votes/Expense limit | 40,462 | 100.0 | −8.10 | $ 79,644.04 | ||||
| Total rejected ballots | 190 | 0.47 | −0.02 | |||||
| Turnout | 40,652 | 55.11 | −7.00 | |||||
| Eligible voters | 73,763 | +3.55 | ||||||
Source(s)
"Summary of Valid Votes Cast for Each Candidate – October 10, 2007 General Election" (PDF). "Statistical Summary – General Election 2007" (PDF). Elections Ontario. "2007 Candidate Campaign Returns (CR-1)". Retrieved June 8, 2014. | ||||||||
| 2003 Ontario general election: Leeds—Grenville | ||||||||
|---|---|---|---|---|---|---|---|---|
| Party | Candidate | Votes | % | ±% | Expenditures | |||
| Progressive Conservative | Bob Runciman | 21,443 | 48.70 | −4.40 | $ 59,840.81 | |||
| Liberal | Stephen Mazurek | 17,667 | 40.13 | +0.84 | 57,732.05 | |||
| New Democratic | Steve Armstrong | 2,469 | 5.61 | +0.85 | 2,720.12 | |||
| Green | Jerry Heath | 1,799 | 4.09 | +1.80 | 7,267.53 | |||
| Family Coalition | Melody Trolly | 649 | 1.47 | 435.25 | ||||
| Total valid votes/expense limit | 44,027 | 100.0 | −0.04 | $ 68,387.52 | ||||
| Total rejected ballots | 217 | 0.49 | −0.15 | |||||
| Turnout | 44,244 | 62.11 | +0.39 | |||||
| Eligible voters | 71,237 | −0.81 | ||||||
Source(s) | ||||||||
| 1999 Ontario general election: Leeds—Grenville | ||||||||
|---|---|---|---|---|---|---|---|---|
| Party | Candidate | Votes | % | ±% | Expenditures | |||
| Progressive Conservative | Bob Runciman | 23,390 | 53.10 | −10.16 | $ 65,879.18 | |||
| Liberal | Don Cameron | 17,307 | 39.29 | +13.26 | 54,543.00 | |||
| New Democratic | Jim Murray | 2,097 | 4.76 | −1.97 | 2,138.29 | |||
| Green | Ken Blackburn | 1,008 | 2.29 | −0.41 | 762.21 | |||
| Natural Law | Britt Roberts | 244 | 0.55 | 0.00 | ||||
| Total valid votes/Expense limit | 44,046 | 100.0 | +28.04 | $ 68,946.24 | ||||
| Total rejected ballots | 282 | 0.64 | −0.10 | |||||
| Turnout | 44,328 | 61.72 | −1.34 | |||||
| Eligible voters | 71,819 | +30.69 | ||||||
Source(s) | ||||||||
| 1995 Ontario general election: Leeds—Grenville | ||||||||
|---|---|---|---|---|---|---|---|---|
| Party | Candidate | Votes | % | ±% | Expenditures | |||
| Progressive Conservative | Bob Runciman | 21,763 | 63.27 | +14.20 | $ 44,550.77 | |||
| Liberal | Peter McKenna | 8,955 | 26.03 | −0.68 | 45,063.22 | |||
| New Democratic | Charles Stewart | 2,316 | 6.73 | −17.48 | 3,608.98 | |||
| Green | Peter Bevan-Baker | 927 | 2.69 | 1,692.83 | ||||
| Independent | Phillip Blancher | 438 | 1.27 | 669.80 | ||||
| Total valid votes/expense limit | 34,399 | 100.0 | +0.20 | $ 47,488.00 | ||||
| Total rejected ballots | 255 | 0.74 | ||||||
| Turnout | 34,654 | 63.06 | ||||||
| Eligible voters | 54,953 | |||||||
Source(s)
"General Election of June 8 1995 – Summary of Valid Ballots by Candidate". Retrieved June 8, 2014. "General Election of June 8 1995 – Statistical Summary". Elections Ontario. "1995 Details of Candidate Income and Expenses" (3.16MB). & "1995 Summary of Income and Campaign Expenses" ( | ||||||||
| 1990 Ontario general election: Leeds—Grenville | ||||||||
|---|---|---|---|---|---|---|---|---|
| Party | Candidate | Votes | % | ±% | ||||
| Progressive Conservative | Bob Runciman | 16,846 | 49.07 | +5.89 | ||||
| Liberal | Chris Puddicombe | 9,172 | 26.72 | −15.88 | ||||
| New Democratic | Art Lane | 8,312 | 24.21 | +9.99 | ||||
| Total valid votes | 34,330 | 100.0 | +0.25 | |||||
| 1987 Ontario general election: Leeds—Grenville | ||||||||
|---|---|---|---|---|---|---|---|---|
| Party | Candidate | Votes | % | |||||
| Progressive Conservative | Bob Runciman | 14,787 | 43.18 | |||||
| Liberal | Jim Jordan | 14,589 | 42.60 | |||||
| New Democratic | Geri Sheedy | 4,869 | 14.22 | |||||
| Total valid votes | 34,245 | 100.0 | ||||||
2007 electoral reform referendum
| 2007 Ontario electoral reform referendum | |||
|---|---|---|---|
| Side | Votes | % | |
| First Past the Post | 28,156 | 71.19 | |
| Mixed Member Proportional | 11,392 | 28.81 | |
| Total valid votes | 39,548 | 100.00 | |
References
- "Vote Totals from Official Tabulation - Leeds—Grenville—Thousand Islands and Rideau Lakes (052)" (PDF). Elections Ontario. Retrieved September 7, 2022.
- "Summary of Valid Votes Cast for each Candidate" (PDF). Elections Ontario. p. 6. Retrieved 16 January 2019.
External links
Текст в блоке "Читать" взят с сайта "Википедия" и доступен по лицензии Creative Commons Attribution-ShareAlike; в отдельных случаях могут действовать дополнительные условия.
Другой контент может иметь иную лицензию. Перед использованием материалов сайта WikiSort.org внимательно изучите правила лицензирования конкретных элементов наполнения сайта.
Другой контент может иметь иную лицензию. Перед использованием материалов сайта WikiSort.org внимательно изучите правила лицензирования конкретных элементов наполнения сайта.
2019-2025
WikiSort.org - проект по пересортировке и дополнению контента Википедии
WikiSort.org - проект по пересортировке и дополнению контента Википедии