world.wikisort.org - Canada
Barrie—Springwater—Oro-Medonte is a federal electoral district in Ontario. It encompasses a portion of Ontario previously included in the electoral districts of Barrie, Simcoe—Grey and Simcoe North.[2]
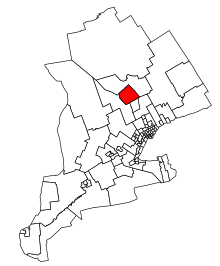 Barrie—Springwater—Oro-Medonte in relation to nearby electoral districts | |||
| Federal electoral district | |||
| Legislature | House of Commons | ||
| MP |
Conservative | ||
| District created | 2013 | ||
| First contested | 2015 | ||
| Last contested | 2021 | ||
| District webpage | profile, map | ||
| Demographics | |||
| Population (2016)[1] | 100,788 | ||
| Electors (2015) | 74,783 | ||
| Area (km²)[1] | 966.10 | ||
| Pop. density (per km²) | 104.3 | ||
| Census division(s) | Simcoe | ||
| Census subdivision(s) | Barrie, Oro-Medonte, Springwater | ||
History
Barrie—Springwater—Oro-Medonte was created by the 2012 federal electoral boundaries redistribution and was legally defined in the 2013 representation order. It came into effect upon the call of the 42nd Canadian federal election, scheduled for 19 October 2015.[3]
Members of Parliament
This riding has elected the following Members of Parliament:
| Parliament | Years | Member | Party | |
|---|---|---|---|---|
| Barrie—Springwater—Oro-Medonte Riding created from Barrie, Simcoe—Grey, and Simcoe North |
||||
| 42nd | 2015–2019 | Alex Nuttall | Conservative | |
| 43rd | 2019–2021 | Doug Shipley | ||
| 44th | 2021–present | |||
Recount
On Monday October 26, 2015, a judge granted the Liberal Party's request for a judicial recount after a 'significant number of rejected and spoiled ballots' were argued may not have been handled properly.[4]
Demographics
Ethnic groups: 92.1% White, 2.9% Aboriginal
Languages: 90.7% English, 2.5% French, 1.1% German
Religions: 67.4% Christian (24.1% Catholic, 12.2% United Church, 9.9% Anglican, 5.1% Presbyterian, 2.9% Baptist, 1.3% Pentecostal, 12.0% Other), 30.5% No religion
Median income (2010): $29,562
Average income (2010): $40,565
Riding associations
Riding associations are the local branches of the national political parties:
| Party | Association Name | CEO | HQ Address | HQ City | |
| Conservative | Barrie—Springwater—Oro-Medonte Conservative Association | John Thornton | 30 Birchgrove Drive | Oro-Medonte | |
| Green | Barrie—Springwater—Oro-Medonte Federal Green Party Association | Eric Loewen | 65 Cedar Point Dr. Unit 278 | Barrie | |
| Liberal | Barrie—Springwater—Oro-Medonte Federal Liberal Association | Mark A. Jessop | 27 Wilde Place | Barrie | |
| New Democratic | Barrie—Springwater—Oro-Medonte NDP Riding Association | Ellen White | 299 Johnson Road | Midhurst | |
| People's Party of Canada | Barrie-Simcoe PPC Association | Stephen Makk | PO Box 543 | Victoria Harbour | |
Election results
| 2021 Canadian federal election | ||||||||
|---|---|---|---|---|---|---|---|---|
| Party | Candidate | Votes | % | ±% | Expenditures | |||
| Conservative | Doug Shipley | 23,555 | 45.09 | +6.08 | ||||
| Liberal | Tanya Saari | 16,145 | 30.91 | -0.33 | ||||
| New Democratic | Sarah Lochhead | 8,910 | 17.06 | +2.24 | ||||
| People's | Chris Webb | 3,629 | 6.95 | +5.15 | ||||
| Total valid votes | 52,239 | |||||||
| Total rejected ballots | 480 | |||||||
| Turnout | 52,719 | 63.43 | -3.11 | |||||
| Eligible voters | 82,843 | |||||||
| Conservative hold | Swing | +3.21 | ||||||
| Source: Elections Canada[7] | ||||||||
| 2019 Canadian federal election | ||||||||
|---|---|---|---|---|---|---|---|---|
| Party | Candidate | Votes | % | ±% | Expenditures | |||
| Conservative | Doug Shipley | 20,981 | 39.00 | -2.57 | $101,308.80 | |||
| Liberal | Brian Kalliecharan | 16,805 | 31.24 | -10.36 | $84,892.64 | |||
| New Democratic | Dan Janssen | 7,972 | 14.82 | +4.50 | $11,769.53 | |||
| Green | Marty Lancaster | 7,066 | 13.14 | +7.88 | none listed | |||
| People's | David Patterson | 969 | 1.80 | – | $3,100.42 | |||
| Total valid votes/expense limit | 53,793 | 99.30 | ||||||
| Total rejected ballots | 378 | 0.70 | ||||||
| Turnout | 54,171 | 66.54 | -0.90 | |||||
| Eligible voters | 81,414 | |||||||
| Conservative hold | Swing | +3.92 | ||||||
| Source: Elections Canada[8][9] | ||||||||
| 2015 Canadian federal election | ||||||||
|---|---|---|---|---|---|---|---|---|
| Party | Candidate | Votes | % | ±% | Expenditures | |||
| Conservative | Alex Nuttall | 21,091 | 41.74 | −12.81 | $151,648.41 | |||
| Liberal | Brian Tamblyn | 21,005 | 41.57 | +24.63 | $101,563.29 | |||
| New Democratic | Ellen White | 5,202 | 10.29 | −9.73 | – | |||
| Green | Marty Lancaster | 2,648 | 5.24 | −0.85 | $30,596.20 | |||
| Libertarian | Darren Roskam | 401 | 0.79 | – | $1,353.95 | |||
| Independent | Ram Faerber | 188 | 0.37 | – | $10.93 | |||
| Total valid votes/expense limit | 50,535 | 99.64 | $207,773.31 | |||||
| Total rejected ballots | 181 | 0.36 | – | |||||
| Turnout | 50,716 | 67.44 | – | |||||
| Eligible voters | 75,207 | |||||||
| Conservative hold | Swing | -18.72 | ||||||
| These results were subject to a judicial recount,[10] and modified from the validated results in accordance with the Judge's rulings. The margin of Alex Nuttall over Brian Tamblyn decreased from 108 votes to 86 votes as a result of the recount.[11] | ||||||||
| Source: Elections Canada[12][13][14] | ||||||||
| 2011 federal election redistributed results[15] | |||
|---|---|---|---|
| Party | Vote | % | |
| Conservative | 24,476 | 54.44 | |
| New Democratic | 8,983 | 20.02 | |
| Liberal | 7,599 | 16.94 | |
| Green | 2,732 | 6.09 | |
| Others | 1,080 | 2.41 | |
References
- Statistics Canada: 2017
- Final Report – Ontario
- Timeline for the Redistribution of Federal Electoral Districts
- "Judicial recount to be held in the riding of Barrie-Springwater-Oro-Medonte". CTV news Barrie. October 26, 2015. Retrieved November 17, 2019.
- "National Household Survey (NHS) Profile, 2011". May 8, 2013.
- "National Household Survey (NHS) Profile, 2011". May 8, 2013.
- "Official Voting Results". Elections Canada. Retrieved October 2, 2021.
- "List of confirmed candidates". Elections Canada. Retrieved October 3, 2019.
- "Official Voting results". Elections Canada. Retrieved September 22, 2021.
- "Recount for Barrie-Springwater-Oro-Medonte riding to be held next week". CTV News Barrie. October 30, 2015.
- Ian McInroy (November 6, 2015). "Conservative candidate Alex Nuttall keeps seat for Barrie-Springwater-Oro-Medonte after official recount". Barrie Examiner. Retrieved November 7, 2015.
- Canada, Elections. "Voter Information Service - Find your electoral district". www.elections.ca.
- Canada, Elections. "Error page". www.elections.ca. Archived from the original on August 15, 2015.
- "Election Night Results". Elections Canada. Retrieved October 22, 2015.
- Pundits' Guide to Canadian Elections
Другой контент может иметь иную лицензию. Перед использованием материалов сайта WikiSort.org внимательно изучите правила лицензирования конкретных элементов наполнения сайта.
WikiSort.org - проект по пересортировке и дополнению контента Википедии