world.wikisort.org - USA
Okanogan County (/ˌoʊkəˈnɑːɡən/)[1] is a county located in the U.S. state of Washington along the Canada–US border. As of the 2020 census, the population was 42,104.[2] The county seat is Okanogan,[3] while the largest city is Omak. Its area is the largest in the state.[4]
Okanogan County | |
|---|---|
U.S. county | |
 Okanogan County courthouse in Okanogan | |
 Seal | |
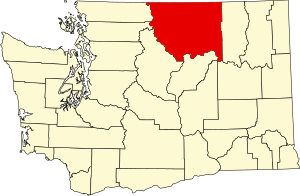 Location within the U.S. state of Washington | |
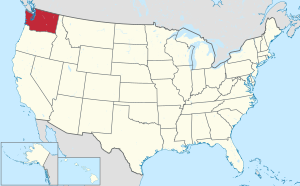 Washington's location within the U.S. | |
| Coordinates: 48°33′N 119°45′W | |
| Country | |
| State | |
| Founded | February, 1888 |
| Named for | Fort Okanogan |
| Seat | Okanogan |
| Largest city | Omak |
| Area | |
| • Total | 5,315 sq mi (13,770 km2) |
| • Land | 5,268 sq mi (13,640 km2) |
| • Water | 47 sq mi (120 km2) 0.9%% |
| Population (2020) | |
| • Total | 42,104 |
| • Estimate (2021) | 42,634 |
| • Density | 7.8/sq mi (3.0/km2) |
| Time zone | UTC−8 (Pacific) |
| • Summer (DST) | UTC−7 (PDT) |
| Congressional district | 4th |
| Website | okanogancounty |
About a fifth of the county's residents live in the Greater Omak Area. The county forms a portion of the Okanogan Country. The first county seat was Ruby, which has now been a ghost town for more than 100 years.
Okanogan County was formed out of Stevens County in February 1888.[5] The name derives from the Okanagan language place name ukʷnaqín.[6] The name Okanogan (Okanagan) also refers to a part of southern British Columbia.
History
Before Europeans arrived, the Okanogan County region was home to numerous indigenous peoples that would eventually become part of three Indian reservations referred to as the Northern Okanogans or Sinkaietk, Tokoratums, Kartars and Konkonelps. They spoke in seven types of Interior Salish languages related to the Puget Sound tribes. The Okanogans experienced a favorable climate, camping in the winter, hunting bears in the spring, catching fish in the summer and hunting deer in fall. The camps consisted of teepee-like longhouses built with hides and bark. Women gathered nuts and berries. A popular destination for this was the Kettle Falls, where the Columbia River dropped some 20 feet (6.1 m).
Due to its remoteness, the Okanogan County area was one of the last in Washington settled by Europeans. It was an early thoroughfare used by prospectors to gain access to other communities, such as British Columbia. By the 21st century, the region specialized in agriculture, forestry and tourism. Electric producer Grand Coulee Dam was constructed between 1933 and 1942, originally with two power plants, around the Okanogan and Grant counties at the former's southern border.[7]
In July 2014, the Carlton Complex wildfire burned over 250,000 acres (390 sq mi; 1,000 km2) in Okanogan County. It destroyed over 300 homes[8] including 100 in and around Pateros[9]
Contrary to popular belief, Okanogan derives its name from a man, and not a native tribe, as there was no tribe called the "Okanogan People," image and source pending. The region was commonly referred to as Okanogan, so 'Okanogans' referred to any native from that region. Similarly, there was no tribe called "the Americans," yet 'Native American' has become a general term of description for the pre-colonial native tribes.
Geography
According to the United States Census Bureau, the county has a total area of 5,315 square miles (13,770 km2), of which 5,268 square miles (13,640 km2) is land and 47 square miles (120 km2) (0.9%) is water.[10] It is the largest county in the state by area, and it is larger than three states in land area.[11]
Geographic features
- Cascade Mountains
- Columbia River
- Okanogan River
- North Gardner Mountain, the highest point in Okanogan County
- Beaner Lake
Major highways
 U.S. Route 97
 State Route 20
 State Route 153
Adjacent counties
- Fraser Valley Regional District, British Columbia – northwest
- Okanagan-Similkameen Regional District, British Columbia – north
- Kootenay Boundary Regional District, British Columbia – northeast
- Ferry County – east
- Lincoln County – southeast
- Grant County – south
- Douglas County – south
- Chelan County – southwest
- Skagit County – west
- Whatcom County – west
National protected areas
- Pacific Northwest National Scenic Trail (part)
- Nez Perce National Historical Park (part)
- Okanogan–Wenatchee National Forest
- Pasayten Wilderness
Demographics
| Historical population | |||
|---|---|---|---|
| Census | Pop. | %± | |
| 1890 | 1,467 | — | |
| 1900 | 4,689 | 219.6% | |
| 1910 | 12,887 | 174.8% | |
| 1920 | 17,094 | 32.6% | |
| 1930 | 18,519 | 8.3% | |
| 1940 | 24,546 | 32.5% | |
| 1950 | 29,131 | 18.7% | |
| 1960 | 25,520 | −12.4% | |
| 1970 | 25,867 | 1.4% | |
| 1980 | 30,639 | 18.4% | |
| 1990 | 33,350 | 8.8% | |
| 2000 | 39,564 | 18.6% | |
| 2010 | 41,120 | 3.9% | |
| 2020 | 42,104 | 2.4% | |
| 2021 (est.) | 42,634 | [12] | 1.3% |
| U.S. Decennial Census[13] 1790–1960[14] 1900–1990[15] 1990–2000[16] 2010–2020[2] | |||
2000 census
As of the census[17] of 2000, there were 39,564 people, 15,027 households, and 10,579 families living in the county. The population density was 8 people per square mile (3/km2). There were 19,085 housing units at an average density of 4 per square mile (1/km2). The racial makeup of the county was 75.32% White, 0.28% Black or African American, 11.47% Native American, 0.44% Asian, 0.07% Pacific Islander, 9.58% from other races, and 2.84% from two or more races. 14.38% of the population were Hispanic or Latino of any race. 14.0% were of German, 9.5% English, 9.2% United States or American and 6.8% Irish ancestry.
There were 15,027 households, out of which 33.20% had children under the age of 18 living with them, 54.40% were married couples living together, 11.00% had a female householder with no husband present, and 29.60% were non-families. 24.50% of all households were made up of individuals, and 9.70% had someone living alone who was 65 years of age or older. The average household size was 2.58 and the average family size was 3.04.
In the county, the population was spread out, with 27.70% under the age of 18, 7.30% from 18 to 24, 25.50% from 25 to 44, 25.50% from 45 to 64, and 14.00% who were 65 years of age or older. The median age was 38 years. For every 100 females there were 99.20 males. For every 100 females age 18 and over, there were 98.00 males.
The median income for a household in the county was $29,726, and the median income for a family was $35,012. Males had a median income of $29,495 versus $22,005 for females. The per capita income for the county was $14,900. About 16.00% of families and 21.30% of the population were below the poverty line, including 28.20% of those under age 18 and 10.40% of those age 65 or over.
2010 census
As of the 2010 census, there were 41,120 people, 16,519 households, and 10,914 families living in the county.[18] The population density was 7.8 inhabitants per square mile (3.0/km2). There were 22,245 housing units at an average density of 4.2 per square mile (1.6/km2).[19] The racial makeup of the county was 73.9% white, 11.4% American Indian, 0.6% Asian, 0.4% black or African American, 0.1% Pacific islander, 10.1% from other races, and 3.5% from two or more races. Those of Hispanic or Latino origin made up 17.6% of the population.[18] In terms of ancestry, 21.4% were German, 12.4% were Irish, 12.2% were English, and 3.6% were American.[20]
Of the 16,519 households, 29.4% had children under the age of 18 living with them, 49.7% were married couples living together, 10.7% had a female householder with no husband present, 33.9% were non-families, and 28.0% of all households were made up of individuals. The average household size was 2.45 and the average family size was 2.96. The median age was 42.9 years.[18]
The median income for a household in the county was $38,551 and the median income for a family was $48,418. Males had a median income of $37,960 versus $29,032 for females. The per capita income for the county was $20,093. About 14.7% of families and 19.5% of the population were below the poverty line, including 27.3% of those under age 18 and 9.2% of those age 65 or over.[21]
Communities

Cities
Towns
- Conconully
- Coulee Dam (partial)
- Elmer City
- Nespelem
- Riverside
- Twisp
- Winthrop
Census-designated places
- Disautel
- Loomis
- Malott
- Methow
- Nespelem Community
- North Omak
Other unincorporated communities
Ghost towns
Politics
| Year | Republican | Democratic | Third party | |||
|---|---|---|---|---|---|---|
| No. | % | No. | % | No. | % | |
| 2020 | 11,840 | 55.63% | 8,900 | 41.82% | 542 | 2.55% |
| 2016 | 9,610 | 54.74% | 6,298 | 35.87% | 1,648 | 9.39% |
| 2012 | 9,221 | 54.23% | 7,108 | 41.80% | 674 | 3.96% |
| 2008 | 8,798 | 51.79% | 7,613 | 44.82% | 576 | 3.39% |
| 2004 | 9,636 | 58.96% | 6,309 | 38.61% | 397 | 2.43% |
| 2000 | 9,384 | 63.41% | 4,335 | 29.29% | 1,079 | 7.29% |
| 1996 | 5,890 | 45.05% | 4,810 | 36.79% | 2,375 | 18.16% |
| 1992 | 4,265 | 32.72% | 5,015 | 38.48% | 3,753 | 28.80% |
| 1988 | 5,856 | 49.88% | 5,630 | 47.96% | 254 | 2.16% |
| 1984 | 7,476 | 57.25% | 5,330 | 40.81% | 253 | 1.94% |
| 1980 | 6,460 | 51.71% | 4,634 | 37.09% | 1,399 | 11.20% |
| 1976 | 5,455 | 47.05% | 5,543 | 47.81% | 597 | 5.15% |
| 1972 | 5,796 | 56.09% | 3,835 | 37.11% | 703 | 6.80% |
| 1968 | 4,490 | 45.19% | 4,379 | 44.08% | 1,066 | 10.73% |
| 1964 | 3,931 | 37.46% | 6,554 | 62.45% | 10 | 0.10% |
| 1960 | 5,169 | 48.32% | 5,507 | 51.48% | 22 | 0.21% |
| 1956 | 5,448 | 50.66% | 5,298 | 49.27% | 8 | 0.07% |
| 1952 | 6,085 | 55.57% | 4,817 | 43.99% | 48 | 0.44% |
| 1948 | 4,083 | 41.10% | 5,644 | 56.81% | 208 | 2.09% |
| 1944 | 4,084 | 46.60% | 4,642 | 52.97% | 38 | 0.43% |
| 1940 | 4,244 | 43.96% | 5,362 | 55.54% | 49 | 0.51% |
| 1936 | 2,367 | 27.31% | 5,622 | 64.87% | 678 | 7.82% |
| 1932 | 2,277 | 32.78% | 3,969 | 57.13% | 701 | 10.09% |
| 1928 | 3,245 | 64.86% | 1,722 | 34.42% | 36 | 0.72% |
| 1924 | 2,531 | 50.41% | 721 | 14.36% | 1,769 | 35.23% |
| 1920 | 2,784 | 54.98% | 1,260 | 24.88% | 1,020 | 20.14% |
| 1916 | 1,896 | 35.55% | 2,924 | 54.82% | 514 | 9.64% |
| 1912 | 804 | 18.97% | 1,461 | 34.47% | 1,974 | 46.57% |
| 1908 | 1,368 | 49.23% | 1,074 | 38.65% | 337 | 12.13% |
| 1904 | 1,192 | 66.63% | 435 | 24.32% | 162 | 9.06% |
| 1900 | 457 | 38.08% | 714 | 59.50% | 29 | 2.42% |
| 1896 | 284 | 22.72% | 950 | 76.00% | 16 | 1.28% |
| 1892 | 577 | 50.04% | 425 | 36.86% | 151 | 13.10% |
See also
- National Register of Historic Places listings in Okanogan County, Washington
- Okanogan Conservation District
Further reading
- An illustrated history of Stevens, Ferry, Okanogan and Chelan counties, State of Washington. Western Historical Pub. Co. 1904.Available online through the Washington State Library's Classics in Washington History collection
References
- "Washington Placenames Pronunciation". Washington County Highpoint Trip Reports.
{{cite web}}: Missing or empty|url=(help) - "State & County QuickFacts". United States Census Bureau. Retrieved April 8, 2022.
- "Find a County". National Association of Counties. Archived from the original on May 31, 2011. Retrieved June 7, 2011.
- Wilma, David (January 21, 2006). "Okanogan County — Thumbnail History". HistoryLink.org.
- "Washington State Archives – Central Regional Branch: Guide to Holdings: Okanogan County". Retrieved December 31, 2007.
- Bright, William (2004). Native American placenames of the United States. University of Oklahoma Press. p. 346. ISBN 978-0-8061-3598-4. Retrieved September 16, 2011.
- "Thumbnail History". HistoryLink. Retrieved February 17, 2013.
- "Fire's updated toll: 300 homes, 'horrifying' devastation". Seattle Times. July 26, 2014. Retrieved July 26, 2014.
- Geranios, Nicholas K.; Johnson, Gene (July 19, 2014). "Damage from Washington Wildfires 'Hard to Believe'". The Associated Press. Boston.com. Archived from the original on July 27, 2014.
- "2010 Census Gazetteer Files". United States Census Bureau. August 22, 2012. Retrieved July 7, 2015.
- Rhode Island has 1,545 sq. mi, and Delaware has 2,489 sq. mi. Connecticut has 5,543 sq. mi. total, but only 4,842 sq. mi. of land area, and thus is considered smaller than Okanogan County in this regard.
- "Annual Estimates of the Resident Population for Counties: April 1, 2020 to July 1, 2021". Retrieved April 8, 2022.
- "U.S. Decennial Census". United States Census Bureau. Retrieved January 7, 2014.
- "Historical Census Browser". University of Virginia Library. Retrieved January 7, 2014.
- "Population of Counties by Decennial Census: 1900 to 1990". United States Census Bureau. Retrieved January 7, 2014.
- "Census 2000 PHC-T-4. Ranking Tables for Counties: 1990 and 2000" (PDF). United States Census Bureau. Archived from the original (PDF) on February 26, 2015. Retrieved January 7, 2014.
- "U.S. Census website". United States Census Bureau. Retrieved May 14, 2011.
- "DP-1 Profile of General Population and Housing Characteristics: 2010 Demographic Profile Data". United States Census Bureau. Archived from the original on February 13, 2020. Retrieved March 6, 2016.
- "Population, Housing Units, Area, and Density: 2010 – County". United States Census Bureau. Archived from the original on February 13, 2020. Retrieved March 6, 2016.
- "DP02 SELECTED SOCIAL CHARACTERISTICS IN THE UNITED STATES – 2006–2010 American Community Survey 5-Year Estimates". United States Census Bureau. Archived from the original on February 13, 2020. Retrieved March 6, 2016.
- "DP03 SELECTED ECONOMIC CHARACTERISTICS – 2006–2010 American Community Survey 5-Year Estimates". United States Census Bureau. Archived from the original on February 13, 2020. Retrieved March 6, 2016.
- Leip, David. "Dave Leip's Atlas of U.S. Presidential Elections". uselectionatlas.org. Retrieved April 10, 2018.
- The leading "other" candidate, Progressive Theodore Roosevelt, received 1,088 votes, while Socialist candidate Eugene Debs received 827 votes, Prohibition candidate Eugene Chafin received 38 votes, and Socialist Labor candidate Arthur Reimer received 21 votes.
Places adjacent to Okanogan County, Washington | |
|---|---|
Municipalities and communities of Okanogan County, Washington, United States | ||
|---|---|---|
County seat: Okanogan | ||
| Cities | 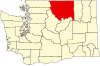 | |
| Towns | ||
| CDPs |
| |
| Unincorporated communities | ||
| Indian reservation |
| |
| Ghost towns | ||
| Footnotes | ‡This populated place also has portions in an adjacent county or counties | |
| ||
State of Washington | |||||||
|---|---|---|---|---|---|---|---|
Olympia (capital) | |||||||
| Topics |
| ||||||
| Society |
| ||||||
| Politics |
| ||||||
| Regions |
| ||||||
| Largest cities |
| ||||||
| Counties |
| ||||||
| |||||||
На других языках
[de] Okanogan County
Okanogan County[3] ist ein County im Bundesstaat Washington der Vereinigten Staaten. Es hat laut der der Volkszählung 2020 42.104 Einwohner. Der Sitz der Countyverwaltung (County Seat) befindet sich in Okanogan. Im südlichen Teil von Okanogan County befindet sich die Colville Reservation, eines der größten Indianerreservationen des Bundesstaates.- [en] Okanogan County, Washington
[ru] Оканоган (округ)
Округ Оканоган (англ. Okanogan County) — округ штата Вашингтон, США. Население округа на 2000 год составляло 39564 человек. Административный центр округа — город Оканоган.Другой контент может иметь иную лицензию. Перед использованием материалов сайта WikiSort.org внимательно изучите правила лицензирования конкретных элементов наполнения сайта.
WikiSort.org - проект по пересортировке и дополнению контента Википедии