world.wikisort.org - USA
Illinois's 2nd congressional district is a congressional district in the U.S. state of Illinois. Based in the south suburbs of Chicago, the district includes southern Cook county, eastern Will county, and Kankakee county, as well as the city of Chicago's far southeast side.
| Illinois's 2nd congressional district | |||
|---|---|---|---|
District boundaries | |||
| Representative |
| ||
| Area | 1,081 sq mi (2,800 km2) | ||
| Population (2021) | 681,277 | ||
| Median household income | $55,279[1] | ||
| Ethnicity |
| ||
| Cook PVI | D+28[2][3] | ||


Overview
Illinois's 2nd congressional district is adjacent to the 1st congressional district to the north and west, the 16th congressional district to the south, and Indiana's 1st congressional district to the east. The district's northeast border follows Lake Michigan's shoreline for several miles. The district was created following the 1830 U.S. census and came into existence in 1833, five months before Chicago was organized as a town. The 2nd congressional district initially included Southeastern Illinois until 1853[4][5] and stretches of Northern Illinois until 1873.[6][7] It has been based in Chicago since 1853, and part of the southeast side since 1903. Redistricting following the 2000 U.S. census placed a majority of the district's population outside Chicago for the first time in 100 years, and moved the district's borders beyond Cook County for the first time since 1873.
As in the neighboring 1st District, a majority of this district's residents (62.4%) are African American. The district has been reliably Democratic since the 1960s; it has been in Democratic hands for all but two terms since 1935, and last elected a Republican to Congress in 1950. Democratic congressional candidates regularly receive over 80% of the vote here. It has been held by black representatives since 1981.
Demographics
The southeast side of Chicago was for many decades the home of numerous Eastern European and Irish immigrants who sought the industrial work of the steel mills and railroad companies which were then dominant in the area. However, as local industry declined in the 1950s and 1960s, these groups were increasingly displaced by African Americans who were gradually migrating southward from other parts of the city. Whereas barely 20% of district residents were black in the 1960s,[8] this figure increased to 70% by the 1980s,[9] and by the 1990s the racial demographics of the 1st and 2nd congressional districts were very similar. At the same time, decreasing population in the district required expanding its borders into the suburbs, and it is now nearly three times the size it was in the 1980s, when it covered only 68 square miles (180 km2).
Following redistricting for the 2000s (decade), 59% of the 2nd congressional district's population resides in the suburbs, with a total of 98.4% living in Cook County. The district's white population (almost 30% of its residents) now primarily resides in the southern suburbs and a few far southeastern Chicago neighborhoods such as East Side and Hegewisch.[10]
Several suburbs closer to Chicago near Interstate 57 have black populations exceeding 75%: Calumet Park, Country Club Hills, Dolton, Harvey, Hazel Crest, Markham, Matteson, Phoenix, Richton Park, Riverdale, and University Park. In contrast, there are five suburbs further southeast with white populations exceeding 75% – Homewood, Lansing, South Chicago Heights, Steger and Thornton – although they surround Ford Heights, with a population of only about 2800 the district's most racially one-sided population (96% black). Chicago Heights features the most even racial mix, with a population that is 45% white and 38% black. The district's largest white ethnic groups are German (5.8%), Irish (4.4%), Polish (4.4%) and Italian (3.1%),[11] similar to other districts in southern Cook County.
Hispanics represent 10% of the district's population, with sizable communities in East Side and Chicago Heights. Chicago's South Shore neighborhood was the longtime home to a Jewish community which has since migrated to suburbs such as Homewood and Flossmoor . South Shore is now primarily a middle-class black community and is also home to a notable minority of Black Muslims including the national headquarters of the Nation of Islam, Mosque Maryam.
The district includes some sharp economic disparities. Olympia Fields, Country Club Hills and Matteson are affluent suburbs with black majority populations, but Ford Heights (only four miles east of Olympia Fields) is one of the most impoverished places in the United States, with a median household income of just $17,500 in 2000 – less than 42% of the national average. It is home to more single mothers per capita than anyplace else in the country.[12]
Geographic boundaries
2011 redistricting
The district covers parts of Cook and Will counties and all of Kankakee, as of the 2011 redistricting which followed the 2010 census. All or parts of Bradley, Bourbonnais, Calumet City, Chicago, Chicago Heights, Country Club Hills, Dolton, Harvey, Hazel Crest, Homewood, Kankakee, Lansing, Markham, Matteson, Park Forest, Richton Park, Riverdale, Sauk Village, Steger and Thornton are included.[13] The representatives for these districts were elected in the 2012 primary and general elections, and the boundaries became effective on January 3, 2013.
2021 redistricting
| # | County | Seat | Population |
|---|---|---|---|
| 19 | Champaign | Urbana | 205,943 |
| 31 | Cook | Chicago | 5,173,146 |
| 53 | Ford | Paxton | 13,511 |
| 75 | Iroquois | Watseka | 26,827 |
| 91 | Kankakee | Kankakee | 106,601 |
| 105 | Livingston | Pontiac | 35,664 |
| 183 | Vermillion | Danville | 73,095 |
| 197 | Will | Joliet | 697,252 |
Following the 2020 redistricting, the district will still encompass the south suburbs's of Chicago, eastern Will County, most of Kankakee County, and Chicago's far southeast side. Additionally, it now takes in Iroquois County; most of Ford and Vermillion; eastern Livingston County including half of Pontiac; and the portion of Champaign County north of County Road 3000 N.
The 2nd district takes in the Chicago neighborhoods of Hegewisch and Riverdale; most of South Deering and Pullman; the coastal portion of Kenwood; the eastern part of Woodlawn and Hyde Park taking up Jackson Park; the portion of South Shore east of East 71st Street and South Yates Blvd (including Rainbow Beach Park); and part of Roseland.
Outside of the Chicago city limits, the district takes in the Cook County communities of Riverdale, Dolton, South Holland, Chicago Heights, Sauk Village, Park Forest, Country Club Hills, and Lansing; and part of Blue Island.
Will County is split between this district and the 1st district. They are partitioned by South Harlem Ave, West Peotone Rd, North Peotone Rd, West Kennedy Rd, Rock Creek, and South Center Rd. The 2nd district takes in the municipalities of Peotone, Beecher, Crete, Steger, and Monee.
Kankakee County is split between this district and the 1st district. They are partitioned by North 5000E Rd, East 6000N Rd, Cardinal Drive, Durham St, East Armour Rd, East Marsile St, Bisallion Ave, and the Kankakee River. The 2nd district takes in the municipalities of Kankakee, Momence, Aroma Park, and Herscher; most of Bradley; and half of Bourbonnais.
Vermillion County is split between this district and the 15th district. They are partitioned by Twin Hills Rd, 1730 East, 1295 North, 1700 East, 1200 North, 1670 Rd East, 1050 North, Highway 150, Westville Ln, 1100 North, 800 East, 1200 North, and Lincoln Trail Rd. The 2nd district takes in the municipalities of Danville, Tilton, Bismarck, and Hoopeston.
Ford County is split between this district and the 16th district. They are partitioned by E 900N Rd, N Melvin St, E 8th St, and N 500E Rd. The 2nd district takes in the municipalities of Paxton, Cabery, Elliott, Kempton, Piper City, Roberts, and Sibley; and part of Gibson City.
Livingston County is split between this district and the 16th district. They are partitioned by N 1800 Rd East, E 1550 Rd North, N 1600 Rd East, E 1500 Rd North, N 1500 Rd East, W Reynolds St, Highway 55, The Slough, E 1830 Rd North, Old IL-66 South, N 1700 Rd East, N 2125 Rd North, and N 1800 Rd East. The 2nd district takes in the municipalities of Fairbury, Dwight, and Chatsworth; and half of Pontiac.
Champaign County is split between this district and the 15th district. They are partitioned by County Road 3000 N, County Road 1200 E, East Chandler St, and County Road 2000 E. The 2nd district takes in the municipalities of Rantoul, Ludlow, and Foosland; most of Fisher; and part of Gifford.
Economy
The 2nd Congressional District was, for most of the 20th century, a thriving center of heavy industry centered around Lake Calumet and the Port of Chicago, augmented by the nearby railroad industry which had the Pullman Company as its centerpiece. The steel industry was a major component, with U.S. Steel at one time employing 20,000 district residents, but the Wisconsin Steelworks in South Deering [14] closed in March 1980, and U.S. Steel's South Works plant in South Chicago [15] – source of the steel for Chicago skyscrapers including the Sears Tower – was closed in April 1992; both have since been dismantled. Virtually the last remnant of the industry in the area is ISG Riverdale (formerly the Acme Steel Co.), which began a shutdown in 2001 before being sold and restructured as a smaller company.[16] The most significant remaining industrial presence in the district is now the Ford Motor Company, which operates the Chicago Assembly plant (where the Ford Explorer is manufactured) on the border between South Deering and Hegewisch, as well as the Chicago Stamping facility in Chicago Heights. Like the 1st District, the area is struggling to overcome economic downturns in recent decades.
Local educational institutions include Governors State University in University Park, Chicago State University in Roseland, Prairie State College in Chicago Heights, South Suburban College in South Holland and Olive-Harvey College, a Chicago city college, in Pullman. The University of Chicago is directly west of the district's northern end. Hospitals in the district include Ingalls Memorial Hospital in Harvey, Advocate South Suburban Hospital in Hazel Crest, St. James Hospitals in Chicago Heights and Olympia Fields, Advocate Trinity Hospital in Calumet Heights, La Rabida Children's Hospital in Woodlawn, South Shore Hospital in South Chicago and Roseland Community Hospital in Roseland.
The Museum of Science and Industry is located almost at the district's northern tip. Various areas of the Cook County Forest Preserves are scattered throughout the suburban part of the district, particularly in the area northeast of Chicago Heights. Other notable business and industrial presences in the district include Jays Foods, a manufacturer of snack foods based in Pullman; the Norfolk Southern Railway; Allied Tube and Conduit, a piping and electrical manufacturer in Harvey ; and UGN Inc., an automotive soundproofing manufacturer in Chicago Heights .
Federal facilities in the district include Coast Guard Station Calumet Harbor in East Side and the Vietnam Veterans Memorial Army Reserve Center, home of the 308th Civil Affairs Brigade, in Homewood.
In addition to the Jackson Park Historic Landscape District and the Museum of Science and Industry's U-505, district locations on the National Register of Historic Places include:
- AVR 661, South Deering
- Bloom Township High School, Chicago Heights
- Calumet Park, East Side
- Flamingo-on-the-Lake Apartments, Hyde Park
- Flat Iron Building, Chicago Heights
- Ford Airport Hangar, Lansing
- Hotel Del Prado, Hyde Park
- Jeffery-Cyril Historic District, South Shore
- Lake-Side Terrace Apartments, South Shore
- Allan Miller House, South Shore
- Olympia Fields Country Club, Olympia Fields
- Pacesetter Gardens Historic District, Riverdale (suburb)
- Palmer Park, Roseland
- Promontory Apartments, Hyde Park
- Pullman Historic District National Historic Landmark, Pullman
- Shoreland Hotel, Hyde Park
- South Shore Beach Apartments, South Shore
- South Shore Country Club, South Shore
- Trumbull Park, South Deering
Recent election results from statewide races
| Year | Office | Results |
|---|---|---|
| 2000 | President | Al Gore 81% - George W. Bush 17% |
| 2004 | President | John Kerry 84% - George W. Bush 16% |
| 2008 | President | Barack Obama 90% - John McCain 10% |
| 2012 | President | Barack Obama 80% - Mitt Romney 18% |
| 2016 | President | Hillary Clinton 78% - Donald Trump 19% |
| 2016 | Senate | Tammy Duckworth 77% - Mark Kirk 19% |
| 2018 | Governor | J.B. Pritzker 77% - Bruce Rauner 19% |
| 2020 | President | Joe Biden 77% - Donald Trump 21% |
| 2020 | Senate | Dick Durbin 68% - Mark Curran 18% |
Prominent representatives
| Representative | Notes |
|---|---|
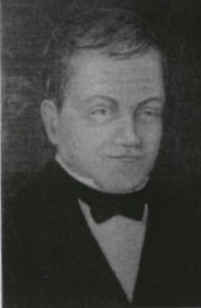
 John Wentworth |
Elected the 21st Mayor of Chicago (1860 – 1861) |
 John F. Farnsworth |
Served as a colonel of the Union Army during the American Civil War (1861 – 1863) |
 John Alexander McClernand |
Served as a brigadier general and major general of the Union Army during the American Civil War (1861 – 1864) |
 Carter Harrison Sr. |
Elected the 29th Mayor of Chicago (1879 – 1887) Elected the 33rd Mayor of Chicago (1893) |
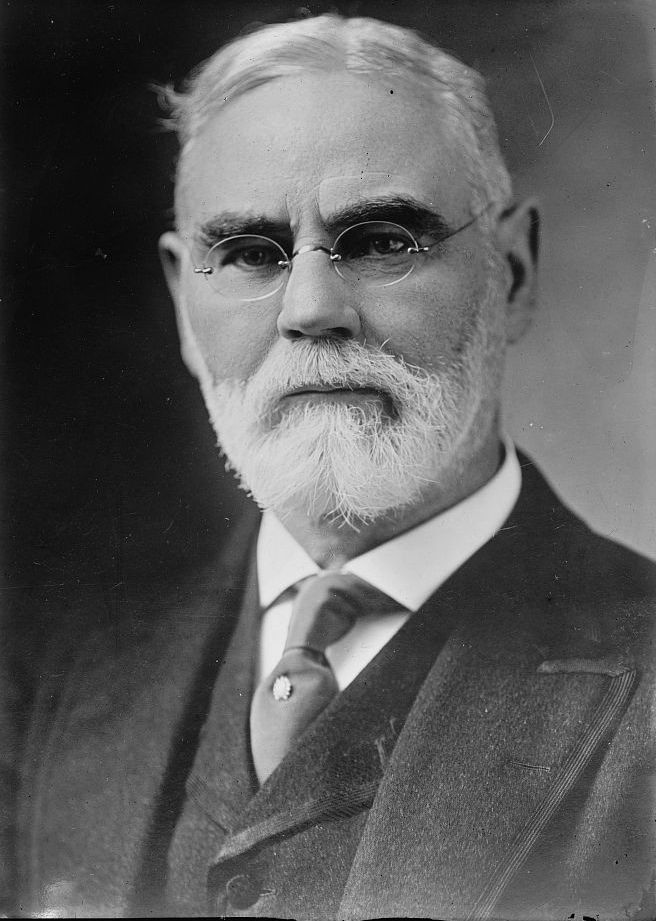
 William Lorimer |
Elected the U.S. Senator from Illinois (1909 – 1912) |
 James Robert Mann |
Served as U.S. House Minority Leader (1911 – 1919) |
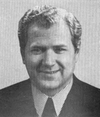
 Abner Mikva |
Appointed judge of the United States Court of Appeals for the District of Columbia Circuit (1979 – 1994) Served as chief judge of the United States Court of Appeals for the District of Columbia Circuit (1991 – 1994) Served as White House Counsel to President Bill Clinton (1994 – 1995) |
List of members representing the district
| Member | Party | Years | Cong ress |
Electoral history |
|---|---|---|---|---|
| District created March 4, 1833 | ||||
 Zadok Casey |
Jacksonian | March 4, 1833 – March 3, 1837 |
23rd 24th |
Elected in 1832. Re-elected in 1834. Re-elected in 1836. Re-elected in 1838. Re-elected in 1840. Lost re-election. |
| Democratic | March 4, 1837 – March 3, 1841 |
25th 26th | ||
| Independent Democratic | March 4, 1841 – March 3, 1843 |
27th | ||
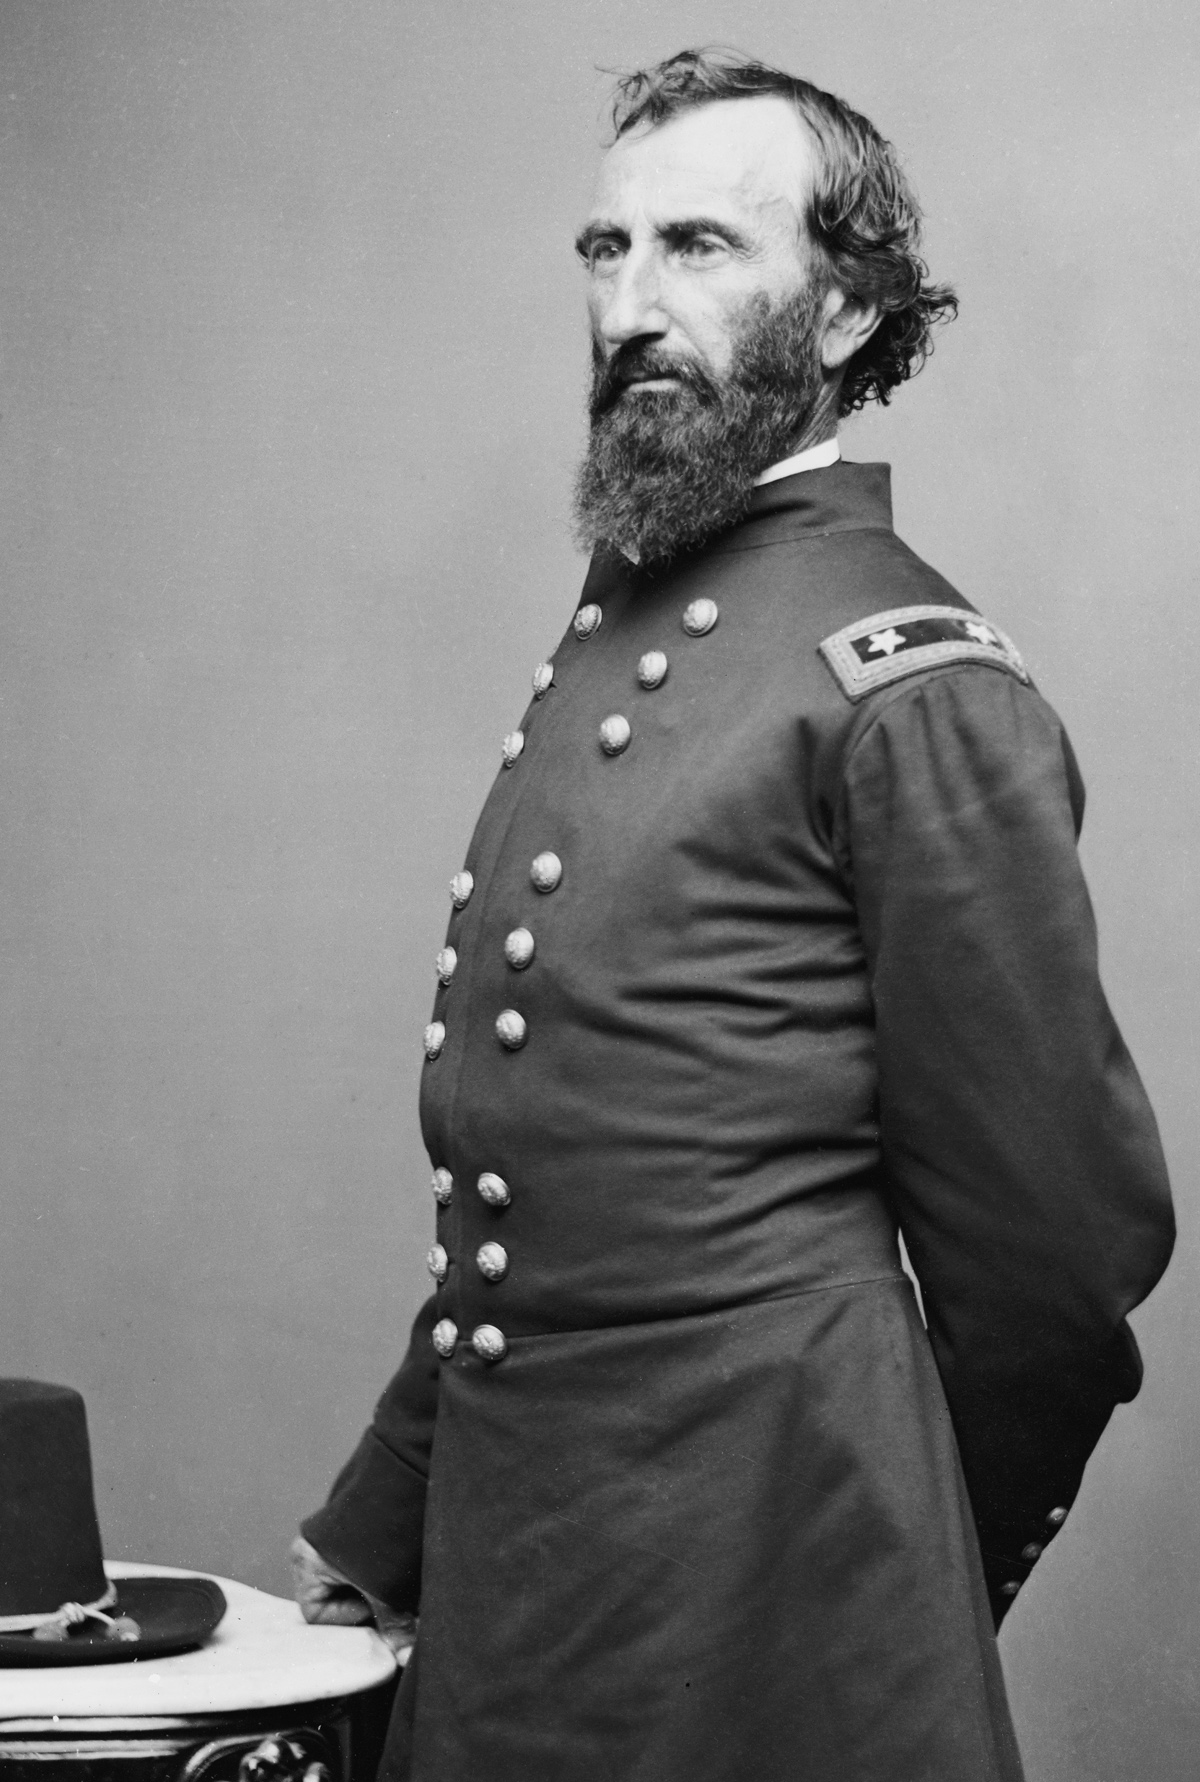 John A. McClernand |
Democratic | March 4, 1843 – March 3, 1851 |
28th 29th 30th 31st |
Elected in 1842. Re-elected in 1844. Re-elected in 1846. Re-elected in 1848. Retired. |
| Willis Allen | Democratic | March 4, 1851 – March 3, 1853 |
32nd | Elected in 1850. Redistricted to the 9th district. |
 John Wentworth |
Democratic | March 4, 1853 – March 3, 1855 |
33rd | Elected in 1852. [data unknown/missing] |
 James H. Woodworth |
Republican | March 4, 1855 – March 3, 1857 |
34th | Elected in 1854. Retired. |
John F. Farnsworth |
Republican | March 4, 1857 – March 3, 1861 |
35th 36th |
Elected in 1856. Re-elected in 1858. Retired. |
 Isaac N. Arnold |
Republican | March 4, 1861 – March 3, 1863 |
37th | Elected in 1860. Redistricted to the 1st district. |
John F. Farnsworth |
Republican | March 4, 1863 – March 3, 1873 |
38th 39th 40th 41st 42nd |
Elected in 1862. Re-elected in 1864. Re-elected in 1866. Re-elected in 1868. Re-elected in 1870. Lost renomination. |
| Jasper D. Ward | Republican | March 4, 1873 – March 3, 1875 |
43rd | Elected in 1872. Lost re-election. |
Carter H. Harrison |
Democratic | March 4, 1875 – March 3, 1879 |
44th 45th |
Elected in 1874. Re-elected in 1876. Retired. |
 George R. Davis |
Republican | March 4, 1879 – March 3, 1883 |
46th 47th |
Elected in 1878. Re-elected in 1880. Redistricted to the 3rd district. |
 John F. Finerty |
Independent Democratic | March 4, 1883 – March 3, 1885 |
48th | Elected in 1882. [data unknown/missing] |
 Frank Lawler |
Democratic | March 4, 1885 – March 3, 1891 |
49th 50th 51st |
Elected in 1884. Re-elected in 1886. Re-elected in 1888. [data unknown/missing] |
 Lawrence E. McGann |
Democratic | March 4, 1891 – March 3, 1895 |
52nd 53rd |
Elected in 1890. Re-elected in 1892. Redistricted to the 3rd district. |
William Lorimer |
Republican | March 4, 1895 – March 3, 1901 |
54th 55th 56th |
Elected in 1894. Re-elected in 1896. Re-elected in 1898. Lost re-election. |
 John J. Feely |
Democratic | March 4, 1901 – March 3, 1903 |
57th | Elected in 1900. Retired. |
 James Robert Mann |
Republican | March 4, 1903 – November 30, 1922 |
58th 59th 60th 61st 62nd 63rd 64th 65th 66th 67th |
Redistricted from the 1st district and re-elected in 1902. Re-elected in 1904. Re-elected in 1906. Re-elected in 1908. Re-elected in 1910. Re-elected in 1912. Re-elected in 1914. Re-elected in 1916. Re-elected in 1918. Re-elected in 1920. Re-elected in 1922. Died. |
| Vacant | November 30, 1922 – April 3, 1923 |
67th 68th |
||
 Morton D. Hull |
Republican | April 3, 1923 – March 3, 1933 |
68th 69th 70th 71st 72nd |
Elected to finish Mann's term. Re-elected in 1924. Re-elected in 1926. Re-elected in 1928. Re-elected in 1930. Retired. |
 P. H. Moynihan |
Republican | March 4, 1933 – January 3, 1935 |
73rd | Elected in 1932. Lost re-election. |
| Raymond S. McKeough | Democratic | January 3, 1935 – January 3, 1943 |
74th 75th 76th 77th |
Elected in 1934. Re-elected in 1936. Re-elected in 1938. Re-elected in 1940. Retired. |
 William A. Rowan |
Democratic | January 3, 1943 – January 3, 1947 |
78th 79th |
Elected in 1942. Re-elected in 1944. Lost re-election. |
 Richard B. Vail |
Republican | January 3, 1947 – January 3, 1949 |
80th | Elected in 1946. Lost re-election. |
 Barratt O'Hara |
Democratic | January 3, 1949 – January 3, 1951 |
81st | Elected in 1948. Lost re-election. |
Richard B. Vail |
Republican | January 3, 1951 – January 3, 1953 |
82nd | Elected in 1950. Lost re-election. |
Barratt O'Hara |
Democratic | January 3, 1953 – January 3, 1969 |
83rd 84th 85th 86th 87th 88th 89th 90th |
Elected in 1952. Re-elected in 1954. Re-elected in 1956. Re-elected in 1958. Re-elected in 1960. Re-elected in 1962. Re-elected in 1964. Re-elected in 1966. Lost renomination. |
Abner Mikva |
Democratic | January 3, 1969 – January 3, 1973 |
91st 92nd |
Elected in 1968. Re-elected in 1970. Redistricted to the 10th district and lost re-election. |
 Morgan F. Murphy |
Democratic | January 3, 1973 – January 3, 1981 |
93rd 94th 95th 96th |
Redistricted from the 3rd district and re-elected in 1972. Re-elected in 1974. Re-elected in 1976. Re-elected in 1978. Retired. |
 Gus Savage |
Democratic | January 3, 1981 – January 3, 1993 |
97th 98th 99th 100th 101st 102nd |
Elected in 1980. Re-elected in 1982. Re-elected in 1984. Re-elected in 1986. Re-elected in 1988. Re-elected in 1990. Lost renomination. |
 Mel Reynolds |
Democratic | January 3, 1993 – October 1, 1995 |
103rd 104th |
Elected in 1992. Re-elected in 1994. Resigned. |
| Vacant | October 1, 1995 – December 12, 1995 |
104th | ||
 Jesse Jackson Jr. |
Democratic | December 12, 1995 – November 21, 2012 |
104th 105th 106th 107th 108th 109th 110th 111th 112th |
Elected to finish Reynolds's term. Re-elected in 1996. Re-elected in 1996. Re-elected in 2000. Re-elected in 2002. Re-elected in 2004. Re-elected in 2006. Re-elected in 2008. Re-elected in 2010. Re-elected in 2012 but resigned. |
| Vacant | November 21, 2012 – April 9, 2013 |
112th 113th |
||
 Robin Kelly |
Democratic | April 9, 2013– Present |
113th 114th 115th 116th 117th |
Elected to finish Jackson's term. Re-elected in 2014. Re-elected in 2016. Re-elected in 2018. Re-elected in 2020. Re-elected in 2022. |
Election results
2002
| Party | Candidate | Votes | % | |
|---|---|---|---|---|
| Democratic | Jesse Jackson, Jr.* | 151,443 | 82.30 | |
| Republican | Doug Nelson | 32,567 | 17.70 | |
| Total votes | 184,010 | 100.00 | ||
| Turnout | ||||
| Democratic hold | ||||
2004
| Party | Candidate | Votes | % | |
|---|---|---|---|---|
| Democratic | Jesse Jackson, Jr.* | 202,176 | 88.34 | |
| Libertarian | Stephanie Sailor | 26,693 | 11.66 | |
| Total votes | 228,869 | 100.00 | ||
| Turnout | ||||
| Democratic hold | ||||
2006
| Party | Candidate | Votes | % | |
|---|---|---|---|---|
| Democratic | Jesse Jackson, Jr.* | 146,347 | 84.84 | |
| Republican | Robert Belin | 20,395 | 11.82 | |
| Libertarian | Anthony W. Williams | 5,748 | 3.33 | |
| Total votes | 172,490 | 100.00 | ||
| Turnout | ||||
| Democratic hold | ||||
2008
| Party | Candidate | Votes | % | |
|---|---|---|---|---|
| Democratic | Jesse Jackson, Jr.* | 251,052 | 89.41 | |
| Republican | Anthony W. Williams | 29,721 | 10.59 | |
| Total votes | 280,773 | 100.00 | ||
| Turnout | ||||
| Democratic hold | ||||
2010
| Party | Candidate | Votes | % | |
|---|---|---|---|---|
| Democratic | Jesse Jackson, Jr.* | 150,666 | 80.52 | |
| Republican | Isaac Hayes | 25,883 | 13.83 | |
| Green | Anthony W. Williams | 10,564 | 5.65 | |
| Total votes | 187,113 | 100.00 | ||
| Turnout | ||||
| Democratic hold | ||||
2012
| Party | Candidate | Votes | % | |
|---|---|---|---|---|
| Democratic | Jesse Jackson, Jr.* | 188,303 | 63.3 | |
| Republican | Brian Woodworth | 69,115 | 23.2 | |
| Independent | Marcus Lewis | 40,006 | 13.5 | |
| Total votes | 297,424 | 100.00 | ||
| Turnout | ||||
| Democratic hold | ||||
2013 (Special)
| Party | Candidate | Votes | % | |
|---|---|---|---|---|
| Democratic | Robin Kelly | 58,142 | 70.8 | |
| Republican | Paul McKinley | 18,072 | 22.0 | |
| Independent | Elizabeth "Liz" Pahlke | 2,477 | 3.0 | |
| Green | LeAlan Jones | 1,505 | 1.8 | |
| Independent | Marcus Lewis | 1,345 | 1.6 | |
| Independent | Curtiss Llong Bey | 539 | 0.7 | |
| Total votes | 82,080 | 100.00 | ||
| Turnout | ||||
| Democratic hold | ||||
2014
| Party | Candidate | Votes | % | |
|---|---|---|---|---|
| Democratic | Robin Kelly (incumbent) | 160,337 | 78.49 | |
| Republican | Eric M. Wallace | 43,799 | 21.44 | |
| Write-in votes | Marcus Lewis | 130 | 0.06 | |
| Total votes | 204,266 | 100.0 | ||
2016
| Party | Candidate | Votes | % | |
|---|---|---|---|---|
| Democratic | Robin Kelly (incumbent) | 235,051 | 79.81 | |
| Republican | John F Morrow | 59,471 | 20.19 | |
| Total votes | 294,522 | 100.0 | ||
2018
| Party | Candidate | Votes | % | |
|---|---|---|---|---|
| Democratic | Robin Kelly (incumbent) | 190,684 | 81.06 | |
| Republican | David Merkle | 44,567 | 18.94 | |
| Total votes | 235,251 | 100.0 | ||
2020
| Party | Candidate | Votes | % | |
|---|---|---|---|---|
| Democratic | Robin Kelly (incumbent) | 234,896 | 78.81 | |
| Republican | Theresa Raborn | 63,142 | 21.19 | |
| Total votes | 298,038 | 100.0 | ||
History of district boundaries
The total number of representatives allotted to Illinois during each period follows the years in parentheses; boundaries went into effect beginning with the previous year's elections:
- 1833–1843 (3): The district included nineteen counties in eastern and southeastern Illinois: Clark, Clay, Coles, Crawford, Edgar, Edwards, Effingham, Fayette, Hamilton, Jasper, Jefferson, Lawrence, Marion, Montgomery, Shelby, Vermilion, Wabash, Wayne and White counties (several additional counties were later created within this area).[4]
- 1843–1853 (7): The district was reduced in size and slightly shifted to take in fifteen counties in southeastern Illinois: Edwards, Franklin, Gallatin, Hamilton, Hardin, Jefferson, Johnson, Marion, Massac, Pope, Pulaski, Wabash, Wayne, White and Williamson counties.[5]
- 1853–1863 (9): The district was relocated to cover seven counties stretching across the northern part of the state: Cook, DeKalb, DuPage, Kane, Lee, Rock Island and Whiteside counties.[6]
- 1863–1873 (14, including one elected at large): The district now included six counties to the north and west of Cook County: Boone, DeKalb, Kane, Lake, McHenry and Winnebago counties.[7]
- 1873–1883 (19): The district now became a portion of Cook County, and included the part of Chicago's west side between the North Branch of the Chicago River and 16th Street; the city's western boundary was then Western Avenue from the river to North Avenue, and Crawford Avenue (now Pulaski Road) from North to 16th.[21]
- 1883–1895 (20/22): The district now included parts of Chicago's west and southwest sides. On the west side, it included the area between 12th Street (now Roosevelt Road) on the north and the river and Illinois and Michigan Canal on the south, as well as a small area north of 12th Street near the river; the western boundary was still Crawford Avenue. South of the river and canal, the district included the area between 16th Street on the north, Clark Street on the east, 39th Street (now Pershing Road) on the south and Western Avenue on the west.[22] Illinois gained two additional representatives following the 1890 census, but they were elected on an at-large basis for the 1893–1895 term before redistricting occurred, and the previous decade's districting remained in effect.[23]
- 1895–1903 (22): The district now included the twelve townships comprising western Cook County (Cicero, Elk Grove, Hanover, Lemont, Leyden, Lyons, Maine, Norwood Park, Palos, Proviso, Riverside, Schaumburg), as well as the part of Chicago's west side bordered on the east by Crawford Avenue from North Avenue to 12th Street, Wood Street from 12th to the canal, Western from the canal to 39th, and State Street from 39th to 63rd Streets; also included was the area north of 12th to Taylor Street between Campbell Avenue and Wood.[24]
- 1903–1949 (initially 25; two of 27 elected at large from 1913 to 1943, and one of 26 elected at large from 1943 to 1949): The district began to take its modern form, and included the part of Chicago south of 43rd Street having as its western boundary State Street from 43rd to 99th Streets, Stewart Avenue from 99th to 103rd, Halsted Street from 103rd to 111th, Peoria Street from 111th to 115th, and Ashland Avenue from 115th to the city line.[25] Illinois's districts were not redrawn until 1947, taking effect for the 1948 elections.[26]
- 1949–1963 (26 from 1949 to 1953; 25 thereafter): The district was reduced in size, and now included that part of Chicago bounded on the north by Marquette Road (State Street to South Park Boulevard, later renamed King Drive), South Chicago Avenue (South Park to Cottage Grove Avenue) and Pershing Road (Cottage Grove to the lake), and on the west by State Street (Marquette to 73rd), Indiana Avenue (73rd to 83rd) and South Park (83rd to 95th Streets). The southern boundary was formed by 95th Street from South Park to the eastern boundary of the Burnside community, following that northwest to 87th Street, and then 87th to Jeffery Boulevard, South Chicago Avenue from Jeffery to 85th Street, 85th to Baltimore Avenue, following that south to 87th, and 87th Street to the lake.[27] The same boundaries were maintained in the redistricting after 1950.[28]
- 1963–1967 (24): The district was again expanded to the south, and included that part of Chicago south of 46th Street bounded on the west by Cottage Grove (46th to 65th), Stony Island Avenue (65th to 99th), State Street (99th to 111th), Wentworth Avenue (111th to 113th) and Halsted (113th to the city line).[29]
- 1967–1973 (24): There was additional redistricting in Illinois which took effect for the 1967–1969 term. The 2nd District kept all of its previous territory except for a small area between 46th and 47th Streets near the lake, and added all of Calumet Township. It also added those portions of Thornton Township east of the Calumet Expressway as far south as 159th Street, and north of the Calumet River from 159th to the state line, as well as those parts of Dolton north of Sibley Boulevard bordered on the west by Lincoln Avenue from the Chicago city line to Irving Avenue and by Irving from there to Sibley.[8]
- 1973–1983 (24): The district was pulled back within the Chicago city limits, and included: the communities of East Side, Hegewisch, Riverdale, South Chicago, South Deering and West Pullman; the part of South Shore bordered on the north by 75th Street (Stony Island to Jeffery), 73rd Street (Jeffery to Yates Boulevard) and 71st Street (Yates to the lake); those parts of Avalon Park and Calumet Heights east of Stony Island; those parts of Roseland and Pullman bordered on the north by 99th Street (Stewart Avenue to State Street) and 103rd Street (State to Stony Island); those parts of Beverly and Morgan Park east of Western Avenue; Washington Heights except for the portion northeast of 95th and Halsted; the part of Auburn Gresham west of Halsted; the part of Englewood southwest of 71st and Halsted; West Englewood except for the portion northeast of Marquette Road and Loomis Boulevard; the part of Chicago Lawn northeast of 63rd and California Avenue; and the part of Gage Park southeast of 55th and Western.[30]
- 1983–1993 (22): The district was again extended into the suburbs. It now included the Chicago communities of East Side, Hegewisch, Riverdale, West Englewood and West Pullman, the part of South Shore southeast of 73rd and Yates, the parts of South Chicago and Calumet Heights east of Yates, South Deering except the portion northwest of 103rd and Yates, the parts of Roseland and Pullman south of 103rd, the eastern half of Morgan Park, the parts of Auburn Gresham and Washington Heights west of Halsted, almost all of Englewood west of Halsted, and the part of Chicago Lawn between 63rd and 69th Streets east of Western. The district included Calumet Township except for those parts of Blue Island and Calumet Park northwest of the railroad running from 123rd and Laflin to the western township line. The district also included the portion of Thornton Township bordered on the south by 167th Street from the western township line to the eastern edge of Hazel Crest, 171st Street from the Hazel Crest boundary to Halsted, 167th from Halsted to Indiana Avenue, Sibley Boulevard from Indiana Avenue to Torrence Avenue (with some minor variation in Calumet City), East State Street from Torrence to the railroad 1/4 mile east, 154th Street from the railroad to Freeland Avenue, and 155th Street from Freeland to the state line.[31]
- 1993–2003 (20): The district now included the Chicago communities of Riverdale and West Pullman; the part of South Shore southeast of 71st and Yates; the parts of South Chicago and Calumet Heights east of Yates; the part of South Deering southwest of 103rd and Yates except for the portion east of the Calumet River, as well as the area between Yates and Torrence Avenue from 95th Street extended south to 116th Street; the part of Hegewisch west of the Calumet River; the parts of Roseland and Pullman south of 103rd Street; most of Morgan Park east of Longwood Drive; the part of Beverly southeast of 103rd and Prospect Avenue; the parts of Auburn Gresham and Washington Heights west of Halsted; the part of Englewood southwest of 63rd and Halsted; and the part of West Englewood south of 63rd Street. The district also included all of Calumet Township, as well as parts of Bloom, Bremen, Rich, Thornton and Worth Townships.[32]
- 2003–present (19): See map and geography above. For a more detailed map, see the Census Bureau map linked below.
Presidential voting
This table indicates how the 2nd District has voted in U.S. presidential elections; election results reflect voting in the district as it was configured at the time of the election, not as it is configured today. The candidate who received the most votes in the district is listed first; the candidate who won the election nationally is in CAPS, and the candidate who won the state of Illinois is indicated with a †.
| Election | District winner | Runnerup | Other candidates |
|---|---|---|---|
| 1852[33] | PIERCE† (D), 8,021 (49%) | Scott (W), 5,882 (36%) | Hale (Free Soil), 2,500 (15%) |
| 1856[33] | Frémont (R), 21,556 (67%) | BUCHANAN† (D), 9,843 (30%) | Fillmore (American), 966 (3%) |
| 1860[33] | LINCOLN† (R), 30,856 (64%) | Douglas (D), 16,993 (35%) | Bell (Constitutional Union), 192 (0.4%); Breckinridge (D), 128 (0.3%) |
| 1864[33] | LINCOLN† (R), 18,305 (78%) | McClellan (D), 5,231 (22%) | |
| 1868[33] | GRANT† (R), 20,946 (77%) | Seymour (D), 6,270 (23%) | |
| 1952[34] | Stevenson (D), 94,905 (51%) | EISENHOWER† (R), 91,522 (49%) | |
| 1956[34] | Stevenson (D), 81,570 (50%) | EISENHOWER† (R), 81,296 (50%) | |
| 1968[35] | Humphrey (D), 103,924 (59%) | NIXON† (R), 52,311 (30%) | Wallace (AIP), 18,896 (11%) |
| 1972[36] | McGovern (D), 116,534 (66%) | NIXON† (R), 60,220 (34%) | |
| 1976[37] | CARTER (D), 137,384 (83%) | Ford† (R), 28,498 (17%) | |
| 1980[38] | Carter (D), 145,205 (84%) | REAGAN† (R), 20,946 (12%) | Anderson (Indep.), 3,612 (2%) |
| 1984[39] | Mondale (D), 168,174 (84%) | REAGAN† (R), 32,693 (16%) | |
| 1988[40] | Dukakis (D), 150,387 (84%) | BUSH† (R), 25,896 (15%) | |
| 1992[41] | CLINTON† (D), 194,639 (80%) | Bush (R), 31,634 (13%) | Perot (Indep.), 16,950 (7%) |
| 1996[42] | CLINTON† (D), 170,819 (85%) | Dole (R), 22,204 (11%) | Perot (Reform), 6,395 (3%) |
| 2000[43] | Gore† (D), 188,289 (89%) | BUSH (R), 21,838 (10%) | Nader (Green), 1,626 (1%) |
| 2004[44] | Kerry† (D), 230,613 (84%) | BUSH (R), 43,822 (16%) | |
| 2008[45] | OBAMA† (D), 260,869 (90%) | McCain (R), 28,676 (10%) | |
| 2012[46] | OBAMA† (D), (81%) | Romney (R), (19%) | |
Historical district boundaries

See also
- Illinois's congressional districts
- List of United States congressional districts
References
- "My Congressional District".
- "Partisan Voting Index – Districts of the 115th Congress" (PDF). The Cook Political Report. April 7, 2017. Retrieved April 7, 2017.
- Barone, Michael; McCutcheon, Chuck (2013). The Almanac of American Politics 2014. Chicago: University of Chicago Press. p. 555. ISBN 978-0-226-10544-4. Copyright National Journal.
- Parsons, Stanley B.; William W. Beach; Dan Hermann (1978). United States Congressional Districts 1788-1841. Westport, CT: Greenwood Press. pp. 302–304. ISBN 0-8371-9828-3.
- Parsons, Stanley B.; William W. Beach; Michael J. Dubin (1986). United States Congressional Districts and Data, 1843-1883. Westport, CT: Greenwood Press. pp. 7–8. ISBN 0-313-22045-X.
- Parsons, et al. (1986), pp. 53-54.
- Parsons, et al. (1986), pp. 102-103.
- Congressional District Data Book, Illinois supplement. Washington, D.C.: U.S. Bureau of the Census. 1966. pp. 2–4.
- Gottron, Martha V., ed. (1983). Congressional Districts in the 1980s. Washington, D.C.: Congressional Quarterly. p. 156. ISBN 0-87187-264-1.
- See U.S. Census Bureau map showing distribution of district's white population.
- Congressional Districts in the 2000s: A Portrait of America, p. 299.
- Barone, Michael; Richard E. Cohen (2005). The Almanac of American Politics 2006. Washington, D.C.: National Journal Group. p. 565. ISBN 0-89234-111-4.
- Illinois Congressional District 2, Illinois Board of Elections
- "South Deering :: Wisconsin Steel". Archived from the original on September 28, 2007. Retrieved July 27, 2007.
- "South Chicago :: U.S. Steel". Archived from the original on April 9, 2011. Retrieved December 29, 2010.
- "Acme Steel Co".
- "Election Results 2014 GENERAL ELECTION". Illinois State Board of Elections. Retrieved October 21, 2019.
- "Election Results 2016 GENERAL ELECTION". Illinois State Board of Elections. Retrieved October 21, 2019.
- "Election Results 2018 GENERAL ELECTION". Illinois State Board of Elections. Retrieved October 21, 2019.
- Illinois State Board of Elections (November 3, 2020). "Official Canvass General Election" (PDF). Downloadable Vote Totals. Illinois State Board of Elections. Archived (PDF) from the original on September 10, 2021.
- Parsons, et al. (1986), pp. 159–160.
- Parsons, Stanley B.; Michael J. Dubin; Karen Toombs Parsons (1990). United States Congressional Districts, 1883–1913. Westport, CT: Greenwood Press. pp. 23–27. ISBN 0-313-26482-1.
- Parsons, et al. (1990), pp. 182–186.
- Parsons, et al. (1990), pp. 187–191.
- Parsons, et al. (1990), pp. 326–330.
- Barrett, Edward A. (ed.). Blue Book of the State of Illinois, 1947–1948. Springfield, IL: State of Illinois. p. 110.
- Barrett, pp. 113-114.
- Congressional District Atlas of the United States. Washington, D.C.: U.S. Bureau of the Census. 1960. pp. 18–20.
- Congressional District Data Book: Districts of the 88th Congress. Washington, D.C.: U.S. Bureau of the Census. 1963. pp. 125–127.
- Congressional District Data Book: 93rd Congress. Washington, D.C.: U.S. Bureau of the Census. 1973. pp. 145, 147–148.
- Gottron, Martha V., ed. (1983). Congressional Districts in the 1980s. Washington, D.C.: Congressional Quarterly. p. 163. ISBN 0-87187-264-1.
- Congressional District Atlas: 103rd Congress of the United States. Washington, D.C.: U.S. Bureau of the Census. 1993. pp. Illinois-1, 5, 25, 29, 31, 33–35. ISBN 0-16-041689-2.
- Vote totals from 1852 to 1868 are based on cumulative county totals as listed in Illinois: Historical and Statistical (1892), John Moses, Chicago: Fergus Printing Co., pp. 1208-1209.
- Congressional District Data Book: Districts of the 87th Congress. Washington, D.C.: U.S. Bureau of the Census. 1961. p. 17.
- Barone, Michael; Grant Ujifusa; Douglas Matthews (1972). The Almanac of American Politics. Boston: Gambit. p. 198. ISBN 0-87645-053-2.
- Barone, Michael; Grant Ujifusa; Douglas Matthews (1973). The Almanac of American Politics. Boston: Gambit. p. 265. ISBN 0-87645-077-X.
- Barone, Michael; Grant Ujifusa; Douglas Matthews (1977). The Almanac of American Politics 1978. New York City: E. P. Dutton. p. 227. ISBN 0-87690-255-7.
- Barone, Michael; Grant Ujifusa (1981). The Almanac of American Politics 1982. Washington, D.C.: Barone & Co. p. 297. ISBN 0-940702-00-2.
- Barone, Michael; Grant Ujifusa (1985). The Almanac of American Politics 1986. Washington, D.C.: National Journal Group. p. 395. ISBN 0-89234-032-0.
- Barone, Michael; Grant Ujifusa (1989). The Almanac of American Politics 1990. Washington, D.C.: National Journal Group. p. 353. ISBN 0-89234-043-6.
- Barone, Michael; Grant Ujifusa (1993). The Almanac of American Politics 1994. Washington, D.C.: National Journal Group. p. 392. ISBN 0-89234-057-6.
- Barone, Michael; Grant Ujifusa; Richard E. Cohen (1997). The Almanac of American Politics 1998. Washington, D.C.: National Journal Group. p. 477. ISBN 0-89234-081-9.
- Barone, Michael; Richard E. Cohen; Charles E. Cook Jr (2001). The Almanac of American Politics 2002. Washington, D.C.: National Journal Group. p. 510. ISBN 0-89234-099-1.
- Barone, et al. (2005), p. 564.
- Presidential Results by Congressional District, 2000-2008; Illinois
- Presidential Results by Congressional District, 2000-2012; Illinois
External links
- Washington Post page on the 2nd District of Illinois
- Village of Burnham Official Website
- "Statistical Abstract of the United States: 2003" (PDF). (163 KiB) - Congressional District Profiles, U.S. Census Bureau
- "U.S. Census Bureau - 2nd District map" (PDF). (1.56 MiB)
- U.S. Census Bureau - 2nd District Fact Sheet
Другой контент может иметь иную лицензию. Перед использованием материалов сайта WikiSort.org внимательно изучите правила лицензирования конкретных элементов наполнения сайта.
WikiSort.org - проект по пересортировке и дополнению контента Википедии