world.wikisort.org - USA
Grant County is a county in the U.S. state of North Dakota. As of the 2020 census, the population was 2,301.[1] Its county seat is Carson.[2]
Grant County | |
|---|---|
U.S. county | |
 Carson Roller Mill | |
 Location within the U.S. state of North Dakota | |
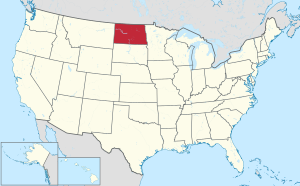 North Dakota's location within the U.S. | |
| Coordinates: 46°22′N 101°38′W | |
| Country | |
| State | |
| Founded | 1916 |
| Named for | Ulysses S. Grant |
| Seat | Carson |
| Largest city | Elgin |
| Area | |
| • Total | 1,666 sq mi (4,310 km2) |
| • Land | 1,659 sq mi (4,300 km2) |
| • Water | 6.8 sq mi (18 km2) 0.4% |
| Population (2020) | |
| • Total | 2,301 |
| • Estimate (2021) | 2,323 |
| • Density | 1.4/sq mi (0.53/km2) |
| Time zone | UTC−7 (Mountain) |
| • Summer (DST) | UTC−6 (MDT) |
| Congressional district | At-large |
| Website | grantcountynd |
History
The territory of Grant County was part of Morton County until 1916. On November 7 the county voters determined that the SW portion of the county would be partitioned off to form a new county, to be named after Ulysses S. Grant, the US President from 1869 to 1877. Accordingly, the county government was organized on November 28, with Carson as the seat. The county's boundaries have remained unchanged since its creation.[3][4][5]

Geography

The Heart River flows eastward through the upper part of Grant County, and Cedar Creek flows east-northeastward along the county's southern boundary line. The county terrain consists of isolated hills among rolling hills, carved by drainages. The semi-arid ground is partially devoted to agriculture.[6] The terrain slopes to the east and south; its highest point is a rise near its southwestern corner, at 2,680' (817m) ASL.[7] The county has a total area of 1,666 square miles (4,310 km2), of which 1,659 square miles (4,300 km2) is land and 6.8 square miles (18 km2) (0.4%) is water.[8] Lake Tschida, a Bureau of Reclamation reservoir and recreation area on the Heart River, is the county's largest body of water.[9]
The southwestern corner of North Dakota observes Mountain Time (Adams, Billings, Bowman, Golden Valley, Grant, Hettinger, Slope, and Stark counties). The counties of McKenzie, Dunn, and Sioux counties are split, with the western portions of each observing Mountain Time.
Major highways
 North Dakota Highway 21
 North Dakota Highway 31
 North Dakota Highway 49
Adjacent counties
- Morton County - northeast (observes Central Time)
- Sioux County - south
- Adams County - southwest
- Hettinger County - west
- Stark County - northwest
Protected areas[6]
- Cedar River National Grassland (part)
- Heart Butte River State Game Management Area
- Otter Creek State Game Management Area
- Pretty Rock National Wildlife Refuge
- Sheep Creek Dam State Recreation Area
Lakes[6]
- Pretty Rock Lake
- Sheep Creek Dam
- Lake Tschida
Demographics
| Historical population | |||
|---|---|---|---|
| Census | Pop. | %± | |
| 1920 | 9,553 | — | |
| 1930 | 10,134 | 6.1% | |
| 1940 | 8,264 | −18.5% | |
| 1950 | 7,114 | −13.9% | |
| 1960 | 6,248 | −12.2% | |
| 1970 | 5,009 | −19.8% | |
| 1980 | 4,274 | −14.7% | |
| 1990 | 3,549 | −17.0% | |
| 2000 | 2,841 | −19.9% | |
| 2010 | 2,394 | −15.7% | |
| 2020 | 2,301 | −3.9% | |
| 2021 (est.) | 2,323 | 1.0% | |
| U.S. Decennial Census[10] 1790-1960[11] 1900-1990[12] 1990-2000[13] 2010-2020[1] | |||
2000 census
As of the 2000 census, there were 2,841 people, 1,195 households, and 800 families in the county. The population density was 2 people per square mile (1/km2). There were 1,722 housing units at an average density of 1.04 per square mile (0.40/km2). The racial makeup of the county was 96.90% White, 1.72% Native American, 0.35% Asian, 0.35% from other races, and 0.67% from two or more races. 0.60% of the population were Hispanic or Latino of any race. 73.7% were of German, 7.9% Norwegian and 5.2% American ancestry.
There were 1,195 households, out of which 25.10% had children under the age of 18 living with them, 60.80% were married couples living together, 3.80% had a female householder with no husband present, and 33.00% were non-families. 31.80% of all households were made up of individuals, and 17.90% had someone living alone who was 65 years of age or older. The average household size was 2.30 and the average family size was 2.90.
The county population contained 23.40% under the age of 18, 4.30% from 18 to 24, 20.50% from 25 to 44, 27.10% from 45 to 64, and 24.70% who were 65 years of age or older. The median age was 46 years. For every 100 females there were 104.10 males. For every 100 females age 18 and over, there were 100.30 males.
The median income for a household in the county was $23,165, and the median income for a family was $30,625. Males had a median income of $21,537 versus $17,949 for females. The per capita income for the county was $14,616. About 14.70% of families and 20.30% of the population were below the poverty line, including 24.70% of those under age 18 and 20.90% of those age 65 or over.
2010 census
As of the 2010 census, there were 2,394 people, 1,128 households, and 694 families in the county.[14] The population density was 1.4 inhabitants per square mile (0.54/km2). There were 1,690 housing units at an average density of 1.02 per square mile (0.39/km2).[15] The racial makeup of the county was 97.2% white, 1.1% American Indian, 0.1% Asian, 0.2% from other races, and 1.3% from two or more races. Those of Hispanic or Latino origin made up 0.3% of the population.[14] In terms of ancestry, 66.6% were German, 14.0% were Norwegian, 12.5% were Russian, 5.9% were Irish, 5.5% were English, and 2.2% were American.[16]
Of the 1,128 households, 19.6% had children under the age of 18 living with them, 54.7% were married couples living together, 3.9% had a female householder with no husband present, 38.5% were non-families, and 36.5% of all households were made up of individuals. The average household size was 2.10 and the average family size was 2.72. The median age was 51.7 years.[14]
The median income for a household in the county was $39,500 and the median income for a family was $53,542. Males had a median income of $33,750 versus $27,303 for females. The per capita income for the county was $25,840. About 7.3% of families and 13.0% of the population were below the poverty line, including 18.1% of those under age 18 and 18.7% of those age 65 or over.[17]
Communities
Cities
Census-designated places
- Heil
- Raleigh
Unincorporated communities
Townships
- Elm
- Fisher
- Freda
- Howe
- Lark
- Leipzig
- Minnie
- Pretty Rock
- Raleigh
- Rock
- Winona
Defunct township
- Otter Creek Township[18]
Politics
Grant County voters have traditionally voted Republican. In no national election since 1936 has the county selected the Democratic Party candidate.
| Year | Republican | Democratic | Third party | |||
|---|---|---|---|---|---|---|
| No. | % | No. | % | No. | % | |
| 2020 | 1,145 | 82.91% | 207 | 14.99% | 29 | 2.10% |
| 2016 | 1,108 | 80.23% | 185 | 13.40% | 88 | 6.37% |
| 2012 | 1,025 | 72.54% | 334 | 23.64% | 54 | 3.82% |
| 2008 | 873 | 64.91% | 405 | 30.11% | 67 | 4.98% |
| 2004 | 952 | 76.65% | 264 | 21.26% | 26 | 2.09% |
| 2000 | 1,077 | 75.47% | 235 | 16.47% | 115 | 8.06% |
| 1996 | 760 | 55.51% | 300 | 21.91% | 309 | 22.57% |
| 1992 | 900 | 45.94% | 415 | 21.18% | 644 | 32.87% |
| 1988 | 1,351 | 66.13% | 654 | 32.01% | 38 | 1.86% |
| 1984 | 1,607 | 74.92% | 507 | 23.64% | 31 | 1.45% |
| 1980 | 1,891 | 80.85% | 317 | 13.55% | 131 | 5.60% |
| 1976 | 1,205 | 53.37% | 952 | 42.16% | 101 | 4.47% |
| 1972 | 1,569 | 70.17% | 596 | 26.65% | 71 | 3.18% |
| 1968 | 1,648 | 71.78% | 488 | 21.25% | 160 | 6.97% |
| 1964 | 1,421 | 57.11% | 1,063 | 42.73% | 4 | 0.16% |
| 1960 | 1,794 | 65.21% | 955 | 34.71% | 2 | 0.07% |
| 1956 | 1,872 | 72.03% | 718 | 27.63% | 9 | 0.35% |
| 1952 | 2,465 | 85.32% | 403 | 13.95% | 21 | 0.73% |
| 1948 | 1,555 | 66.94% | 689 | 29.66% | 79 | 3.40% |
| 1944 | 1,745 | 80.64% | 410 | 18.95% | 9 | 0.42% |
| 1940 | 2,815 | 81.52% | 627 | 18.16% | 11 | 0.32% |
| 1936 | 1,022 | 29.57% | 1,858 | 53.76% | 576 | 16.67% |
| 1932 | 657 | 17.98% | 2,912 | 79.69% | 85 | 2.33% |
| 1928 | 1,759 | 54.59% | 1,434 | 44.51% | 29 | 0.90% |
| 1924 | 1,120 | 39.07% | 125 | 4.36% | 1,622 | 56.57% |
| 1920 | 2,184 | 83.17% | 296 | 11.27% | 146 | 5.56% |
See also
- National Register of Historic Places listings in Grant County, North Dakota
References
- "U.S. Census Bureau QuickFacts: Grant County, North Dakota". www.census.gov. United States Census Bureau. Retrieved March 27, 2022.
- "Find a County". National Association of Counties. Archived from the original on May 31, 2011. Retrieved June 7, 2011.
- Long, John H. (2006). "Dakota Territory, South Dakota, and North Dakota: Individual County Chronologies". Dakota Territory Atlas of Historical County Boundaries. The Newberry Library. Archived from the original on November 11, 2007. Retrieved February 19, 2019.
- Certification of the division of Morton County, ND 28 November 1916Archived July 3, 2008, at the Wayback Machine
- "County History". North Dakota.gov. The State of North Dakota. Archived from the original on February 2, 2015. Retrieved February 19, 2019.
- Grant County ND Google Maps (accessed February 19, 2019)
- ""Find an Altitude/Grant County ND" Google Maps (accessed February 19, 2019)". Archived from the original on May 21, 2019. Retrieved February 20, 2019.
- "2010 Census Gazetteer Files". United States Census Bureau. August 22, 2012. Archived from the original on January 29, 2015. Retrieved January 28, 2015.
- "Heart Butte Reservoir". Recreation.gov. Bureau of Reclamation. Retrieved June 3, 2010.
- "United States Decennial Census". United States Census Bureau. Retrieved January 28, 2015.
- "Historical Census Browser". University of Virginia Library. Retrieved January 28, 2015.
- Forstall, Richard L., ed. (March 27, 1995). "Population of Counties by Decennial Census: 1900 to 1990". United States Census Bureau. Retrieved January 28, 2015.
- "Census 2000 PHC-T-4. Ranking Tables for Counties: 1990 and 2000" (PDF). United States Census Bureau. April 2, 2001. Retrieved January 28, 2015.
- "Profile of General Population and Housing Characteristics: 2010 Demographic Profile Data". United States Census Bureau. Archived from the original on February 13, 2020. Retrieved March 14, 2016.
- "Population, Housing Units, Area, and Density: 2010 - County". United States Census Bureau]]. Archived from the original on February 13, 2020. Retrieved March 14, 2016.
- "Selected Social Characteristics in the US – 2006-2010 American Community Survey 5-Year Estimates". United States Census Bureau. Archived from the original on February 13, 2020. Retrieved March 14, 2016.
- "Selected Economic Characteristics – 2006-2010 American Community Survey 5-Year Estimates". United States Census Bureau. Archived from the original on February 13, 2020. Retrieved March 14, 2016.
- "Geographic Change Notes for North Dakota". United States Census Bureau. Archived from the original (TXT) on October 10, 2012. Retrieved June 17, 2010.
- Leip, David. "Atlas of US Presidential Elections". uselectionatlas.org. Retrieved April 12, 2018.
Further reading
Kane, Joseph Nathan; Charles Curry Aiken (2004). The American Counties: Origins of County Names, Dates of Creation, and Population Data, 1950-2000. Scarecrow Press. p. 116. ISBN 0-8108-5036-2.
External links
- Official website
- Grant County maps, Sheet 1 (northern) and Sheet 2 (southern), North Dakota DOT
Places adjacent to Grant County, North Dakota | ||||||||||||||||
|---|---|---|---|---|---|---|---|---|---|---|---|---|---|---|---|---|
| ||||||||||||||||
Municipalities and communities of Grant County, North Dakota, United States | ||
|---|---|---|
County seat: Carson | ||
| Cities |  | |
| Townships |
| |
| Unorganized territories |
| |
| CDPs |
| |
| Other communities |
| |
| Ghost town |
| |
| ||
Bismarck (capital) | ||
| Topics |
|  Seal of North Dakota |
| Society |
| |
| Regions |
| |
| Larger cities pop. over 5,000 |
| |
| Smaller cities pop. 1,000–5,000 |
| |
| Counties |
| |
Authority control | |
|---|---|
| General | |
| National libraries | |
На других языках
- [en] Grant County, North Dakota
[ru] Грант (округ, Северная Дакота)
Округ Грант (англ. Grant County) — округ в центральной части штата Северная Дакота в США. Население — 2841 человек (перепись 2000 года). Административный центр — Карсон.Другой контент может иметь иную лицензию. Перед использованием материалов сайта WikiSort.org внимательно изучите правила лицензирования конкретных элементов наполнения сайта.
WikiSort.org - проект по пересортировке и дополнению контента Википедии