world.wikisort.org - USA
Sheridan County is a county located in the U.S. state of North Dakota. As of the 2020 census, the population was 1,265,[1] making it the third-least populous county in North Dakota. Its county seat is McClusky.[2]
Sheridan County | |
|---|---|
U.S. county | |
 Sheridan County Courthouse (McClusky, North Dakota) | |
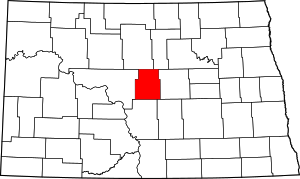 Location within the U.S. state of North Dakota | |
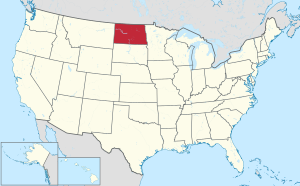 North Dakota's location within the U.S. | |
| Coordinates: 47°35′N 100°20′W | |
| Country | |
| State | |
| Founded | January 4, 1873 (created) December 24, 1908 (organized) |
| Named for | Philip Henry Sheridan |
| Seat | McClusky |
| Largest city | McClusky |
| Area | |
| • Total | 1,006 sq mi (2,610 km2) |
| • Land | 972 sq mi (2,520 km2) |
| • Water | 33 sq mi (90 km2) 3.3% |
| Population (2020) | |
| • Total | 1,265 |
| • Estimate (2021) | 1,268 |
| • Density | 1.3/sq mi (0.49/km2) |
| Time zone | UTC−6 (Central) |
| • Summer (DST) | UTC−5 (CDT) |
| Congressional district | At-large |
History
The Dakota Territory legislature created the county on January 4, 1873, naming it for Civil War General Philip Henry Sheridan. The county organization was not completed at that time, but the new county was not attached to another county for administrative or judicial purposes. In 1883 and again in 1887, the county boundaries were reduced, and on November 8, 1892, the county was dissolved, its remaining territory assigned to McLean. This lasted until the November 3, 1908 election, when McLean County voters chose to partition off the eastern portion of that unit into a new county, although the new boundaries were somewhat different from the former Sheridan. The new county government was effected on December 24 of that year.[3][4][5]
Sheridan has been severely affected by out-migration; its population collapsed from 7,373 in 1930 to 1,321 by 2010.[6] Its population decline of 38.4% from 1990 to 2016 was the highest among all North Dakota counties.[7]

Geography
The terrain of Sheridan County consists of dry rolling hills, dotted with lakes and ponds. The area is largely devoted to agriculture.[8] The terrain slopes to the north and east, with its highest point on the eastern part of its southern boundary at 2,034' (620m) ASL.[9] The county has a total area of 1,006 square miles (2,610 km2), of which 972 square miles (2,520 km2) is land and 33 square miles (85 km2) (3.3%) is water.[10]
Major highways
 U.S. Highway 52
 North Dakota Highway 14
 North Dakota Highway 53
 North Dakota Highway 200
Adjacent counties
- McHenry County - north
- Pierce County - northeast
- Wells County - east
- Kidder County - southeast
- Burleigh County - south
- McLean County - west
National protected area
- Sheyenne Lake National Wildlife Refuge
Lakes[8]
- Bentz Lake
- Cherry Lake
- Coal Mine Lake
- Ebel Lake
- Guyes Lake
- Heckers Lake
- Kandt Lake
- Krueger Lake
- Lake Richard (part)
- Lone Tree Lake
- Moesner Lake
- Pelican Lake (part)
- Postel Lake
- Salt Lake (part)
- Sand Lake
- Sheyenne Lake
Demographics
| Historical population | |||
|---|---|---|---|
| Census | Pop. | %± | |
| 1910 | 8,103 | — | |
| 1920 | 7,935 | −2.1% | |
| 1930 | 7,373 | −7.1% | |
| 1940 | 6,616 | −10.3% | |
| 1950 | 5,253 | −20.6% | |
| 1960 | 4,350 | −17.2% | |
| 1970 | 3,232 | −25.7% | |
| 1980 | 2,819 | −12.8% | |
| 1990 | 2,148 | −23.8% | |
| 2000 | 1,710 | −20.4% | |
| 2010 | 1,321 | −22.7% | |
| 2020 | 1,265 | −4.2% | |
| 2021 (est.) | 1,268 | 0.2% | |
| U.S. Decennial Census[11] 1790-1960[12] 1900-1990[13] 1990-2000[14] 2010-2020[1] | |||
2000 census
As of the 2000 census, there were 1,710 people, 731 households, and 515 families in the county. The population density was 1.76/sqmi (0.68/km2). There were 924 housing units at an average density of 0.95/sqmi (0.37/km2). The racial makeup of the county was 99.24% White, 0.12% Black or African American, 0.41% Native American, 0.06% from other races, and 0.18% from two or more races. 0.35% of the population were Hispanic or Latino of any race. 72.3% were of German and 12.5% Norwegian ancestry.
There were 731 households, out of which 25.00% had children under the age of 18 living with them, 62.80% were married couples living together, 4.40% had a female householder with no husband present, and 29.50% were non-families. 27.50% of all households were made up of individuals, and 16.70% had someone living alone who was 65 years of age or older. The average household size was 2.31 and the average family size was 2.80.
The county population contained 21.40% under the age of 18, 3.80% from 18 to 24, 19.90% from 25 to 44, 28.30% from 45 to 64, and 26.60% who were 65 years of age or older. The median age was 48 years. For every 100 females there were 105.80 males. For every 100 females age 18 and over, there were 104.30 males.
The median income for a household in the county was $24,450, and the median income for a family was $30,156. Males had a median income of $21,094 versus $14,327 for females. The per capita income for the county was $13,283. About 16.00% of families and 21.00% of the population were below the poverty line, including 24.90% of those under age 18 and 18.30% of those age 65 or over.
2010 census
As of the 2010 census, there were 1,321 people, 645 households, and 417 families in the county.[15] The population density was 1.36/sqmi (0.52/km2). There were 894 housing units at an average density of 0.92/sqmi (0.36/km2).[16] The racial makeup of the county was 96.7% white, 1.1% American Indian, 0.3% black or African American, 0.2% Pacific islander, 0.2% Asian, 0.4% from other races, and 1.2% from two or more races. Those of Hispanic or Latino origin made up 1.2% of the population.[15] In terms of ancestry, 70.1% were German, 14.2% were Norwegian, 6.3% were English, 6.0% were Russian, and 1.8% were American.[17]
Of the 645 households, 17.5% had children under the age of 18 living with them, 54.3% were married couples living together, 5.7% had a female householder with no husband present, 35.3% were non-families, and 33.0% of all households were made up of individuals. The average household size was 2.05 and the average family size was 2.55. The median age was 53.4 years.[15]
The median income for a household in the county was $37,727 and the median income for a family was $43,906. Males had a median income of $30,833 versus $24,583 for females. The per capita income for the county was $24,286. About 15.0% of families and 18.9% of the population were below the poverty line, including 31.1% of those under age 18 and 19.7% of those age 65 or over.[18]
Communities
Cities
Census-designated place
Unincorporated communities[8]
- Lincoln Valley
- Pickardville
Townships
- Berlin
- Boone
- Denhoff
- Edgemont
- Fairview
- Goodrich
- Highland
- Lincoln Dale
- Martin
- Mauch
- McClusky
- Pickard
- Prophets
- Rosenfield
Defunct townships
Politics
Sheridan County voters have been reliably Republican for decades. In no national election since 1936 has the county selected the Democratic Party candidate (as of 2016).
| Year | Republican | Democratic | Third party | |||
|---|---|---|---|---|---|---|
| No. | % | No. | % | No. | % | |
| 2020 | 688 | 84.73% | 104 | 12.81% | 20 | 2.46% |
| 2016 | 650 | 82.59% | 95 | 12.07% | 42 | 5.34% |
| 2012 | 642 | 78.10% | 163 | 19.83% | 17 | 2.07% |
| 2008 | 555 | 69.12% | 229 | 28.52% | 19 | 2.37% |
| 2004 | 727 | 77.01% | 200 | 21.19% | 17 | 1.80% |
| 2000 | 707 | 76.19% | 161 | 17.35% | 60 | 6.47% |
| 1996 | 566 | 60.15% | 252 | 26.78% | 123 | 13.07% |
| 1992 | 589 | 50.13% | 276 | 23.49% | 310 | 26.38% |
| 1988 | 885 | 67.15% | 428 | 32.47% | 5 | 0.38% |
| 1984 | 1,075 | 77.01% | 306 | 21.92% | 15 | 1.07% |
| 1980 | 1,326 | 82.51% | 208 | 12.94% | 73 | 4.54% |
| 1976 | 935 | 60.87% | 569 | 37.04% | 32 | 2.08% |
| 1972 | 1,460 | 80.71% | 334 | 18.46% | 15 | 0.83% |
| 1968 | 1,295 | 74.99% | 350 | 20.27% | 82 | 4.75% |
| 1964 | 1,187 | 62.11% | 724 | 37.89% | 0 | 0.00% |
| 1960 | 1,552 | 73.98% | 539 | 25.69% | 7 | 0.33% |
| 1956 | 1,646 | 77.71% | 472 | 22.29% | 0 | 0.00% |
| 1952 | 2,016 | 87.31% | 267 | 11.56% | 26 | 1.13% |
| 1948 | 1,554 | 78.92% | 372 | 18.89% | 43 | 2.18% |
| 1944 | 1,910 | 82.76% | 386 | 16.72% | 12 | 0.52% |
| 1940 | 2,405 | 81.33% | 543 | 18.36% | 9 | 0.30% |
| 1936 | 834 | 29.81% | 1,150 | 41.10% | 814 | 29.09% |
| 1932 | 468 | 19.08% | 1,945 | 79.29% | 40 | 1.63% |
| 1928 | 1,242 | 56.61% | 944 | 43.03% | 8 | 0.36% |
| 1924 | 594 | 34.66% | 49 | 2.86% | 1,071 | 62.49% |
| 1920 | 1,776 | 92.12% | 134 | 6.95% | 18 | 0.93% |
| 1916 | 807 | 70.05% | 310 | 26.91% | 35 | 3.04% |
| 1912 | 306 | 32.01% | 170 | 17.78% | 480 | 50.21% |
See also
- National Register of Historic Places listings in Sheridan County, North Dakota
References
- "U.S. Census Bureau QuickFacts: Sheridan County, North Dakota". www.census.gov. United States Census Bureau. Retrieved March 27, 2022.
- "Find a County". National Association of Counties. Retrieved June 7, 2011.
- "Sheridan County - Main Page". Archived from the original on September 29, 2011. Retrieved May 5, 2011.
- "County History". Official Portal for North Dakota State Government. Archived from the original on February 2, 2015. Retrieved May 4, 2011.
- "Dakota Territory, South Dakota, and North Dakota: Individual County Chronologies". Dakota Territory Atlas of Historical County Boundaries. The Newberry Library. 2006. Archived from the original on April 2, 2018. Retrieved February 23, 2019.
- Wilkerson, Isabel (January 3, 1990). With Rural Towns Vanishing, States Choose Which to Save, The New York Times
- (April 11, 2017). Population Decline; The Hardest Hit Counties In Each State Since 1990, Lost Americana, Retrieved October 24, 2017.
- Sheridan County ND Google Maps (accessed February 23, 2019)
- ""Find an Altitude/Sheridan County ND" Google Maps (accessed February 23, 2019)". Archived from the original on May 21, 2019. Retrieved February 24, 2019.
- "2010 Census Gazetteer Files". United States Census Bureau. August 22, 2012. Archived from the original on January 29, 2015. Retrieved February 1, 2015.
- "United States Decennial Census". United States Census Bureau. Retrieved February 1, 2015.
- "Historical Census Browser". University of Virginia Library. Retrieved February 1, 2015.
- Forstall, Richard L., ed. (April 20, 1995). "Population of Counties by Decennial Census: 1900 to 1990". United States Census Bureau. Retrieved February 1, 2015.
- "Census 2000 PHC-T-4. Ranking Tables for Counties: 1990 and 2000" (PDF). United States Census Bureau. April 2, 2001. Retrieved February 1, 2015.
- "Profile of General Population and Housing Characteristics: 2010 Demographic Profile Data". United States Census Bureau. Archived from the original on February 13, 2020. Retrieved April 3, 2016.
- "Population, Housing Units, Area, and Density: 2010 - County". United States Census Bureau. Archived from the original on February 13, 2020. Retrieved April 3, 2016.
- "Selected Social Characteristics in the US – 2006-2010 American Community Survey 5-Year Estimates". United States Census Bureau. Archived from the original on February 13, 2020. Retrieved April 3, 2016.
- "Selected Economic Characteristics – 2006-2010 American Community Survey 5-Year Estimates". United States Census Bureau. Archived from the original on February 13, 2020. Retrieved April 3, 2016.
- US Census boundary changes - North Dakota
- Leip, David. "Atlas of US Presidential Elections". uselectionatlas.org. Retrieved April 13, 2018.
External links
- Sheridan County official website
- Sheridan County GenWeb - Genealogy Links
- Sheridan County map, North Dakota DOT
Places adjacent to Sheridan County, North Dakota | ||||||||||||||||
|---|---|---|---|---|---|---|---|---|---|---|---|---|---|---|---|---|
| ||||||||||||||||
Municipalities and communities of Sheridan County, North Dakota, United States | ||
|---|---|---|
County seat: McClusky | ||
| Cities | 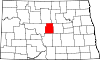 | |
| Townships |
| |
| Unorganized territories |
| |
| CDP | ||
| Other community |
| |
| ||
Bismarck (capital) | ||
| Topics |
|  Seal of North Dakota |
| Society |
| |
| Regions |
| |
| Larger cities pop. over 5,000 |
| |
| Smaller cities pop. 1,000–5,000 |
| |
| Counties |
| |
Authority control | |
|---|---|
| General | |
| National libraries | |
На других языках
- [en] Sheridan County, North Dakota
[ru] Шеридан (округ, Северная Дакота)
Округ Шеридан (англ. Sheridan County) — округ в центральной части штата Северная Дакота в США. Население — 1710 человек (перепись 2000 года). Административный центр — Маккласки.Другой контент может иметь иную лицензию. Перед использованием материалов сайта WikiSort.org внимательно изучите правила лицензирования конкретных элементов наполнения сайта.
WikiSort.org - проект по пересортировке и дополнению контента Википедии