world.wikisort.org - USA
Canadian County is a county located in the U.S. state of Oklahoma. As of the 2020 census, the population was 154,405,[1] making it the fifth most populous county in Oklahoma. Its county seat is El Reno.[2]
Canadian County | |
|---|---|
U.S. county | |
 Canadian County Jail and Stable in El Reno (2014) | |
 Location within the U.S. state of Oklahoma | |
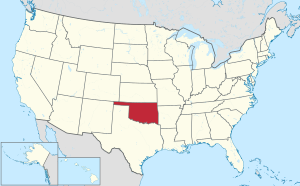 Oklahoma's location within the U.S. | |
| Coordinates: 35°32′N 97°59′W | |
| Country | |
| State | |
| Founded | March, 1890 |
| Named for | Canadian River |
| Seat | El Reno |
| Largest city | Oklahoma City |
| Area | |
| • Total | 906 sq mi (2,350 km2) |
| • Land | 897 sq mi (2,320 km2) |
| • Water | 9.0 sq mi (23 km2) 1.0%% |
| Population (2010) | |
| • Total | 115,541 |
| • Estimate (2019) | 148,306 |
| • Density | 129/sq mi (50/km2) |
| Time zone | UTC−6 (Central) |
| • Summer (DST) | UTC−5 (CDT) |
| Congressional districts | 3rd, 4th |
| Website | www |
The county is named for the Canadian River, which forms part of its southern border. The river may have been named for early European explorers who were fur traders and trappers from New France, or pre-1763 colonial Canada.[3]
Canadian County is part of the Oklahoma City Metropolitan Statistical Area.
History
In 1859, the United States expelled the Caddo Nation of Louisiana from its Brazos reservation in Texas and relocated it to what would eventually become Canadian County, Oklahoma.[4][5] Showetat, the last hereditary chief of the Caddo, set up his camp here and is considered Canadian County's first permanent resident. (Union City developed near his camp site.)[6]
The federal government relocated the Wichita tribe to this same part of Indian Territory in 1861. By the Treaty of Medicine Lodge, the United States assigned the land west of the Caddo and Wichita to the Cheyenne and Arapaho tribes. They were relocated from Colorado in 1869. The Cheyenne-Arapaho Agency (later renamed the Darlington Agency) was established in 1870.
Canadian County was formed in 1889 as County Four of Oklahoma Territory as part of the Oklahoma Organic Act, which created Oklahoma Territory from part of Indian Territory.[6] It was named after the Canadian River, which runs through the county.
This county was settled by European-Americans after the April 22, 1889, land run, which gave away expropriated Native American land.[6] It was expanded by a second land run in 1892. In 1902, after distribution of communal lands among households of the Cheyenne and Arapaho, their 'surplus' lands were opened to European-American settlement.[6] El Reno was chosen as the county seat over competitors Reno City, Frisco, and Canadian City.
The county was the location of the last great battle of the Cheyenne and Arapaho against United States Army forces.
Geography
According to the U.S. Census Bureau, the county has a total area of 906 square miles (2,350 km2), of which 897 square miles (2,320 km2) is land and 9.0 square miles (23 km2) (1.0%) is water.[7] The county lies mostly within the Red Bed Plains, a subregion of the Osage Plains physiographic region. Its northwestern corner is in the Gypsum Hills. The county is drained by the North Canadian River and the Canadian River, which both flow through the county from northwest to southeast.[6]
According to a study published by the Oklahoma Geological Survey, the North Canadian River drains about 40 percent of the county, the Canadian River drains about 32 percent, and the Cimarron River drains about 27 percent (mostly in the northeastern part of the county). About 1 percent of the county is drained by Sugar Creek, which empties into the Washita River, itself a tributary of the Red River.[8]
The North Canadian River enters Canadian County near the northwest corner, flows generally southeast towards the middle of the county, then turns southward to leave the county about 8 miles (13 km) north of the southeastern corner. The river length is about 76 miles (122 km). The elevation drops from 1,420 feet (430 m) at the entry to about 1,200 feet (370 m) at the exit. Its named tributaries are Sixmile Creek, Fourmile Creek, Purcell Creek, Shell Creek, and Mustang Creek.[9]
The Canadian River enters the western border of the county about 11 miles (18 km) north of the southwest corner at an elevation of 1,370 feet (420 m) and flows southeast about 16 miles (26 km), where it becomes the southern border of the county. Its course within the county is 45 miles (72 km) long, and the elevation where it leaves the county is 1,150 feet (350 m). Named tributaries include Dry Creek and Boggy Creek.[10]
The Cimarron River does not flow through the county, but drains part of the northeastern area via its tributaries: Kingfisher, Dead Indian, Uncle John, Cottonwood, Soldier, and Deer creeks. The Washita River flows more than 20 miles (32 km) south of the county, but drains about 5 square miles (13 km2) in the southwest corner of Canadian County.[11]
Adjacent counties
- Kingfisher County (north)
- Logan County (northeast)
- Oklahoma County (east)
- Cleveland County (southeast)
- Grady County (south)
- Caddo County (southwest)
- Blaine County (northwest)
Demographics
| Historical population | |||
|---|---|---|---|
| Census | Pop. | %± | |
| 1890 | 7,158 | — | |
| 1900 | 15,981 | 123.3% | |
| 1910 | 23,501 | 47.1% | |
| 1920 | 22,288 | −5.2% | |
| 1930 | 28,115 | 26.1% | |
| 1940 | 27,329 | −2.8% | |
| 1950 | 25,644 | −6.2% | |
| 1960 | 24,727 | −3.6% | |
| 1970 | 32,245 | 30.4% | |
| 1980 | 56,452 | 75.1% | |
| 1990 | 74,409 | 31.8% | |
| 2000 | 87,697 | 17.9% | |
| 2010 | 115,541 | 31.8% | |
| 2020 | 154,405 | 33.6% | |
| 2021 (est.) | 161,737 | [12] | 4.7% |
| U.S. Decennial Census[13] 1790-1960[14] 1900-1990[15] 1990-2000[16] 2010-2019[17] | |||
![Age pyramid for Canadian County, Oklahoma, based on census 2000 data[18]](http://upload.wikimedia.org/wikipedia/commons/thumb/9/98/USA_Canadian_County%2C_Oklahoma_age_pyramid.svg/200px-USA_Canadian_County%2C_Oklahoma_age_pyramid.svg.png)
As of the census[18] of 2000, there were 87,697 people, 31,484 households, and 24,431 families residing in the county. The population density was 98 people per square mile (38/km2). There were 33,969 housing units at an average density of 38 per square mile (15/km2). The racial makeup of the county was 87.01% White, 2.16% Black or African American, 4.27% Native American, 2.45% Asian, 0.05% Pacific Islander, 1.35% from other races, and 2.72% from two or more races. 3.86% of the population were Hispanic or Latino of any race.
There were 31,484 households, out of which 39.80% had children under the age of 18 living with them, 64.30% were married couples living together, 9.70% had a female householder with no husband present, and 22.40% were non-families. 19.20% of all households were made up of individuals, and 7.10% had someone living alone who was 65 years of age or older. The average household size was 2.71 and the average family size was 3.10.
In the county, the population was spread out, with 28.00% under the age of 18, 8.20% from 18 to 24, 30.70% from 25 to 44, 23.50% from 45 to 64, and 9.50% who were 65 years of age or older. The median age was 35 years. For every 100 females, there were 99.40 males. For every 100 females age 18 and over, there were 97.70 males.
The median income for a household in the county was $45,439, and the median income for a family was $51,180. Males had a median income of $35,944 versus $24,631 for females. The per capita income for the county was $19,691. About 5.80% of families and 7.90% of the population were below the poverty line, including 9.70% of those under age 18 and 7.20% of those age 65 or over.
Politics
| Voter Registration and Party Enrollment as of September 30, 2022[19] | |||||
|---|---|---|---|---|---|
| Party | Number of Voters | Percentage | |||
| Republican | 56,604 | 59.93% | |||
| Democratic | 19,827 | 20.99% | |||
| Libertarian | 983 | 1.04% | |||
| Unaffiliated | 17,033 | 18.03% | |||
| Total | 94,447 | 100% | |||
| Year | Republican | Democratic | Third party | |||
|---|---|---|---|---|---|---|
| No. | % | No. | % | No. | % | |
| 2020 | 43,550 | 70.31% | 16,742 | 27.03% | 1,648 | 2.66% |
| 2016 | 39,986 | 72.34% | 11,674 | 21.12% | 3,618 | 6.55% |
| 2012 | 35,625 | 77.17% | 10,537 | 22.83% | 0 | 0.00% |
| 2008 | 36,428 | 76.12% | 11,426 | 23.88% | 0 | 0.00% |
| 2004 | 33,297 | 77.42% | 9,712 | 22.58% | 0 | 0.00% |
| 2000 | 22,679 | 72.32% | 8,367 | 26.68% | 314 | 1.00% |
| 1996 | 18,139 | 59.40% | 8,977 | 29.40% | 3,420 | 11.20% |
| 1992 | 16,756 | 50.70% | 7,215 | 21.83% | 9,079 | 27.47% |
| 1988 | 17,872 | 70.00% | 7,453 | 29.19% | 205 | 0.80% |
| 1984 | 20,929 | 79.52% | 5,245 | 19.93% | 146 | 0.55% |
| 1980 | 15,272 | 72.58% | 4,889 | 23.24% | 880 | 4.18% |
| 1976 | 9,766 | 56.32% | 7,288 | 42.03% | 285 | 1.64% |
| 1972 | 11,400 | 78.28% | 2,751 | 18.89% | 413 | 2.84% |
| 1968 | 5,891 | 49.12% | 3,577 | 29.83% | 2,525 | 21.05% |
| 1964 | 5,193 | 47.47% | 5,747 | 52.53% | 0 | 0.00% |
| 1960 | 5,697 | 57.37% | 4,234 | 42.63% | 0 | 0.00% |
| 1956 | 5,702 | 59.41% | 3,896 | 40.59% | 0 | 0.00% |
| 1952 | 7,289 | 63.43% | 4,203 | 36.57% | 0 | 0.00% |
| 1948 | 3,729 | 40.11% | 5,568 | 59.89% | 0 | 0.00% |
| 1944 | 4,674 | 49.24% | 4,800 | 50.57% | 18 | 0.19% |
| 1940 | 4,699 | 45.90% | 5,506 | 53.79% | 32 | 0.31% |
| 1936 | 3,325 | 34.97% | 6,135 | 64.52% | 48 | 0.50% |
| 1932 | 2,549 | 27.36% | 6,767 | 72.64% | 0 | 0.00% |
| 1928 | 5,011 | 63.63% | 2,786 | 35.38% | 78 | 0.99% |
| 1924 | 3,070 | 41.50% | 3,065 | 41.44% | 1,262 | 17.06% |
| 1920 | 3,881 | 52.14% | 3,268 | 43.90% | 295 | 3.96% |
| 1916 | 1,590 | 37.33% | 2,200 | 51.66% | 469 | 11.01% |
| 1912 | 1,794 | 42.49% | 2,047 | 48.48% | 381 | 9.02% |
Government and infrastructure
The Federal Bureau of Prisons operates the Federal Correctional Institution, El Reno in El Reno, Canadian County.[21]
Economy
Agriculture has been a mainstay of the economy since the beginning of non-Indigenous settlement in the late 1800s.
Transportation
Major highways
 I-40
I-40 I-40 BL
 US 81
US 81 US 270
 US 281
 SH-3
SH-3 SH-4
SH-4 SH-8
SH-8 SH-37
SH-37 SH-66
SH-66 SH-92
SH-92 SH-152
Airports
- Clarence E. Page Municipal Airport is a public use airport located in Canadian County, 15 nautical miles (28 km) west of the central business district of Oklahoma City, which also owns this airport.[22]
- Sundance Airpark is a public use airport located in Canadian County, 11 nautical miles (20 km) northwest of the central business district of Oklahoma City. This airport is privately owned.[23]
- El Reno Regional Airport, El Reno, OK
Communities
Cities
- El Reno (county seat)
- Geary (partly in Blaine County)
- Mustang
- Oklahoma City (mostly in Oklahoma County)
- Piedmont (partly in Kingfisher County)
- Yukon
Towns
- Calumet
- Okarche (partly in Kingfisher County)
- Union City
Census-designated place
Other unincorporated communities
- Concho
- Four Counties Corner (formerly Lockridge)
- Scott (partly in Caddo County)
Education
School districts include:[24]
K-12:
- Calumet Public Schools
- Cashion Public Schools
- Deer Creek Public Schools
- El Reno Public Schools
- Geary Public Schools
- Hinton Public Schools
- Lookeba-Sickles Public Schools
- Minco Public Schools
- Mustang Public Schools
- Okarche Public Schools
- Piedmont Public Schools
- Union City Public Schools
- Yukon Public Schools
Elementary:
- Banner Public School
- Darlington Public School
- Maple Public School
- Riverside Public School
NRHP sites
The following sites in Canadian County are listed on the National Register of Historic Places:
|
|
References
- "U.S. Census Bureau QuickFacts: McClain County, Oklahoma; United States". www.census.gov. Retrieved August 6, 2022.
- "Find a County". National Association of Counties. Archived from the original on May 31, 2011. Retrieved June 7, 2011.
- Oklahoma Historical Society. "Origin of County Names in Oklahoma" Archived August 14, 2017, at the Wayback Machine, Chronicles of Oklahoma 2:1 (March 1924) 75-82 (retrieved August 18, 2006).
- Klos, George (April 1994). "'Our People Could Not Distinguish One Tribe from Another': The 1859 Expulsion of the Reserve Indians from Texas". The Southwestern Historical Quarterly. 97 (4): 615–16. JSTOR 30242464 – via JSTOR.
- Franks, Kenny Arthur (1997). Oklahoma: The Land and Its People. Norman, Oklahoma: University of Oklahoma Press. p. 18. ISBN 9780806199443.
- Thomas L. Hedglen, "Canadian County," Encyclopedia of Oklahoma History and Culture, 2009. Accessed March 28, 2015.
- "2010 Census Gazettwhen?eer Files". United States Census Bureau. August 22, 2012. Retrieved February 18, 2015.
- Mogg, et al., p. 14.
- Mogg, et al., pp. 15-16.
- Mogg, et al., pp. 17-18.
- Mogg, et al., p.18.
- "U.S. Census Bureau QuickFacts". United States Census Bureau. Retrieved August 6, 2022.
- "U.S. Decennial Census". United States Census Bureau. Retrieved February 18, 2016.
- "Historical Census Browser". University of Virginia Library. Retrieved February 18, 2015.
- Forstall, Richard L., ed. (March 27, 1995). "Population of Counties by Decennial Census: 1900 to 1990". United States Census Bureau. Retrieved February 18, 2015.
- "Census 2000 PHC-T-4. Ranking Tables for Counties: 1990 and 2000" (PDF). United States Census Bureau. April 2, 2001. Archived (PDF) from the original on March 27, 2010. Retrieved February 18, 2015.
- "State & County QuickFacts". United States Census Bureau. Archived from the original on June 6, 2011. Retrieved April 27, 2014.
- "U.S. Census website". United States Census Bureau. Retrieved January 31, 2008.
- "Current Registration Statistics by County" (PDF). ok.gov. September 30, 2022. Retrieved October 13, 2022.
{{cite news}}: CS1 maint: url-status (link) - Leip, David. "Dave Leip's Atlas of U.S. Presidential Elections". uselectionatlas.org. Retrieved March 28, 2018.
- "FCI El Reno Contact Information." Federal Bureau of Prisons. Retrieved on October 1, 2010.
- FAA Airport Form 5010 for RCE PDF. Federal Aviation Administration. Effective December 17, 2009.
- FAA Airport Form 5010 for HSD PDF. Federal Aviation Administration. Effective December 17, 2009.
- "2020 CENSUS - SCHOOL DISTRICT REFERENCE MAP: Canadian County, OK" (PDF). U.S. Census Bureau. Archived (PDF) from the original on October 10, 2022. Retrieved July 23, 2022. - Text list
Further reading
External links
- Canadian County Government website
- Encyclopedia of Oklahoma History and Culture - Canadian County
- Oklahoma Digital Maps: Digital Collections of Oklahoma and Indian Territory
- Mogg, Joe L., Stuart L. Schoff and E. W. Reed. Ground Water Resources of Canadian County, Oklahoma. Oklahoma Geological Society Bulletin No. 87. 1960. Accessed June 20, 2016.
Places adjacent to Canadian County, Oklahoma | |
|---|---|
Municipalities and communities of Canadian County, Oklahoma, United States | ||
|---|---|---|
County seat: El Reno | ||
| Cities |  | |
| Towns | ||
| CDP | ||
| Other communities | ||
| Footnotes | ‡This populated place also has portions in an adjacent county or counties | |
| ||
Authority control | |
|---|---|
| General | |
| National libraries | |
На других языках
[de] Canadian County
Das Canadian County[1] ist ein County im US-Bundesstaat Oklahoma. Bei der Volkszählung im Jahr 2010 hatte das County 115.541 Einwohner und eine Bevölkerungsdichte von 49,6 Einwohnern pro Quadratkilometer. Der Verwaltungssitz (County Seat) ist El Reno, das nach Jesse Lee Reno benannt wurde, einem General der im Amerikanischen Bürgerkrieg getötet wurde.- [en] Canadian County, Oklahoma
[ru] Канейдиан (округ)
Округ Канейдиан (англ. Canadian County) располагается в штате Оклахома, США. Официально образован в 1890 году. По состоянию на 2013 год, численность населения составляла 126 123 человека.Другой контент может иметь иную лицензию. Перед использованием материалов сайта WikiSort.org внимательно изучите правила лицензирования конкретных элементов наполнения сайта.
WikiSort.org - проект по пересортировке и дополнению контента Википедии