world.wikisort.org - Philippines
Amulung, officially the Municipality of Amulung, is a 2nd class municipality in the province of Cagayan, Philippines. According to the 2020 census, it has a population of 50,336 people. [3]
Amulung | |
|---|---|
Municipality | |
| Municipality of Amulung | |
 Flag  Seal | |
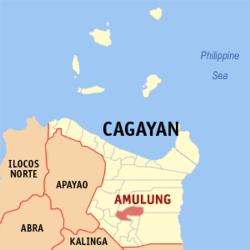 Map of Cagayan with Amulung highlighted | |
OpenStreetMap  | |
 Amulung Location within the Philippines | |
| Coordinates: 17°50′19″N 121°43′25″E | |
| Country | Philippines |
| Region | Cagayan Valley |
| Province | Cagayan |
| District | 3rd district |
| Barangays | 47 (see Barangays) |
| Government | |
| • Type | Sangguniang Bayan |
| • Mayor | Elpidio R. Rendon |
| • Vice Mayor | Nicanor D. De Leon |
| • Representative | Joseph L. Lara |
| • Electorate | 30,740 voters (2019) |
| Area | |
| • Total | 242.20 km2 (93.51 sq mi) |
| Elevation | 21 m (69 ft) |
| Highest elevation | 85 m (279 ft) |
| Lowest elevation | 7 m (23 ft) |
| Population | |
| • Total | 50,336 |
| • Density | 210/km2 (540/sq mi) |
| • Households | 10,616 |
| Economy | |
| • Income class | 2nd municipal income class |
| • Poverty incidence | 15.46% (2018)[4] |
| • Revenue | ₱193,330,730.60 (2020) |
| • Assets | ₱618,065,479.49 (2020) |
| • Expenditure | ₱176,097,966.27 (2020) |
| • Liabilities | ₱152,555,490.20 (2020) |
| Service provider | |
| • Electricity | Cagayan 1 Electric Cooperative (CAGELCO 1) |
| Time zone | UTC+8 (PST) |
| ZIP code | 3505 |
| PSGC | |
| IDD : area code | +63 (0)78 |
| Native languages | Ibanag Ilocano Itawis Tagalog |
Amulung is 24 kilometres (15 mi) from Tuguegarao and 505 kilometres (314 mi) from Manila.
Etymology
From the fruit tree Goniothalamus amuyon or amuyon/amuyong in Ilocano.
Fr. Jose Bugarin's dictionary "amulung, a type of vine, with fig-like leaves, well used for reducing swelling/inflammation [also] the name of a town in this province."
Geography
Barangays
Amulung is politically subdivided into 47 barangays. These barangays are headed by elected officials: Barangay Captain, Barangay Council, whose members are called Barangay Councilors. All are elected every three years.
- Abolo
- Agguirit
- Alitungtung
- Annabuculan
- Annafatan
- Anquiray
- Babayuan
- Baccuit
- Bacring
- Baculud
- Balauini
- Bauan
- Bayabat
- Calamagui
- Calintaan
- Caratacat
- Casingsingan Norte
- Casingsingan Sur
- Catarauan
- Centro
- Concepcion
- Cordova
- Dadda
- Dafunganay
- Dugayung
- Estefania
- Gabut
- Gangauan
- Goran
- Jurisdiccion
- La Suerte
- Logung
- Magogod
- Manalo
- Marobbob
- Masical
- Monte Alegre
- Nabbialan
- Nagsabaran
- Nangalasauan
- Nanuccauan
- Pacac-Grande
- Pacac-Pequeño
- Palacu
- Palayag
- Tana
- Unag
Climate
| Climate data for Amulung, Cagayan | |||||||||||||
|---|---|---|---|---|---|---|---|---|---|---|---|---|---|
| Month | Jan | Feb | Mar | Apr | May | Jun | Jul | Aug | Sep | Oct | Nov | Dec | Year |
| Average high °C (°F) | 24 (75) |
25 (77) |
28 (82) |
31 (88) |
31 (88) |
31 (88) |
30 (86) |
30 (86) |
29 (84) |
28 (82) |
26 (79) |
24 (75) |
28 (83) |
| Average low °C (°F) | 20 (68) |
20 (68) |
21 (70) |
23 (73) |
24 (75) |
24 (75) |
24 (75) |
24 (75) |
24 (75) |
23 (73) |
23 (73) |
21 (70) |
23 (73) |
| Average precipitation mm (inches) | 150 (5.9) |
106 (4.2) |
84 (3.3) |
48 (1.9) |
103 (4.1) |
115 (4.5) |
134 (5.3) |
156 (6.1) |
136 (5.4) |
240 (9.4) |
246 (9.7) |
300 (11.8) |
1,818 (71.6) |
| Average rainy days | 19 | 14.3 | 12.8 | 10.8 | 17.7 | 18.9 | 21.5 | 23.3 | 22.1 | 20.4 | 20.3 | 22.2 | 223.3 |
| Source: Meteoblue[5] | |||||||||||||
Demographics
| Year | Pop. | ±% p.a. |
|---|---|---|
| 1903 | 6,234 | — |
| 1918 | 8,077 | +1.74% |
| 1939 | 12,295 | +2.02% |
| 1948 | 12,734 | +0.39% |
| 1960 | 18,415 | +3.12% |
| 1970 | 24,283 | +2.80% |
| 1975 | 25,732 | +1.17% |
| 1980 | 29,079 | +2.47% |
| 1990 | 35,116 | +1.90% |
| 1995 | 37,744 | +1.36% |
| 2000 | 42,754 | +2.71% |
| 2007 | 44,367 | +0.51% |
| 2010 | 45,182 | +0.66% |
| 2015 | 47,860 | +1.10% |
| 2020 | 50,336 | +1.00% |
| Source: Philippine Statistics Authority [6] [7] [8][9] | ||
In the 2020 census, the population of Amulung was 50,336 people, [3] with a density of 210 inhabitants per square kilometre or 540 inhabitants per square mile.
Economy
Government
Amulung, belonging to the third legislative district of the province of Cagayan, is governed by a mayor designated as its local chief executive and by a municipal council as its legislative body in accordance with the Local Government Code. The mayor, vice mayor, and the councilors are elected directly by the people through an election which is being held every three years.
Elected officials
| Position | Name |
|---|---|
| Congressman | Joseph L. Lara |
| Mayor | Elpidio R. Rendon |
| Vice-Mayor | Nicanor D. De Leon |
| Councilors | Mark Aljohn L. Pascual |
| Manuel M. Gola | |
| Edward M. Antonio | |
| Mark Anthony P. Baculi | |
| George P. Lim | |
| Joey B. Bargado | |
| Nerlita A. Barcellano | |
| Fernando D. De Leon | |
Education
The Schools Division of Cagayan governs the town's public education system.[18] The division office is a field office of the DepEd in Cagayan Valley region.[19] The office governs the public and private elementary and public and private high schools throughout the municipality.
References
- Municipality of Amulung | (DILG)
- "2015 Census of Population, Report No. 3 – Population, Land Area, and Population Density" (PDF). Philippine Statistics Authority. Quezon City, Philippines. August 2016. ISSN 0117-1453. Archived (PDF) from the original on May 25, 2021. Retrieved July 16, 2021.
- Census of Population (2020). "Region II (Cagayan Valley)". Total Population by Province, City, Municipality and Barangay. PSA. Retrieved 8 July 2021.
- "PSA Releases the 2018 Municipal and City Level Poverty Estimates". Philippine Statistics Authority. 15 December 2021. Retrieved 22 January 2022.
- "Amulung, Cagayan: Average Temperatures and Rainfall". Meteoblue. Retrieved 27 October 2018.
- Census of Population (2015). "Region II (Cagayan Valley)". Total Population by Province, City, Municipality and Barangay. PSA. Retrieved 20 June 2016.
- Census of Population and Housing (2010). "Region II (Cagayan Valley)". Total Population by Province, City, Municipality and Barangay. NSO. Retrieved 29 June 2016.
- Censuses of Population (1903–2007). "Region II (Cagayan Valley)". Table 1. Population Enumerated in Various Censuses by Province/Highly Urbanized City: 1903 to 2007. NSO.
- "Province of Cagayan". Municipality Population Data. Local Water Utilities Administration Research Division. Retrieved 17 December 2016.
- "Poverty incidence (PI):". Philippine Statistics Authority. Retrieved 28 December 2020.
- https://psa.gov.ph/sites/default/files/NSCB_LocalPovertyPhilippines_0.pdf; publication date: 29 November 2005; publisher: Philippine Statistics Authority.
- https://psa.gov.ph/sites/default/files/2003%20SAE%20of%20poverty%20%28Full%20Report%29_1.pdf; publication date: 23 March 2009; publisher: Philippine Statistics Authority.
- https://psa.gov.ph/sites/default/files/2006%20and%202009%20City%20and%20Municipal%20Level%20Poverty%20Estimates_0_1.pdf; publication date: 3 August 2012; publisher: Philippine Statistics Authority.
- https://psa.gov.ph/sites/default/files/2012%20Municipal%20and%20City%20Level%20Poverty%20Estima7tes%20Publication%20%281%29.pdf; publication date: 31 May 2016; publisher: Philippine Statistics Authority.
- https://psa.gov.ph/sites/default/files/City%20and%20Municipal-level%20Small%20Area%20Poverty%20Estimates_%202009%2C%202012%20and%202015_0.xlsx; publication date: 10 July 2019; publisher: Philippine Statistics Authority.
- "PSA Releases the 2018 Municipal and City Level Poverty Estimates". Philippine Statistics Authority. 15 December 2021. Retrieved 22 January 2022.
- "2019 National and Local Elections" (PDF). Commission on Elections. Retrieved March 10, 2022.
{{cite web}}: CS1 maint: url-status (link) - "History of DepED SDO Cagayan". DepED SDO Cagayan | Official Website of DepED SDO Cagayan. Retrieved March 13, 2022.
{{cite web}}: CS1 maint: url-status (link) - "DEPED REGIONAL OFFICE NO. 02". DepED RO2 | The official website of DepED Regional Office No. 02.
{{cite web}}: CS1 maint: url-status (link)
External links
Places adjacent to Amulung | ||||||||||||||||
|---|---|---|---|---|---|---|---|---|---|---|---|---|---|---|---|---|
| ||||||||||||||||
Tuguegarao (capital) | |
| Municipalities |
|
| Component city |
|
| Barangays | See: List of barangays in Cagayan |
This article about a location in Cagayan Valley region is a stub. You can help Wikipedia by expanding it. |
Другой контент может иметь иную лицензию. Перед использованием материалов сайта WikiSort.org внимательно изучите правила лицензирования конкретных элементов наполнения сайта.
WikiSort.org - проект по пересортировке и дополнению контента Википедии