world.wikisort.org - Canada
La Pointe-de-l'Île (French pronunciation: [la pwɛ̃t də lil]) is a federal electoral district in Quebec, Canada, that has been represented in the House of Commons of Canada since 2004. Its population in 2001 was 98,878.
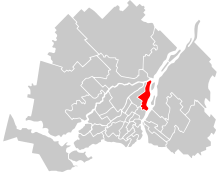 La Pointe-de-l'Île in relation to other federal electoral districts in Montreal and Laval | |||
| Coordinates: | 45.651°N 73.509°W | ||
| Federal electoral district | |||
| Legislature | House of Commons | ||
| MP |
Bloc Québécois | ||
| District created | 2003 | ||
| First contested | 2004 | ||
| Last contested | 2021 | ||
| District webpage | profile, map | ||
| Demographics | |||
| Population (2016)[1] | 106,336 | ||
| Electors (2019) | 85,589 | ||
| Area (km²)[2] | 43 | ||
| Pop. density (per km²) | 2,472.9 | ||
| Census division(s) | Montreal | ||
| Census subdivision(s) | Montreal (part), Montréal-Est | ||
The riding was created in 2003 from parts of Anjou—Rivière-des-Prairies, Hochelaga—Maisonneuve, and Mercier ridings.
Geography
The district includes the City of Montréal-Est, the neighbourhood of Pointe-aux-Trembles in the Borough of Rivière-des-Prairies–Pointe-aux-Trembles, and the eastern part of the neighbourhood of Longue-Pointe and the southern part of the neighbourhood of Mercier-Est in the Borough of Mercier–Hochelaga-Maisonneuve.
The neighbouring ridings are Hochelaga, Honoré-Mercier, Montcalm, Repentigny, Verchères—Les Patriotes, and Longueuil—Pierre-Boucher.
Demographics
- According to the Canada 2016 Census
- Languages: (2016) 83.0% French, 3.5% Spanish, 2.6% English, 2.0% Creole, 1.9% Arabic, 1.3% Italian, 0.6% Portuguese, 0.6% Romanian, 0.5% Vietnamese, 0.5% Kabyle[3]
History
The riding is located in Eastern Montreal, traditionally the power base of the Quebec sovereignty movement. It had long been reckoned as the Bloc Québécois' safest riding. However, in 2011, after the retirement of longtime MP Francine Lalonde, it fell to the New Democratic Party along with all of the other ridings in Eastern Montreal.
This riding lost territory to Hochelaga and gained territory from Honoré-Mercier during the 2012 electoral redistribution.
Member of Parliament
This riding has elected the following Members of Parliament:
| Parliament | Years | Member | Party | |
|---|---|---|---|---|
| La Pointe-de-l'Île Riding created from Anjou—Rivière-des-Prairies, Hochelaga—Maisonneuve and Mercier |
||||
| 38th | 2004–2006 | Francine Lalonde | Bloc Québécois | |
| 39th | 2006–2008 | |||
| 40th | 2008–2011 | |||
| 41st | 2011–2015 | Ève Péclet | New Democratic | |
| 42nd | 2015–2019 | Mario Beaulieu | Bloc Québécois | |
| 43rd | 2019–2021 | |||
| 44th | 2021–present | |||
Election results
| 2021 Canadian federal election | ||||||||
|---|---|---|---|---|---|---|---|---|
| Party | Candidate | Votes | % | ±% | Expenditures | |||
| Bloc Québécois | Mario Beaulieu | 23,835 | 46.7 | -0.1 | ||||
| Liberal | Jonas Fadeu | 16,508 | 32.3 | +1.9 | ||||
| New Democratic | Alexandre Vallerand | 4,954 | 9.7 | -1.2 | ||||
| Conservative | Massimo Anania | 3,427 | 6.7 | -0.5 | ||||
| People's | Jonathan Desclin | 1,399 | 2.7 | +2.0 | ||||
| Free | Agnès Falquet | 577 | 1.1 | N/A | ||||
| Indépendance du Québec | Charles Phillippe Gervais | 221 | 0.4 | ±0.0 | ||||
| Marxist–Leninist | Genevieve Royer | 159 | 0.3 | +0.1 | ||||
| Total valid votes | 51,080 | 97.6 | ||||||
| Total rejected ballots | 1,239 | 2.4 | ||||||
| Turnout | 52,319 | 62.3 | ||||||
| Registered voters | 83,970 | |||||||
| Bloc Québécois hold | Swing | -1.0 | ||||||
| Source: Elections Canada[4] | ||||||||
| 2019 Canadian federal election | ||||||||
|---|---|---|---|---|---|---|---|---|
| Party | Candidate | Votes | % | ±% | Expenditures | |||
| Bloc Québécois | Mario Beaulieu | 26,010 | 46.84 | +13.26 | $38,017.09 | |||
| Liberal | Jonathan Plamondon | 16,898 | 30.43 | +1.86 | $50,221.87 | |||
| New Democratic | Ève Péclet | 6,057 | 10.91 | -15.85 | $6,545.53 | |||
| Conservative | Robert Coutu | 3,984 | 7.17 | -0.81 | $25,219.21 | |||
| Green | Franco Fiori | 1,910 | 3.44 | none listed | ||||
| People's | Randy Manseau | 388 | 0.70 | none listed | ||||
| Indépendence du Québec | Jacinthe Lafrenaye | 199 | 0.4 | $636.28 | ||||
| Marxist–Leninist | Geneviève Royer | 88 | 0.2 | $0.00 | ||||
| Total valid votes/expense limit | 55,534 | 100.0 | ||||||
| Total rejected ballots | 1,141 | |||||||
| Turnout | 56,675 | 66.2 | ||||||
| Eligible voters | 85,589 | |||||||
| Bloc Québécois hold | Swing | +5.70 | ||||||
| Source: Elections Canada[5][6] | ||||||||
| 2015 Canadian federal election | ||||||||
|---|---|---|---|---|---|---|---|---|
| Party | Candidate | Votes | % | ±% | Expenditures | |||
| Bloc Québécois | Mario Beaulieu | 18,545 | 33.58 | +1.21 | $48,190.59 | |||
| Liberal | Marie-Chantale Simard | 15,777 | 28.57 | +18.47 | $5,384.21 | |||
| New Democratic | Ève Péclet | 14,777 | 26.76 | -20.77 | $51,626.51 | |||
| Conservative | Guy Morissette | 4,408 | 7.98 | +0.33 | $4,736.10 | |||
| Green | David J. Cox | 1,130 | 2.05 | +0.16 | – | |||
| Rhinoceros | Ben 97 Benoit | 358 | 0.65 | – | $1,062.19 | |||
| Strength in Democracy | Jean-François Larose | 135 | 0.24 | – | – | |||
| Marxist–Leninist | Geneviève Royer | 96 | 0.17 | – | – | |||
| Total valid votes/Expense limit | 55,226 | 100.00 | $222,699.43 | |||||
| Total rejected ballots | 912 | 1.62 | – | |||||
| Turnout | 56,138 | 65.43[7] | – | |||||
| Eligible voters | 84,507 | |||||||
| Bloc Québécois gain from New Democratic | Swing | +10.99 | ||||||
| Source: Elections Canada[8][9] | ||||||||
| 2011 federal election redistributed results[10] | |||
|---|---|---|---|
| Party | Vote | % | |
| New Democratic | 23,613 | 47.53 | |
| Bloc Québécois | 16,081 | 32.37 | |
| Liberal | 5,018 | 10.10 | |
| Conservative | 3,801 | 7.65 | |
| Green | 936 | 1.88 | |
| Others | 235 | 0.47 | |
| 2011 Canadian federal election | ||||||||
|---|---|---|---|---|---|---|---|---|
| Party | Candidate | Votes | % | ±% | Expenditures | |||
| New Democratic | Ève Péclet | 23,033 | 48.34 | +35.44 | none listed | |||
| Bloc Québécois | Ginette Beaudry | 15,475 | 32.48 | −23.61 | $75,555 | |||
| Liberal | Olivier L. Coulombe | 4,369 | 9.17 | −6.82 | $4,159 | |||
| Conservative | Mathieu Drolet | 3,664 | 7.69 | −3.49 | $4,500 | |||
| Green | David J. Cox | 898 | 1.89 | −1.00 | $125 | |||
| Marxist–Leninist | Claude Brunelle | 213 | 0.45 | none listed | ||||
| Total valid votes/expense limit | 47,652 | 100.0 | ||||||
| Total rejected ballots | 813 | 1.68 | ||||||
| Turnout | 48,465 | 60.43 | +0.97 | |||||
| Eligible voters | 80,201 | |||||||
| Sources: Official Results, Elections Canada and Financial Returns, Elections Canada. | ||||||||
| 2008 Canadian federal election | ||||||||
|---|---|---|---|---|---|---|---|---|
| Party | Candidate | Votes | % | ±% | Expenditures | |||
| Bloc Québécois | Francine Lalonde (incumbent) | 25,976 | 56.09 | −4.37 | $54,814 | |||
| Liberal | Oumy Sarr | 7,403 | 15.99 | +1.88 | $7,501 | |||
| New Democratic | Isabelle McGuire | 5,975 | 12.90 | +5.89 | none listed | |||
| Conservative | Hubert Pichet | 5,179 | 11.18 | −4.06 | $49,752 | |||
| Green | Domita Cundari | 1,340 | 2.89 | −0.29 | none listed | |||
| Rhinoceros | Ben 97 Benoit | 261 | 0.56 | – | $1,608 | |||
| Marxist–Leninist | Claude Brunelle | 177 | 0.38 | – | none listed | |||
| Total valid votes/expense limit | 46,311 | 100.0 | – | $84,945 | ||||
| Total rejected ballots | 688 | 1.46 | ||||||
| Turnout | 46,999 | 59.46 | −2.86 | |||||
| Eligible voters | 79,049 | |||||||
| Sources: Official Results, Elections Canada and Financial Returns, Elections Canada. | ||||||||
| 2006 Canadian federal election | ||||||||
|---|---|---|---|---|---|---|---|---|
| Party | Candidate | Votes | % | ±% | Expenditures | |||
| Bloc Québécois | Francine Lalonde (incumbent) | 29,368 | 60.46 | −6.01 | $62,051 | |||
| Conservative | Christian Prévost | 7,402 | 15.24 | +11.00 | $7,391 | |||
| Liberal | Marie-Migniaud Dominique | 6,855 | 14.11 | −8.82 | $9,649 | |||
| New Democratic | Nicolas Tremblay | 3,407 | 7.01 | +3.22 | $1,505 | |||
| Green | Benjamin Rankin | 1,544 | 3.18 | +0.61 | $12 | |||
| Total valid votes | 48,576 | 100.00 | ||||||
| Total rejected ballots | 739 | |||||||
| Turnout | 49,315 | 62.32 | +3.14 | |||||
| Electors on the lists | 79,135 | |||||||
| Sources: Official Results, Elections Canada and Financial Returns, Elections Canada. | ||||||||
| 2004 Canadian federal election | ||||||||
|---|---|---|---|---|---|---|---|---|
| Party | Candidate | Votes | % | ±% | Expenditures | |||
| Bloc Québécois | Francine Lalonde | 30,713 | 66.47 | +13.35 | $58,592 | |||
| Liberal | Jean-Claude Gobé | 10,593 | 22.93 | −9.79 | $62,081 | |||
| Conservative | Christian Prévost | 1,961 | 4.24 | −3.11 | $5,476 | |||
| New Democratic | André Langevin | 1,751 | 3.79 | +2.69 | none listed | |||
| Green | André Levert | 1,186 | 2.57 | – | none listed | |||
| Total valid votes | 46,204 | 100.00 | ||||||
| Total rejected ballots | 1,075 | |||||||
| Turnout | 47,279 | 59.18 | ||||||
| Electors on the lists | 79,894 | |||||||
| Sources: Official Results, Elections Canada and Financial Returns, Elections Canada. | ||||||||
See also
- List of Canadian federal electoral districts
- Past Canadian electoral districts
References
- "(Code 24028) Census Profile". 2011 census. Statistics Canada. 2012. Retrieved March 7, 2011.
- Campaign expense data from Elections Canada
- 2011 Results from Elections Canada
- Riding history from the Library of Parliament
Notes
- Statistics Canada: 2016
- Statistics Canada: 2016
- "First Official Language Spoken (7), Language Spoken Most Often at Home (269), Age (15A) and Sex (3) for the Population Excluding Institutional Residents of Canada, Provinces and Territories and Federal Electoral Districts (2013 Representation Order), 2016 Census - 100% Data". August 2, 2017.
- "Confirmed candidates — La Pointe-de-l'Île". Elections Canada. Retrieved September 20, 2021.
- "List of confirmed candidates". Elections Canada. Retrieved October 3, 2019.
- "Election Night Results". Elections Canada. Retrieved November 11, 2019.
- http://enr.elections.ca/ElectoralDistricts.aspx?ed=2102
- Elections Canada – Confirmed candidates for La Pointe-de-l'Île, 30 September 2015
- Elections Canada – Preliminary Election Expenses Limits for Candidates Archived 2015-08-15 at the Wayback Machine
- Pundits' Guide to Canadian Elections
Другой контент может иметь иную лицензию. Перед использованием материалов сайта WikiSort.org внимательно изучите правила лицензирования конкретных элементов наполнения сайта.
WikiSort.org - проект по пересортировке и дополнению контента Википедии