world.wikisort.org - CanadaTrois-Rivières (formerly known as Three Rivers and Trois-Rivières Métropolitain) is an electoral district in Quebec, Canada that has been represented in the House of Commons of Canada from 1867 to 1892 and from 1935 to the present.
Federal electoral district in Quebec, Canada
Trois-Rivières Quebec electoral district Quebec electoral district |
|---|
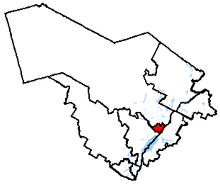 Trois-Rivières in relation to other Quebec federal electoral districts |
|
| Legislature | House of Commons |
|---|
| MP | René Villemure
Bloc Québécois |
|---|
| District created | 1976 |
|---|
| First contested | 1979 |
|---|
| Last contested | 2021 |
|---|
| District webpage | profile, map |
|---|
|
| Population (2011)[1] | 108,774 |
|---|
| Electors (2015) | 90,709 |
|---|
| Area (km²)[2] | 133 |
|---|
| Pop. density (per km²) | 817.8 |
|---|
| Census division(s) | Trois-Rivières |
|---|
| Census subdivision(s) | Trois-Rivières |
|---|
It was created as "Three Rivers" riding by the British North America Act of 1867. The electoral district was abolished in 1892 when it was merged into Three Rivers and St. Maurice riding.
The electoral district's English name changed in 1947 to "Trois-Rivières". The riding's name was changed again in 1972 to "Trois-Rivières Métropolitain". Trois-Rivières Métropolitain was abolished in 1976 when it was redistributed into a new "Trois-Rivières" riding and Champlain riding.
This riding lost territory to Saint-Maurice—Champlain and gained territory from Berthier—Maskinongé during the 2012 electoral redistribution.
Geography
The riding, in the Quebec region of Mauricie, consists of most of the city of Trois-Rivières, excepting the former cities of Trois-Rivières-Ouest and Pointe-du-Lac.
The neighbouring ridings are Berthier—Maskinongé, Saint-Maurice—Champlain, and Bas-Richelieu—Nicolet—Bécancour.
History
Members of Parliament
This riding has elected the following Members of Parliament:
| Parliament |
Years |
Member |
Party |
| Three Rivers |
| 1st |
1867–1868 | | Louis-Charles Boucher de Niverville | Conservative |
| 1868–1872 | William McDougall |
| 2nd |
1872–1874 |
| 3rd |
1874–1878 |
| 4th |
1878–1878 |
| 1878–1882 | Hector-Louis Langevin |
| 5th |
1882–1887 |
| 6th |
1887–1891 |
| 7th |
1891–1896 |
| Riding dissolved into Three Rivers and St. Maurice |
| Riding re-created from Three Rivers—St. Maurice |
| 18th |
1935–1940 | | Wilfrid Gariépy | Liberal |
| 19th |
1940–1945 | Robert Ryan |
| 20th |
1945–1949 | | Wilfrid Gariépy | Independent |
| Trois-Rivières |
| 21st |
1949–1953 | | Léon Balcer | Progressive Conservative |
| 22nd |
1953–1957 |
| 23rd |
1957–1958 |
| 24th |
1958–1962 |
| 25th |
1962–1963 |
| 26th |
1963–1965 |
| 27th |
1965–1968 | | Joseph-Alfred Mongrain | Independent |
| 28th |
1968–1971 | | Liberal |
| 1971–1972 | Claude Lajoie |
| Trois-Rivières Métropolitain |
| 29th |
1972–1974 | | Claude Lajoie | Liberal |
| 30th |
1974–1979 |
| Trois-Rivières |
| 31st |
1979–1980 | | Claude Lajoie | Liberal |
| 32nd |
1980–1984 |
| 33rd |
1984–1988 | | Pierre H. Vincent | Progressive Conservative |
| 34th |
1988–1993 |
| 35th |
1993–1997 | | Yves Rocheleau | Bloc Québécois |
| 36th |
1997–2000 |
| 37th |
2000–2004 |
| 38th |
2004–2006 | Paule Brunelle |
| 39th |
2006–2008 |
| 40th |
2008–2011 |
| 41st |
2011–2015 | | Robert Aubin | New Democratic |
| 42nd |
2015–2019 |
| 43rd |
2019–2021 | | Louise Charbonneau | Bloc Québécois |
| 44th |
2021–present | René Villemure |
Election results
Trois-Rivières, 1979-present
Graph of election results in Trois-Rivières (1976-, minor parties that never got 2% of the vote or didn't run consistently are omitted)
| 2021 Canadian federal election |
| Party |
Candidate |
Votes | % | | Expenditures |
|
Bloc Québécois | René Villemure | 17,120 | 29.5 | +1.0 |
|
Conservative | Yves Lévesque | 17,027 | 29.4 | +4.2 |
|
Liberal | Martin Francoeur | 16,560 | 28.6 | +2.5 |
|
New Democratic | Adis Simidzija | 4,658 | 8.0 | -8.7 |
|
People's | Jean Landry | 1,112 | 1.9 | N/A |
|
Green | Andrew Holman | 780 | 1.3 | -1.2 |
|
Free | Gilles Brodeur | 733 | 1.3 | N/A |
| Total valid votes |
58,110 | 98.0 |
| Total rejected ballots |
1,214 | 2.0 |
| Turnout |
59,324 | 64.3 |
| Eligible voters |
92,335 |
|
Bloc Québécois hold |
Swing |
-1.6 |
| Source: Elections Canada[3][4][5] |
| 2019 Canadian federal election |
| Party |
Candidate |
Votes | % | | Expenditures |
|
Bloc Québécois | Louise Charbonneau | 17,240 | 28.48 | +11.48 | $19,118.47 |
|
Liberal | Valérie Renaud-Martin | 15,774 | 26.06 | -4.16 | $59,713.01 |
|
Conservative | Yves Lévesque | 15,240 | 25.17 | +6.54 | none listed |
|
New Democratic | Robert Aubin | 10,090 | 16.67 | -15.16 | none listed |
|
Green | Marie Duplessis | 1,492 | 2.46 | +0.75 | none listed |
|
People's | Marc-André Gingras | 565 | 0.93 | – | $5,574.25 |
|
Independent | Ronald St-Onge Lynch | 137 | 0.23 | – | $0.00 |
| Total valid votes/expense limit |
60,538 | 100.0 |
| Total rejected ballots |
1,092 | 1.77 |
| Turnout |
61,630 | 66.73 |
| Eligible voters |
92,362 |
|
Bloc Québécois gain from New Democratic |
Swing |
+7.82 |
| Source: Elections Canada[6][7] |
| 2015 Canadian federal election |
| Party |
Candidate |
Votes | % | | Expenditures |
|
New Democratic | Robert Aubin | 19,193 | 31.83 | -17.87 | $59,109.30 |
|
Liberal | Yvon Boivin | 18,224 | 30.22 | +20.19 | $33,318.95 |
|
Conservative | Dominic Therrien | 11,231 | 18.63 | +5.48 | $88,781.37 |
|
Bloc Québécois | André Valois | 10,249 | 17.00 | -7.21 | $37,874.56 |
|
Green | Éric Trottier | 1,032 | 1.71 | -0.18 | – |
|
Libertarian | Maxime Rousseau | 360 | 0.6 | – | – |
| Total valid votes/Expense limit |
60,289 | 100.0 | | $232,803.19 |
| Total rejected ballots |
940 | – | – |
| Turnout |
61,229 | – | – |
| Eligible voters |
90,900 |
| Source: Elections Canada[8][9] |
| 2011 Canadian federal election |
| Party |
Candidate |
Votes | % | | Expenditures |
|
New Democratic | Robert Aubin | 26,981 | 53.57 | +44.39 | |
|
Bloc Québécois | Paule Brunelle | 11,987 | 23.80 | -21.46 | |
|
Conservative | Pierre Lacroix | 6,205 | 12.32 | -11.92 | |
|
Liberal | Patrice Mangin | 3,617 | 7.18 | -11.01 | |
|
Green | Louis Lacroix | 972 | 1.93 | -1.18 | |
|
Independent | Marc-André Fortin | 346 | 0.69 | – | |
|
Rhinoceros | Francis Arsenault | 256 | 0.51 | – | |
| Total valid votes/Expense limit |
50,364 | 100.00 |
| Total rejected ballots |
889 | 1.73 | – |
| Turnout |
51,253 | 64.59 | – |
| Eligible voters |
79,346 | – | – |
| 2008 Canadian federal election |
| Party |
Candidate |
Votes | % | | Expenditures |
|
Bloc Québécois | Paule Brunelle | 22,405 | 45.26 | -0.2 | $77,449 |
|
Conservative | Claude Durand | 11,998 | 24.24 | -9.1 | $76,522 |
|
Liberal | Marcos G. Simard | 9,008 | 18.19 | +7.3 | $17,099 |
|
New Democratic | Geneviève Boivin | 4,544 | 9.18 | +2.5 | $2,096 |
|
Green | Ariane Blais | 1,540 | 3.11 | +0.3 | |
| Total valid votes/Expense limit |
39,579 | 100.0 | $84,242 |
| 2006 Canadian federal election |
| Party |
Candidate |
Votes | % | | Expenditures |
|
Bloc Québécois | Paule Brunelle | 22,331 | 45.9 | -10.6 | $52,451 |
|
Conservative | Luc Ménard | 15,423 | 31.7 | +22.2 | $10,874 |
|
Liberal | Martine Girard | 5,268 | 10.8 | -16.5 | $19,948 |
|
New Democratic | Geneviève Boivin | 3,774 | 7.8 | +4.2 | $1,703 |
|
Green | Linda Lavoie | 1,513 | 3.1 | -0.1 | |
|
Marijuana | Paul Giroux | 371 | 0.8 | – | |
| Total valid votes/Expense limit |
48,680 | 100.0 | $78,516 |
| 2004 Canadian federal election |
| Party |
Candidate |
Votes | % | | Expenditures |
|
Bloc Québécois | Paule Brunelle | 26,240 | 56.5 | +9.8 | $52,143 |
|
Liberal | Jean-Éric Guindon | 12,703 | 27.4 | -15.6 | $69,554 |
|
Conservative | Jean-Guy Mercier | 4,381 | 9.4 | +1.6 | $9,519 |
|
New Democratic | Marc Tessier | 1,635 | 3.5 | 2.5 | $1,416 |
|
Green | Linda Lavoie | 1,476 | 3.2 | – | |
| Total valid votes/Expense limit |
46,435 | 100.0 | $77,441 |
Note: Conservative vote is compared to the total of the Canadian Alliance vote and Progressive Conservative vote in 2000 election.
| 2000 Canadian federal election |
| Party |
Candidate |
Votes | % | |
|
Bloc Québécois | Yves Rocheleau | 22,405 | 46.7 | +4.2 |
|
Liberal | Denis Normandin | 20,606 | 42.9 | +11.6 |
|
Alliance | Luc Legaré | 2,161 | 4.5 | |
|
Progressive Conservative | Scott Healy | 1,599 | 3.3 | -20.8 |
|
Natural Law | Gilles Raymond | 538 | 1.1 | +0.1 |
|
New Democratic | David Horlock | 512 | 1.1 | – |
|
Marxist–Leninist | Alexandre Deschênes | 184 | 0.4 | |
| Total valid votes |
48,005 | 100.0 |
| 1997 Canadian federal election |
| Party |
Candidate |
Votes | % | |
|
Bloc Québécois | Yves Rocheleau | 21,267 | 42.5 | -10.7 |
|
Liberal | Jean-Guy Doucet | 15,692 | 31.3 | +10.1 |
|
Progressive Conservative | Michel Charland | 12,102 | 24.2 | +0.5 |
|
New Democratic | Dorothy Hénaut | 528 | 1.1 | +0.3 |
|
Natural Law | Roger Périgny | 503 | 1.0 | -0.1 |
| Total valid votes |
50,092 | 100.0 |
| 1993 Canadian federal election |
| Party |
Candidate |
Votes | % | |
|
Bloc Québécois | Yves Rocheleau | 24,882 | 53.2 | |
|
Progressive Conservative | Pierre H. Vincent | 11,053 | 23.6 | -45.2 |
|
Liberal | Jean-Pierre Caron | 9,937 | 21.2 | +5.5 |
|
Natural Law | Roger Périgny | 522 | 1.1 | |
|
New Democratic | Maryse Choquette | 374 | 0.8 | -12.0 |
| Total valid votes |
46,768 | 100.0 |
| 1988 Canadian federal election |
| Party |
Candidate |
Votes | % | |
|
Progressive Conservative | Pierre H. Vincent | 29,370 | 68.9 | +4.9 |
|
Liberal | Nicholas Papirakis | 6,727 | 15.8 | -8.6 |
|
New Democratic | Josée Trudel | 5,470 | 12.8 | +8.2 |
|
Rhinoceros | Danielle La Chicane Saint-Laurent | 826 | 1.9 | -0.5 |
|
Independent | Lise Éthier | 249 | 0.6 | |
| Total valid votes |
42,642 | 100.0 |
| 1984 Canadian federal election |
| Party |
Candidate |
Votes | % | |
|
Progressive Conservative | Pierre H. Vincent | 26,843 | 63.9 | +51.0 |
|
Liberal | Françoise C. Drolet | 10,217 | 24.3 | -44.1 |
|
New Democratic | John A. Pratt | 1,947 | 4.6 | -6.5 |
|
Parti nationaliste | Yves Rocheleau | 1,847 | 4.4 | |
|
Rhinoceros | Houblon-oubedon Lemoine | 1,018 | 2.4 | |
|
Communist | Paul Gagné | 110 | 0.3 | |
| Total valid votes |
41,982 | 100.0 |
| 1980 Canadian federal election |
| Party |
Candidate |
Votes | % | |
|
Liberal | Claude Lajoie | 23,791 | 68.5 | +7.5 |
|
Progressive Conservative | Jean Méthot | 4,482 | 12.9 | +2.2 |
|
New Democratic | Denis Faubert | 3,870 | 11.1 | +6.7 |
|
Independent | Raymond Lajoie | 1,898 | 5.5 | |
|
Independent | Rodolphe Lemieux | 283 | 0.8 | |
|
Union populaire | Guy Baillargeon | 249 | 0.7 | +0.5 |
|
Marxist–Leninist | Lise Éthier | 168 | 0.5 | +0.3 |
| Total valid votes |
34,741 | 100.0 |
| 1979 Canadian federal election |
| Party |
Candidate |
Votes | % | |
|
Liberal | Claude Lajoie | 23,311 | 61.0 | -0.2 |
|
Social Credit | Léopold Alarie | 7,950 | 20.8 | +1.8 |
|
Progressive Conservative | Roland Julien | 4,099 | 10.7 | -4.2 |
|
New Democratic | Roland Auger | 1,682 | 4.4 | 0.0 |
|
Rhinoceros | Alain Beaupré | 947 | 2.5 | |
|
Independent | Gilles Gervais | 77 | 0.2 | |
|
Union populaire | Gilles Marier | 66 | 0.2 | |
|
Marxist–Leninist | Lise Éthier | 63 | 0.2 | -0.4 |
|
Communist | Jeannette Walsh | 36 | 0.1 | |
| Total valid votes |
38,231 | 100.0 |
Trois-Rivières Métropolitain, 1972-1979
Graph of election results in Trois-Rivières Métropolitain (1972-1976, minor parties that never got 2% of the vote or didn't run consistently are omitted)
| 1974 Canadian federal election |
| Party |
Candidate |
Votes | % | |
|
Liberal | Claude Lajoie | 24,335 | 61.2 | +16.8 |
|
Social Credit | Réal Ménard | 7,538 | 18.9 | -19.5 |
|
Progressive Conservative | Yvon Massicotte | 5,949 | 15.0 | +2.3 |
|
New Democratic | Yvon Roland Chamberland | 1,738 | 4.4 | -0.1 |
|
Marxist–Leninist | Jacques Auger | 221 | 0.6 | |
| Total valid votes |
39,781 | 100.0 |
| 1972 Canadian federal election |
| Party |
Candidate |
Votes | % | |
|
Liberal | Claude Lajoie | 19,892 | 44.4 | -3.3 |
|
Social Credit | Réal Lemay | 17,250 | 38.5 | -4.8 |
|
Progressive Conservative | Edgar Lesieur | 5,662 | 12.6 | +5.8 |
|
New Democratic | Jacques Hébert | 2,022 | 4.5 | |
| Total valid votes |
44,826 | 100.0 |
Trois-Rivières, 1949-1972
Graph of election results in Trois-Rivières (1947-1972, minor parties that never got 2% of the vote or didn't run consistently are omitted)
Canadian federal by-election, May 31, 1971
On Mr. Mongrain's death, 23 December 1970 |
| Party |
Candidate |
Votes | % | |
|
Liberal | Claude Lajoie | 12,809 | 47.7 | +1.5 |
|
Social Credit | Réal Lemay | 11,616 | 43.3 | +24.1 |
|
Progressive Conservative | Thérèse-M. Landry | 1,827 | 6.8 | -20.8 |
|
Independent | Henri-Georges Grenier (Espirit social) | 422 | 1.6 | |
|
Republican | Joseph Thibodeau | 170 | 0.6 | |
| Total valid votes |
26,844 | 100.0 |
| Note: Social Credit vote is compared to Ralliement créditiste vote in the 1968 election. |
| 1968 Canadian federal election |
| Party |
Candidate |
Votes | % | |
|
Liberal | Joseph-Alfred Mongrain | 17,592 | 46.2 | +12.6 |
|
Progressive Conservative | Gilles Gauthier | 10,501 | 27.6 | +12.4 |
|
Ralliement créditiste | Émile Fréchette | 7,305 | 19.2 | +11.3 |
|
New Democratic | Philippe Daviault | 1,724 | 4.5 | +2.2 |
|
Independent | Gaston Pelletier | 566 | 1.5 | |
|
Independent | Lucien Bornais | 364 | 1.0 | |
| Total valid votes |
38,052 | 100.0 |
| 1965 Canadian federal election |
| Party |
Candidate |
Votes | % | |
|
Independent | Joseph-Alfred Mongrain | 12,927 | 40.9 | |
|
Liberal | Pierre Garceau | 10,617 | 33.6 | -6.5 |
|
Progressive Conservative | Jean Méthot | 4,799 | 15.2 | -29.5 |
|
Ralliement créditiste | Philippe Daviault | 2,488 | 7.9 | -5.1 |
|
New Democratic | Joseph Rivard | 749 | 2.4 | +0.2 |
| Total valid votes |
31,580 | 100.0 |
Note: Ralliement créditiste vote is compared to Social Credit vote in the 1963 election.
| 1963 Canadian federal election |
| Party |
Candidate |
Votes | % | |
|
Progressive Conservative | Léon Balcer | 14,558 | 44.7 | -4.0 |
|
Liberal | Claude Bisson | 13,077 | 40.1 | +3.6 |
|
Social Credit | Lucien Richard | 4,224 | 13.0 | -1.8 |
|
New Democratic | Alfred Robindaine | 718 | 2.2 | |
| Total valid votes |
32,577 | 100.0 |
| 1962 Canadian federal election |
| Party |
Candidate |
Votes | % | |
|
Progressive Conservative | Léon Balcer | 15,545 | 48.7 | -11.1 |
|
Liberal | Claude Bisson | 11,675 | 36.6 | -0.5 |
|
Social Credit | J.-Donat Dupont | 4,715 | 14.8 | |
| Total valid votes |
31,935 | 100.0 |
| 1958 Canadian federal election |
| Party |
Candidate |
Votes | % | |
|
Progressive Conservative | Léon Balcer | 18,049 | 59.7 | +9.1 |
|
Liberal | Antoine Gauthier | 11,193 | 37.1 | -11.6 |
|
Independent | Henri-Georges Grenier (Capital familial) | 968 | 3.2 | +2.4 |
| Total valid votes |
30,210 | 100.0 |
| 1957 Canadian federal election |
| Party |
Candidate |
Votes | % | |
|
Progressive Conservative | Léon Balcer | 15,004 | 50.6 | -2.2 |
|
Liberal | François Nobert | 14,412 | 48.6 | +1.4 |
|
Independent | Henri-Georges Grenier (Capital familial) | 237 | 0.8 | |
| Total valid votes |
29,653 | 100.0 |
| 1953 Canadian federal election |
| Party |
Candidate |
Votes | % | |
|
Progressive Conservative | Léon Balcer | 15,556 | 52.8 | +13.8 |
|
Liberal | Joseph-Alfred Mongrain | 13,905 | 47.2 | +8.4 |
| Total valid votes |
29,461 | 100.0 |
| 1949 Canadian federal election |
| Party |
Candidate |
Votes | % | |
|
Progressive Conservative | Léon Balcer | 10,015 | 39.0 | +18.8 |
|
Liberal | Wilfrid Gariépy | 9,964 | 38.8 | +26.5 |
|
Independent Liberal | Jules Biron | 4,925 | 19.2 | |
|
Union des électeurs | Hector Brunelle | 432 | 1.7 | -2.1 |
|
Independent | Henri-Georges Grenier | 367 | 1.4 | -0.6 |
| Total valid votes |
25,703 | 100.0 |
Three Rivers, 1935-1949
Graph of election results in Three Rivers (1934-1949, minor parties that never got 2% of the vote or didn't run consistently are omitted)
| 1945 Canadian federal election |
| Party |
Candidate |
Votes | % | |
|
Independent | Wilfrid Gariépy | 6,610 | 32.0 | -15.0 |
|
Independent Liberal | Jean-Louis Marchand | 5,947 | 28.8 | |
|
Progressive Conservative | Léon Méthot | 4,173 | 20.2 | |
|
Liberal | Robert Ryan | 2,525 | 12.2 | -40.8 |
|
Social Credit | Onésime Cormier | 787 | 3.8 | |
|
Independent | Henri-Georges Grenier | 423 | 2.0 | |
|
Co-operative Commonwealth | Lionel Fortin | 186 | 0.9 | |
| Total valid votes |
20,651 | 100.0 |
| 1940 Canadian federal election |
| Party |
Candidate |
Votes | % | |
|
Liberal | Robert Ryan | 9,860 | 53.0 | -2.0 |
|
Independent Liberal | Wilfrid Gariépy | 8,734 | 47.0 | |
| Total valid votes |
18,594 | 100.0 |
| 1935 Canadian federal election |
| Party |
Candidate |
Votes | % | |
|
Liberal | Wilfrid Gariépy | 6,114 | 30.1 | |
|
Conservative | Léon Méthot | 5,748 | 28.3 | -30.3 |
|
Liberal | Philippe Bigué | 5,070 | 24.9 | |
|
Independent Liberal | Willie Poisson | 2,267 | 11.2 | |
|
Reconstruction | Louis-D. Durand | 1,049 | 5.2 | |
|
Independent Conservative | Louis Normand | 76 | 0.4 | |
| Total valid votes |
20,324 | 100.0 |
Three Rivers, 1867-1892
Graph of election results in Three Rivers (1867-1892, minor parties that never got 2% of the vote or didn't run consistently are omitted)
| 1891 Canadian federal election |
| Party |
Candidate |
Votes | % | |
|
Conservative | Hector-Louis Langevin | 682 | 58.6 | +7.4 |
|
Liberal | L.T. Polette | 482 | 41.4 | -7.4 |
| Total valid votes |
1,164 | 100.0 |
| 1887 Canadian federal election |
| Party |
Candidate |
Votes | % |
|
Conservative | Hector-Louis Langevin | 640 | 51.2 |
|
Liberal | L.P. Pelletier | 610 | 48.8 |
| Total valid votes |
1,250 | 100.0 |
| 1882 Canadian federal election |
| Party |
Candidate |
Votes |
|
Conservative | Hector-Louis Langevin | acclaimed |
| By-election on 21 November 1878
On Mr. McDougall's resignation |
| Party |
Candidate |
Votes
|
|
Conservative | Hector-Louis Langevin | acclaimed |
| 1878 Canadian federal election |
| Party |
Candidate |
Votes | % | |
|
Conservative | William McDougall | 584 | 57.3 | -20.9 |
|
Unknown | H.G. Malhiot | 436 | 42.7 | |
| Total valid votes |
1,020 | 100.0 |
| 1874 Canadian federal election |
| Party |
Candidate |
Votes | % |
|
Conservative | William McDougall | 451 | 78.2 |
|
Unknown | J.N. Bunan | 126 | 21.8 |
| Total valid votes |
577 | 100.0 |
| 1872 Canadian federal election |
| Party |
Candidate |
Votes |
|
Conservative | William McDougall | acclaimed |
| By-election on 17 October 1868
On Mr. Boucher de Niverville's resignation, 30 September 1868 |
| Party |
Candidate |
Votes
|
|
Conservative | William McDougall | acclaimed |
| 1867 Canadian federal election |
| Party |
Candidate |
Votes | % |
|
Conservative | Louis-Charles Boucher de Niverville | 277 | 66.0 |
|
Unknown | C. B. Genest | 143 | 34.0 |
| Total valid votes |
420 | 100.0 |
| Source: Canadian Parliamentary Guide, 1871[10] |
Districts since 1867 that have included Trois-Rivières
The following list contains members of districts that have included Trois-Rivières, since 1867:
| |
Name |
Assignments [11] |
Party |
Election [12] |
Popular Vote [13] |
| |
Charles Boucher de Niverville[14] | Government MP | Conservative | 1867 | 66% |
| |
William McDougall | Government MP | Conservative | 1868 | unopposed |
| |
William McDougall | Government MP (before 1873)
Official Opposition MP (after 1873) | Conservative | 1872 | unopposed |
| |
William McDougall | Official Opposition MP | Conservative | 1874 | 78% |
| |
William McDougall[15] | Government MP | Conservative | 1878 | 57% |
| |
Hector Langevin | Cabinet Member | Conservative | 1878 | unopposed |
| |
Hector Langevin | Cabinet Member | Conservative | 1882 | unopposed |
| |
Hector Langevin | Cabinet Member | Conservative | 1887 | 51% |
| |
Hector Langevin | Government MP
Cabinet Member (until 1891) | Conservative | 1891 | 59% |
| |
Sir Adolphe-Philippe Caron | Official Opposition MP | Conservative | 1896 | 54% |
| |
Jacques Bureau | Government MP | Liberal | 1900 | 53% |
| |
Jacques Bureau[16] | Government MP | Liberal | 1904 | 54% |
| |
Jacques Bureau | Cabinet Member | Liberal | 1907 | unopposed |
| |
Jacques Bureau | Cabinet Member | Liberal | 1908 | 64% |
| |
Jacques Bureau | Official Opposition MP | Liberal | 1911 | 50% |
| |
Jacques Bureau | Official Opposition MP | Liberal | 1917 | unopposed |
| |
Jacques Bureau[17] | Government MP | Liberal | 1921 | 68% |
| |
Jacques Bureau | Cabinet Member | Liberal | 1922 | unopposed |
| |
Arthur Bettez | Government MP (until 1926)
Official Opposition MP (after 1926) | Liberal | 1925 | 56% |
| |
Arthur Bettez | Government MP | Liberal | 1926 | 66% |
| |
Arthur Bettez[18] | Official Opposition MP | Liberal | 1930 | 57% |
| |
Charles Bourgeois | Government MP | Conservative | 1931 | 50% |
| |
Wilfrid Gariépy[19] | Government MP | Liberal | 1935 | 30% |
| |
Robert Ryan[20] | Government MP | Liberal | 1940 | 53% |
| } |
Wilfrid Gariépy[21] | Independent MP | Independent | 1945 | 32% |
| |
Léon Balcer | Official Opposition MP | Progressive Conservative | 1949 | 39% |
| |
Léon Balcer | Official Opposition MP | Progressive Conservative | 1953 | 53% |
| |
Léon Balcer | Cabinet Member | Progressive Conservative | 1957 | 51% |
| |
Léon Balcer | Cabinet Member | Progressive Conservative | 1958 | 60% |
| |
Léon Balcer | Cabinet Member | Progressive Conservative | 1962 | 49% |
| |
Léon Balcer[22] | Official Opposition MP | Progressive Conservative | 1963 | 45% |
| } |
Joseph-Alfred Mongrain | Independent MP | Independent | 1965 | 59% |
| |
Joseph-Alfred Mongrain[23] | Government MP | Liberal | 1968 | 46% |
| |
Claude Lajoie | Government MP | Liberal | 1971 | 48% |
| |
Claude Lajoie | Government MP | Liberal | 1972 | 44% |
| |
Claude Lajoie | Government MP
Parliamentary Secretary (from 1975 to 1977) | Liberal | 1974 | 61% |
| |
Claude Lajoie | Official Opposition MP | Liberal | 1979 | 61% |
| |
Claude Lajoie | Government MP | Liberal | 1980 | 68% |
| |
Pierre H. Vincent | Parliamentary Secretary | Progressive Conservative | 1984 | 64% |
| |
Pierre H. Vincent[24] | Parliamentary Secretary (until 1993)
Cabinet Member (after 1993) | Progressive Conservative | 1988 | 69% |
| |
Yves Rocheleau | Official Opposition MP | Bloc Québécois | 1993 | 53% |
| |
Yves Rocheleau | Third Party MP | Bloc Québécois | 1997 | 42% |
| |
Yves Rocheleau | Third Party MP | Bloc Québécois | 2000 | 47% |
| |
Paule Brunelle | Third Party MP | Bloc Québécois | 2004 | 57% |
| |
Paule Brunelle | Third Party MP | Bloc Québécois | 2006 | 46% |
| |
Paule Brunelle | Third Party MP | Bloc Québécois | 2008 | 46% |
|
See also
- List of Canadian federal electoral districts
- Mauricie
- Past Canadian electoral districts
References
Riding history from the Library of Parliament:
Notes
Federal ridings in Central Quebec |
|---|
| Bloc Québécois | |
|---|
| Conservative | |
|---|
| Liberal | |
|---|
|
|---|
| Central Quebec | |
|---|
| Côte-Nord and Saguenay | |
|---|
| Eastern Quebec | |
|---|
| The Eastern Townships | |
|---|
The Laurentides, Outaouais
and Northern Quebec | |
|---|
Montreal
(East, West, North & Laval) | |
|---|
| Montérégie | |
|---|
| Quebec City | |
|---|
See also: Quebec provincial electoral districts |
Historical federal ridings in Quebec |
|---|
| Until 2015 | |
|---|
| Until 2006 | |
|---|
| Until 2004 | |
|---|
| Until 2000 | |
|---|
| Until 1997 | |
|---|
| Until 1993 | |
|---|
| Until 1988 | |
|---|
| Until 1984 | |
|---|
| Until 1980 | |
|---|
| Until 1979 | |
|---|
| Until 1974 | |
|---|
| Until 1972 | |
|---|
| Until 1968 | |
|---|
| Until 1962 | |
|---|
| Until 1953 | |
|---|
| Until 1949 | |
|---|
| Until 1935 | |
|---|
| Until 1925 | |
|---|
| Until 1917 | |
|---|
| Before 1900 | |
|---|
Текст в блоке "Читать" взят с сайта "Википедия" и доступен по лицензии Creative Commons Attribution-ShareAlike; в отдельных случаях могут действовать дополнительные условия.
Другой контент может иметь иную лицензию. Перед использованием материалов сайта WikiSort.org внимательно изучите правила лицензирования конкретных элементов наполнения сайта.
2019-2026
WikiSort.org - проект по пересортировке и дополнению контента Википедии
