world.wikisort.org - CanadaPapineau (formerly Papineau—Saint-Denis and Papineau—Saint-Michel) is a federal electoral district in Montreal, Quebec, Canada, that has been represented in the House of Commons of Canada since 1948. Its population in 2016 was 110,750. Justin Trudeau, the Prime Minister of Canada and Leader of the Liberal Party, has represented the riding since the 2008 federal election. Trudeau became Liberal leader in a 2013 leadership election, succeeding Bob Rae, and prime minister when the Liberals returned to government in the 2015 Canadian federal election, succeeding Conservative leader Stephen Harper.
Federal electoral district in Quebec, Canada
This article is about the federal district. For the provincial district in the Outaouais, see Papineau (provincial electoral district).
Papineau Quebec electoral district Quebec electoral district |
|---|
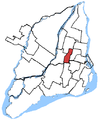
 Papineau in relation to other federal electoral districts in Montreal and Laval |
|
| Legislature | House of Commons |
|---|
| MP | Justin Trudeau
Liberal |
|---|
| District created | 2003 |
|---|
| First contested | 2004 |
|---|
| Last contested | 2021 |
|---|
| District webpage | profile, map |
|---|
|
| Population (2016)[1] | 110,750 |
|---|
| Electors (2015) | 78,515 |
|---|
| Area (km²)[2] | 9.91 |
|---|
| Pop. density (per km²) | 11,175.6 |
|---|
| Census division(s) | Montreal |
|---|
| Census subdivision(s) | Montreal |
|---|
The name of the riding comes from a street in the Villeray neighbourhood, named after Joseph Papineau.
At nine square kilometres, it covers the second smallest area of any federal riding in Canada after Toronto Centre.[3] Linguistically, 45% of residents list French as their mother tongue, 8% list English, and 47% list neither English nor French, with large groups speaking Spanish, Italian, Urdu, Hindi, Punjabi, Pashtu, Bengali, Greek, and Arabic. Immigrants make up 40 percent of the riding's population.[4]
Geography
The district includes the neighbourhoods of Villeray and Park Extension, as well as the southern part of the old city of Saint-Michel in the Borough of Villeray–Saint-Michel–Parc-Extension.
The southeast corner of the riding borders the Outremont riding, which was most recently held by Tom Mulcair, the former leader of the New Democratic Party.
Political geography
Papineau, despite its small size, is a very divided riding. The riding spans the former linguistic divide of the city, Saint Laurent Boulevard. South of the riding is the neighbourhood of Park Extension, which is very Liberal. The central part of the riding, around Villeray, was Bloc Québécois territory for almost two decades before swinging heavily to the NDP in the 2011 federal election. Meanwhile, François-Perreault district, in the south of Saint-Michel, is considered swing territory between the Liberals and the NDP. The district of Saint-Michel, which is part of neighbouring Saint-Léonard—Saint-Michel riding to the northeast of Papineau, leans to the Liberals.[citation needed]
Except for the years 2006 to 2008, when it was held by Vivian Barbot of the Bloc, the seat has been in Liberal hands since 1953.
Demographics
- According to the Canada 2016 Census
- Twenty most common mother tongue languages (2016) : 49.7% French, 6.6% Spanish, 6.5% English, 5.9% Arabic, 4.2% Greek, 3.4% Italian, 2.7% Vietnamese, 2.4% Creole languages, 2.2% Punjabi, 2.1% Portuguese, 1.8% Bengali, 1.8% Urdu, 1.5% Tamil, 1.1% Cantonese, 1.0% Gujarati, 0.6% Mandarin, 0.6% Kabyle, 0.5% Khmer, 0.5% Turkish, 0.3% Polish, 0.3% Russian[5]
History
The electoral district of Papineau was created in 1947 from parts of the Hochelaga, Mercier, St. James and Saint-Denis ridings.
It was renamed Papineau-Saint-Michel in 1987 and Papineau-Saint-Denis in 1994. It was shortened back to "Papineau" in 2003.
This riding gained territory from Outremont and Saint-Léonard—Saint-Michel during the 2012 electoral redistribution.
Members of Parliament
This riding has elected the following Members of Parliament:
| Parliament |
Years |
Member |
Party |
Papineau
Riding created from Hochelaga, Mercier,
St. James and Saint-Denis |
| 21st |
1949–1953 | | Camillien Houde | Independent |
| 22nd |
1953–1957 | | Adrien Meunier | Independent Liberal |
| 23rd |
1957–1958 | | Liberal |
| 24th |
1958–1962 |
| 25th |
1962–1963 |
| 26th |
1963–1965 | Guy Favreau |
| 27th |
1965–1967 |
| 1967–1968 | André Ouellet |
| 28th |
1968–1972 |
| 29th |
1972–1974 |
| 30th |
1974–1979 |
| 31st |
1979–1980 |
| 32nd |
1980–1984 |
| 33rd |
1984–1988 |
| Papineau—Saint-Michel |
| 34th |
1988–1993 | | André Ouellet | Liberal |
| 35th |
1993–1996 |
| 1996–1997 | Pierre Pettigrew |
| Papineau—Saint-Denis |
| 36th |
1997–2000 | | Pierre Pettigrew | Liberal |
| 37th |
2000–2004 |
| Papineau |
| 38th |
2004–2006 | | Pierre Pettigrew | Liberal |
| 39th |
2006–2008 | | Vivian Barbot | Bloc Québécois |
| 40th |
2008–2011 | | Justin Trudeau | Liberal |
| 41st |
2011–2015 |
| 42nd |
2015–2019 |
| 43rd |
2019–2021 |
| 44th |
2021–present |
Election results
Graph of election results in Papineau (1947–1987), Papineau—Saint-Michel, Papineau—Saint-Denis, Papineau (2003-present) (since 2003; minor parties that never got 2% of the vote or didn't run consistently are omitted)
Papineau, 2003 – present
Graph of election results in Papineau (since 2003; minor parties that never got 2% of the vote or didn't run consistently are omitted)
| 2021 Canadian federal election |
| Party |
Candidate |
Votes | % | | Expenditures |
|
Liberal | Justin Trudeau | 22,848 | 50.30 | –0.82 | |
|
New Democratic | Christine Paré | 10,303 | 22.68 | +3.48 | |
|
Bloc Québécois | Nabila Ben Youssef | 6,830 | 15.04 | –0.96 | |
|
Conservative | Julio Rivera | 2,198 | 4.84 | +0.6 | |
|
Green | Alain Lepine | 1,448 | 3.19 | –4.18 | |
|
People's | Christian Boutin | 1,064 | 2.34 | +1.71 | |
|
Rhinoceros | Above Znoneofthe | 418 | 0.92 | +0.21 | |
|
Marxist–Leninist | Garnet Colly | 115 | 0.25 | – | |
|
Independent | Raymond Martin | 102 | 0.22 | – | |
|
Independent | Béatrice Zako | 97 | 0.21 | – | |
| Total valid votes |
45,423 | 98.07 | – |
| Total rejected ballots |
894 | 1.93 | +0.12 |
| Turnout |
46,317 | 63.51 | –3.66 |
| Eligible voters |
72,931 |
|
Liberal hold |
Swing |
–2.15 |
| Source: Elections Canada[6] |
| 2019 Canadian federal election |
| Party |
Candidate |
Votes | % | | Expenditures |
|
Liberal | Justin Trudeau | 25,957 | 51.12 | −0.86 | $87,090.50 |
|
New Democratic | Christine Paré | 9,748 | 19.20 | −6.67 | $4,985.12 |
|
Bloc Québécois | Christian Gagnon | 8,124 | 16.00 | +3.82 | none listed |
|
Green | Juan Vazquez | 3,741 | 7.37 | +4.53 | none listed |
|
Conservative | Sophie Veilleux | 2,155 | 4.24 | −0.47 | $13,803.36 |
|
Rhinoceros | Jean-Patrick Cacereco Berthiaume | 363 | 0.71 | +0.07 | $119.67 |
|
People's | Mark Sibthorpe | 322 | 0.63 | – | none listed |
|
Christian Heritage | Susanne Lefebvre | 186 | 0.37 | – | $356.56 |
|
Independent | Alain Magnan | 76 | 0.15 | – | $0.00 |
|
No affiliation | Luc Lupien | 75 | 0.15 | – | $0.00 |
|
No affiliation | Steve Penner | 34 | 0.07 | – | $250.00 |
| Total valid votes/expense limit |
50,781 | 98.19 | – | $106,263.74 |
| Total rejected ballots |
938 | 1.81 | +0.45 |
| Turnout |
51,719 | 67.17 | +1.73 |
| Eligible voters |
76,995 |
|
Liberal hold |
Swing |
+2.91 |
| Source: Elections Canada[7][8] |
| 2015 Canadian federal election |
| Party |
Candidate |
Votes | % | | Expenditures |
|
Liberal | Justin Trudeau | 26,391 | 51.98 | +14.05 | $129,821.55 |
|
New Democratic | Anne Lagacé Dowson | 13,132 | 25.87 | −3.6 | $111,652.95 |
|
Bloc Québécois | Maxime Claveau | 6,182 | 12.18 | −12.71 | $19,007.27 |
|
Conservative | Yvon Vadnais | 2,390 | 4.71 | −0.33 | $5,649.91 |
|
Green | Danny Polifroni | 1,443 | 2.84 | +0.95 | $82.71 |
|
Independent | Chris Lloyd | 505 | 0.99 | – | $5,759.41 |
|
Rhinoceros | Tommy Gaudet | 323 | 0.64 | – | – |
|
Independent | Kim Waldron | 159 | 0.31 | – | $2,101.20 |
|
Marxist–Leninist | Peter Macrisopoulos | 142 | 0.28 | −0.25 | – |
|
No affiliation | Beverly Bernardo | 103 | 0.2 | – | – |
| Total valid votes/expense limit |
50,770 | 98.64 | | $213,091.50 |
| Total rejected ballots |
698 | 1.36 | – |
| Turnout |
51,468 | 65.44 | – |
| Eligible voters |
78,649 |
|
Liberal notional hold |
Swing |
+8.83 |
| Source: Elections Canada[9][10] |
| 2011 federal election poll-by-poll redistribution [11] |
| Party |
Vote |
% |
| |
Liberal | 17,407 | 37.93 |
| |
New Democratic | 13,625 | 29.47 |
| |
Bloc Québécois | 11,421 | 24.89 |
| |
Conservative | 2,314 | 5.04 |
| |
Green | 868 | 1.89 |
| |
Others | 357 | 0.78 |
| 2011 Canadian federal election |
| Party |
Candidate |
Votes | % | |
|
Liberal | Justin Trudeau | 16,429 | 38.41 | −3.06 |
|
New Democratic | Marcos Radhames Tejada | 12,102 | 28.29 | +19.55 |
|
Bloc Québécois | Vivian Barbot | 11,091 | 25.93 | −12.76 |
|
Conservative | Shama Chopra | 2,021 | 4.73 | −2.90 |
|
Green | Danny Polifroni | 806 | 1.88 | −0.96 |
|
Marxist–Leninist | Peter Macrisopoulos | 228 | 0.53 | |
|
Not affiliated1 | Joseph Young | 95 | 0.22 | |
| Total valid votes |
42,772 | 100.0 |
| Total rejected ballots |
588 |
| Turnout |
43,330 |
Source: Official Results, Elections Canada.
1 Communist League |
| 2008 Canadian federal election |
| Party |
Candidate |
Votes | % | | Expenditures |
|
Liberal | Justin Trudeau | 17,724 | 41.47 | +2.99 | $76,857 |
|
Bloc Québécois | Vivian Barbot | 16,535 | 38.69 | −2.06 | $70,872 |
|
New Democratic | Costa Zafiropoulos | 3,734 | 8.74 | +1.04 | $5,745 |
|
Conservative | Mustaque Sarker | 3,262 | 7.63 | −0.69 | $44,958 |
|
Green | Ingrid Hein | 1,213 | 2.84 | −0.76 | $814 |
|
Independent | Mahmood Raza Baig | 267 | 0.62 | +0.20 | |
| Total valid votes/expense limit |
42,735 | 100.00 | | $81,172 |
| Total rejected ballots |
576 | 1.33 |
| Turnout |
43,311 | 61.77 |
| Eligible voters |
70,115 |
|
Liberal gain from Bloc Québécois |
Swing |
+2.53 |
| Baig's share of popular vote as an independent candidate is compared to his share in the 2006 general election as a Canadian Action Party candidate. |
| Sources: Official Results, Elections Canada and Financial Returns, Elections Canada. |
| 2006 Canadian federal election |
| Party |
Candidate |
Votes | % | | Expenditures |
|
Bloc Québécois | Vivian Barbot | 17,775 | 40.75 | +0.79 | $50,886 |
|
Liberal | Pierre Pettigrew | 16,785 | 38.48 | -2.62 | $75,541 |
|
Conservative | Mustaque Sarker | 3,630 | 8.32 | +3.55 | $34,951 |
|
New Democratic | Marc Hasbani | 3,358 | 7.70 | -1.07 | $2,568 |
|
Green | Louis-Philippe Verenka | 1,572 | 3.60 | +1.03 | $181 |
|
Marxist–Leninist | Peter Macrisopoulos | 317 | 0.73 | +0.32 | |
|
Canadian Action | Mahmood-Raza Baig | 185 | 0.42 | – | $2,007 |
| Total valid votes/Expense limit |
43,622 | 100.00 | $76,023 |
|
Bloc Québécois gain from Liberal |
Swing |
+1.71 |
| Source: Elections Canada[12] |
| 2004 Canadian federal election |
| Party |
Candidate |
Votes | % | | Expenditures |
|
Liberal | Pierre Pettigrew | 16,892 | 41.10 | -13.00 | |
|
Bloc Québécois | Martine Carrière | 16,424 | 39.96 | +13.36 | $48,511 |
|
New Democratic | André Frappier | 3,603 | 8.77 | +4.29 | $28,566 |
|
Conservative | Mustaque Sarker | 1,961 | 4.77 | -2.74 | $38,564 |
|
Green | Adam Jastrzebski | 1,058 | 2.57 | +0.02 | |
|
Marijuana | Christelle Dusablon-Pelletier | 490 | 1.19 | -0.81 | |
|
Communist | André Parizeau | 252 | 0.61 | | $825 |
|
Independent | Jimmy Garoufalis | 250 | 0.61 | | $2,607 |
|
Marxist–Leninist | Peter Macrisopoulos | 169 | 0.41 | -0.68 | |
| Total valid votes/Expense limit |
41,099 | 100.00 | $75,103 |
|
Liberal hold |
Swing |
-13.18 |
| Conservative vote is compared to the total of the Canadian Alliance vote and Progressive Conservative vote in 2000 election, and not the vote Sarker received as an independent candidate. |
Papineau—Saint-Denis, 1996–2003
Graph of election results in Papineau—Saint-Denis (1996–2003; minor parties that never got 2% of the vote or didn't run consistently are omitted)
| 2000 Canadian federal election: Papineau—Saint-Denis |
| Party |
Candidate |
Votes | % | |
|
Liberal | Pierre Pettigrew | 23,955 | 54.10 | +0.20 |
|
Bloc Québécois | Philippe Ordenes | 11,779 | 26.60 | -2.31 |
|
Alliance | Yannis Felemegos | 2,114 | 4.77 | -8.01 |
|
New Democratic | Hans Marotte | 1,983 | 4.48 | +2.03 |
|
Progressive Conservative | Emmanuel Préville | 1,215 | 2.74 | -10.04 |
|
Green | Boris-Antoine Legault | 1,128 | 2.55 | |
|
Marijuana | Antoine Théorêt-Poupart | 886 | 2.00 | |
|
Independent | Mustaque Sarker | 738 | 1.67 | |
|
Marxist–Leninist | Peter Macrisopoulos | 482 | 1.09 | +0.10 |
| Total valid votes |
44,280 | 100.00 |
|
Liberal hold |
Swing |
+1.26 |
| Canadian Alliance vote compared to the vote Felemegos received as a Progressive Conservative candidate. |
| 1997 Canadian federal election: Papineau—Saint-Denis |
| Party |
Candidate |
Votes | % | | Expenditures |
|
Liberal | Pierre Pettigrew | 26,260 | 53.90 | -5.30 | $53,271 |
|
Bloc Québécois | Mario Beaulieu | 14,083 | 28.91 | -5.02 | $25,032 |
|
Progressive Conservative | Yannis Felemegos | 6,227 | 12.78 | +10.43 | $19,274 |
|
New Democratic | Gaby Kombé | 1,196 | 2.45 | -1.02 | $3,030 |
|
Marxist–Leninist | Peter Macrisopoulos | 481 | 0.99 | | $0 |
|
Independent | Michel Dugré | 471 | 0.97 | | $270 |
| Total valid votes/Expense limit |
41,099 | 100.00 |
|
Liberal hold |
Swing |
-0.14 |
Papineau—Saint-Michel, 1987–1996
Graph of election results in Papineau—Saint-Michel (1987–1996; minor parties that never got 2% of the vote or didn't run consistently are omitted)
| Canadian federal by-election, 25 March 1996: Papineau—Saint-Michel |
| Party |
Candidate |
Votes | % | |
|
Liberal | Pierre Pettigrew | 15,330 | 59.20 | +7.22 |
|
Bloc Québécois | Daniel Turp | 8,787 | 33.93 | +5.31 |
|
New Democratic | Raymond Laurent | 899 | 3.47 | +1.64 |
|
Progressive Conservative | Nicole Roy-Arcelin | 608 | 2.35 | -2.02 |
|
Reform | Martin Masse | 272 | 1.05 | New |
| Total valid votes |
25,896 | 98.88 |
| Total rejected ballots |
294 | 1.12 |
| Turnout |
26,190 | 52.31 |
| Eligible voters |
50,063 |
|
Liberal hold |
Swing |
+0.96 |
| Source: Elections Canada[13] |
| 1993 Canadian federal election: Papineau—Saint-Michel |
| Party |
Candidate |
Votes | % | |
|
Liberal | André Ouellet | 20,064 | 51.98 | +5.99 |
|
Bloc Québécois | Daniel Boucher | 15,148 | 39.24 | |
|
Progressive Conservative | Carmen De Pontbriand | 1,686 | 4.37 | -28.86 |
|
New Democratic | Gisèle Charlebois | 708 | 1.83 | -13.27 |
|
Natural Law | André Beaudoin | 678 | 1.76 | |
|
Marxist–Leninist | Serge Lachapelle | 141 | 0.37 | |
|
Abolitionist | P. A. D'Aoust | 98 | 0.25 | |
|
Commonwealth of Canada | Normand Normandeau | 78 | 0.20 | -0.24 |
| Total valid votes/Expense limit |
38,601 | 100.00 |
| 1988 Canadian federal election: Papineau—Saint-Michel |
| Party |
Candidate |
Votes | % | |
|
Liberal | André Ouellet | 18,122 | 45.99 | +7.00 |
|
Progressive Conservative | Frank Venneri | 13,094 | 33.23 | -3.62 |
|
New Democratic | Giovanni Adamo | 5,948 | 15.10 | +1.97 |
|
Rhinoceros | Carole Ola Clermont | 987 | 2.51 | -3.38 |
|
Green | H. Joseph Vega | 469 | 1.19 | |
|
Communist | Line Chabot | 235 | 0.60 | +0.15 |
|
Independent | Francine Tremblay | 193 | 0.49 | |
|
Independent | Michel Dugré | 178 | 0.45 | |
|
Commonwealth of Canada | Normand Bélanger | 174 | 0.44 | +0.09 |
| Total valid votes/Expense limit |
39,400 | 100.00 |
Papineau, 1947–1987
Graph of election results in Papineau (1947–1987; minor parties that never got 2% of the vote or didn't run consistently are omitted)
| 1984 Canadian federal election |
| Party |
Candidate |
Votes | % | |
|
Liberal | André Ouellet | 12,754 | 38.99 | -35.69 |
|
Progressive Conservative | Tony Iacobaccio | 12,053 | 36.85 | +31.40 |
|
New Democratic | Paul Comtois | 4,295 | 13.13 | +3.81 |
|
Rhinoceros | Christian Jolicoeur | 1,925 | 5.89 | +0.52 |
|
Parti nationaliste | Gilles Maillé | 1,169 | 3.57 | |
|
Communist | Suzanne Dagenais | 147 | 0.45 | +0.22 |
|
Social Credit | Roland Mireault | 147 | 0.45 | -2.88 |
|
Commonwealth of Canada | Gilles Gervais | 113 | 0.35 | |
|
Independent | Doris Lacroix | 104 | 0.32 | |
| Total valid votes |
32,707 | 100.00 |
| 1980 Canadian federal election |
| Party |
Candidate |
Votes | % | |
|
Liberal | André Ouellet | 22,399 | 74.69 | +6.21 |
|
New Democratic | Jean-Marc Dompierre | 2,796 | 9.32 | +3.78 |
|
Progressive Conservative | Gérard Hogue | 1,634 | 5.45 | -2.24 |
|
Rhinoceros | La Mule Louis Harvey | 1,608 | 5.36 | +1.28 |
|
Social Credit | Albert Paiement | 999 | 3.33 | -8.38 |
|
Independent | Ghislaine Cloutier | 245 | 0.82 | |
|
Union populaire | Lucie Desrosiers | 170 | 0.57 | +0.13 |
|
Marxist–Leninist | Michel Gauthier | 71 | 0.24 | -0.18 |
|
Communist | Danielle Ferland | 68 | 0.23 | -0.22 |
| Total valid votes |
29,990 | 100.00 |
| 1979 Canadian federal election |
| Party |
Candidate |
Votes | % | |
|
Liberal | André Ouellet | 23,619 | 68.48 | +6.59 |
|
Social Credit | Albert Paiement | 4,039 | 11.71 | -0.64 |
|
Progressive Conservative | Claudy Mailly | 2,652 | 7.69 | -8.24 |
|
New Democratic | Jean A. Richard | 1,913 | 5.55 | -2.94 |
|
Rhinoceros | Jacques Hurtubise | 1,409 | 4.09 | |
|
Independent | Raymond Beaudoin | 412 | 1.19 | |
|
Communist | Claire Demers | 153 | 0.44 | -0.25 |
|
Union populaire | Jean Saint-Amour | 150 | 0.43 | |
|
Marxist–Leninist | Michel Gauthier | 144 | 0.42 | -0.24 |
| Total valid votes |
34,491 | 100.00 |
| 1974 Canadian federal election |
| Party |
Candidate |
Votes | % | |
|
Liberal | André Ouellet | 14,532 | 61.89 | +8.46 |
|
Progressive Conservative | Léon Vellone | 3,740 | 15.93 | +1.29 |
|
Social Credit | Albert Paiement | 2,899 | 12.35 | -7.85 |
|
New Democratic | Paul Marsan | 1,992 | 8.48 | -2.37 |
|
Communist | Richard Ducharme | 164 | 0.70 | |
|
Marxist–Leninist | Robert Wallace | 155 | 0.66 | |
| Total valid votes |
23,482 | 100.00 |
| 1972 Canadian federal election |
| Party |
Candidate |
Votes | % | |
|
Liberal | André Ouellet | 15,347 | 53.43 | -9.78 |
|
Social Credit | Albert Paiement | 5,802 | 20.20 | +15.39 |
|
Progressive Conservative | Angelo Tiveron | 4,205 | 14.64 | -3.68 |
|
New Democratic | Paul Marsan | 3,118 | 10.85 | -0.45 |
|
Independent | Robert Wallace | 254 | 0.88 | |
| Total valid votes |
28,726 | 100.00 |
Note: Social Credit vote is compared to Ralliement créditiste vote in the 1968 election.
| 1968 Canadian federal election |
| Party |
Candidate |
Votes | % | |
|
Liberal | André Ouellet | 14,379 | 63.20 | +5.23 |
|
Progressive Conservative | René Paquin | 4,168 | 18.32 | 0.00 |
|
New Democratic | Pierre Demers | 2,572 | 11.31 | -3.36 |
|
Ralliement créditiste | Jean-Louis Marier | 1,094 | 4.81 | |
|
Démocratisation Économique | Guy-Gilles Lacombe | 537 | 2.36 | |
| Total valid votes |
22,750 | 100.00 |
| Canadian federal by-election, 29 May 1967 |
| Party |
Candidate |
Votes | % | |
| On Mr. Favreau's resignation, 4 April 1967 |
|
Liberal | André Ouellet | 6,197 | 57.97 | +4.87 |
|
Progressive Conservative | Raymond Rochon | 1,958 | 18.32 | +1.25 |
|
New Democratic | Michel Bissonnet | 1,568 | 14.67 | +1.21 |
|
Radical chrétien | Albert Paiement | 702 | 6.57 | |
|
Independent | Albert Cameron | 265 | 2.48 | +0.42 |
| Total valid votes |
10,690 | 100.00 |
| 1965 Canadian federal election |
| Party |
Candidate |
Votes | % | |
|
Liberal | Guy Favreau | 13,920 | 53.10 | +0.73 |
|
Progressive Conservative | Basil Danchyshyn | 4,474 | 17.07 | +2.52 |
|
New Democratic | Arturo Moretti | 3,529 | 13.46 | +2.14 |
|
Ralliement créditiste | Albert Paiement | 2,367 | 9.03 | -7.54 |
|
Independent Liberal | Léo-C. Morin | 1,090 | 4.16 | |
|
Independent | Albert Cameron | 540 | 2.06 | |
|
Rhinoceros | Lucien Rivard | 297 | 1.13 | |
| Total valid votes |
26,217 | 100.00 |
Note: Ralliement créditiste vote is compared to Social Credit vote in the 1963 election.
| 1963 Canadian federal election |
| Party |
Candidate |
Votes | % | |
|
Liberal | Guy Favreau | 15,677 | 52.37 | -2.56 |
|
Social Credit | Albert Paiement | 4,959 | 16.56 | +10.82 |
|
Progressive Conservative | Alphonse Thérien | 4,353 | 14.54 | -14.25 |
|
New Democratic | Paul-Émile Trudel | 3,388 | 11.32 | +0.77 |
|
Ouvrier Indépendant | Lionel Bécotte | 1,064 | 3.55 | |
|
Candidat libéral des électeurs | Vincent Ialenti | 496 | 1.66 | |
| Total valid votes |
29,937 | 100.00 |
| 1962 Canadian federal election |
| Party |
Candidate |
Votes | % | |
|
Liberal | Adrien Meunier | 16,062 | 54.93 | +2.01 |
|
Progressive Conservative | Alphonse Thérien | 8,418 | 28.79 | -12.68 |
|
New Democratic | Vianney Desjardins | 3,083 | 10.54 | +6.74 |
|
Social Credit | Ferruccio Ariano | 1,680 | 5.74 | |
| Total valid votes |
29,243 | 100.00 |
Note: NDP vote is compared to CCF vote in 1958 election.
| 1958 Canadian federal election |
| Party |
Candidate |
Votes | % | |
|
Liberal | Adrien Meunier | 18,466 | 52.92 | -25.43 |
|
Progressive Conservative | Claude Danis | 14,468 | 41.46 | +28.03 |
|
Co-operative Commonwealth | Jean Riopel | 1,328 | 3.81 | -4.41 |
|
Independent | Archie Luccisano | 632 | 1.81 | |
| Total valid votes |
34,894 | 100.00 |
| 1957 Canadian federal election |
| Party |
Candidate |
Votes | % | |
|
Liberal | Adrien Meunier | 24,373 | 78.35 | +40.79 |
|
Progressive Conservative | Gaston Rodier | 4,177 | 13.43 | -5.05 |
|
Co-operative Commonwealth | Jean Riopel | 2,556 | 8.22 | +6.30 |
| Total valid votes |
31,106 | 100.00 |
| 1953 Canadian federal election |
| Party |
Candidate |
Votes | % | |
|
Independent Liberal | Adrien Meunier | 10,387 | 38.65 | |
|
Liberal | Émile Dufresne | 10,094 | 37.56 | -10.15 |
|
Progressive Conservative | Jules A. Le Beau | 4,966 | 18.48 | +16.24 |
|
Independent Liberal | Armand Meunier | 576 | 2.14 | |
|
Co-operative Commonwealth | Raymond Pineau | 514 | 1.91 | -0.15 |
|
Labor–Progressive | Germaine Leclerc | 337 | 1.25 | |
| Total valid votes |
26,874 | 100.00 |
| 1949 Canadian federal election |
| Party |
Candidate |
Votes | % |
|
Independent | Camillien Houde | 12,611 | 48.00 |
|
Liberal | J.-Adrien Meunier | 12,536 | 47.71 |
|
Progressive Conservative | Wilfred Kendall | 587 | 2.23 |
|
Co-operative Commonwealth | J.-E. Léopold Cadieux | 541 | 2.06 |
| Total valid votes |
26,275 | 100.00 |
See also
Wikinews has related news:
- List of Canadian federal electoral districts
- Past Canadian electoral districts
References
Notes
- Statistics Canada: 2017
- Statistics Canada: 2017
- Banerjee, Sidhartha (October 15, 2008). "Leave leader talk to the pundits, rookie MP Justin Trudeau focused on riding". The Canadian Press. Retrieved October 15, 2008. [dead link]
- "Canada Votes 2008: Papineau". CBC News. October 15, 2008. Retrieved October 15, 2008.
- "Mother Tongue (269), Knowledge of Official Languages (5), Age (15A) and Sex (3) for the Population Excluding Institutional Residents of Canada, Provinces and Territories and Federal Electoral Districts (2013 Representation Order), 2016 Census - 100% Data". August 2, 2017.
- "September 20, 2021 General Election Results Validated by the Returning Officer". Elections Canada. Retrieved September 29, 2021.
- "Official Voting Results — Papineau". Elections Canada. Retrieved May 22, 2021.
- "Final Election Expenses Limits for Candidates 43rd General Election – October 21, 2019". Elections Canada. May 12, 2020. Retrieved May 22, 2021.
- Elections Canada – Confirmed candidates for Papineau, 30 September 2015
- Elections Canada – Final Candidates Election Expenses Limits
- Pundits' Guide to Canadian Elections
- "Official Voting Results". Elections Canada.
- "By-Elections 1996 – Official Voting Results and Candidates' Contributions and Expenses". Elections Canada. August 27, 2018. Retrieved August 16, 2020.
| Parliament of Canada |
| Preceded by Calgary Southwest |
Riding represented by the Prime Minister
2015–present |
Succeeded by Incumbent |
|
|---|
| Liberal | |
|---|
| Bloc Québécois | |
|---|
| New Democratic | |
|---|
Federal ridings in Quebec |
|---|
| Central Quebec |
- Bécancour—Nicolet—Saurel
- Berthier—Maskinongé
- Joliette
- Lévis—Lotbinière
- Montcalm
- Portneuf—Jacques-Cartier
- Repentigny
- Saint-Maurice—Champlain
- Trois-Rivières
|
|---|
| Côte-Nord and Saguenay |
- Beauport—Côte-de-Beaupré—Île d'Orléans—Charlevoix
- Chicoutimi—Le Fjord
- Jonquière
- Manicouagan
- Lac-Saint-Jean
|
|---|
| Eastern Quebec | |
|---|
| The Eastern Townships | |
|---|
The Laurentides, Outaouais
and Northern Quebec | |
|---|
Montreal
(East, West, North & Laval) | |
|---|
| Montérégie | |
|---|
| Quebec City | |
|---|
See also: Quebec provincial electoral districts |
Текст в блоке "Читать" взят с сайта "Википедия" и доступен по лицензии Creative Commons Attribution-ShareAlike; в отдельных случаях могут действовать дополнительные условия.
Другой контент может иметь иную лицензию. Перед использованием материалов сайта WikiSort.org внимательно изучите правила лицензирования конкретных элементов наполнения сайта.
2019-2026
WikiSort.org - проект по пересортировке и дополнению контента Википедии

 2004 to 2011 election