world.wikisort.org - Canada
Kitchener—Conestoga is a provincial electoral district in Ontario, Canada, that has been represented in the Legislative Assembly of Ontario since the 2007 provincial election. Its population in 2006 was 114,405.
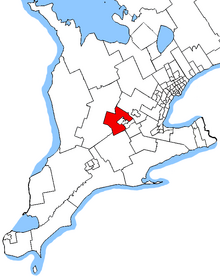 Kitchener—Conestoga in relation to Southern Ontario ridings | |||
| Provincial electoral district | |||
| Legislature | Legislative Assembly of Ontario | ||
| MPP |
Progressive Conservative | ||
| District created | 2006 | ||
| First contested | 2007 | ||
| Last contested | 2022 | ||
| Demographics | |||
| Population (2016) | 100,705 | ||
| Electors (2018) | 73,095 | ||
| Area (km²) | 906 | ||
| Pop. density (per km²) | 111.2 | ||
| Census division(s) | Waterloo | ||
| Census subdivision(s) | Kitchener, Wellesley, Wilmot, Woolwich | ||
Geography
The district includes the townships of Woolwich, Wellesley and Wilmot, and the southwestern part of the City of Kitchener, i.e., the part of the City of Kitchener lying west of Fischer-Hallman Road.
Members of Provincial Parliament
| Kitchener—Conestoga | ||||
|---|---|---|---|---|
| Assembly | Years | Member | Party | |
| Riding created | ||||
| 38th | 2007–2011 | Leeanna Pendergast | Liberal | |
| 40th | 2011–2014 | Michael Harris | Progressive Conservative | |
| 41st | 2014–2018 | |||
| 2018–2018 | Independent | |||
| 42nd | 2018–2022 | Mike Harris Jr. | Progressive Conservative | |
| 43rd | 2022–present | |||
Election results
| 2022 Ontario general election | ||||||||
|---|---|---|---|---|---|---|---|---|
| Party | Candidate | Votes | % | ±% | ||||
| Progressive Conservative | Mike Harris Jr. | 15,045 | 40.03 | +0.46 | ||||
| New Democratic | Karen Meissner | 10,851 | 28.87 | -9.10 | ||||
| Liberal | Melanie Van Alphen | 6,590 | 17.53 | +3.49 | ||||
| Green | Nasir Abdulle | 2,315 | 6.16 | -0.48 | ||||
| New Blue | Jim Karahalios | 2,223 | 5.91 | |||||
| Ontario Party | Elisabeth Perrin Snyder | 501 | 1.33 | |||||
| Populist | Jason Adair | 64 | 0.17 | |||||
| Total valid votes | 37,589 | |||||||
| Total rejected, unmarked and declined ballots | 234 | |||||||
| Turnout | ||||||||
| Eligible voters | ||||||||
| Progressive Conservative hold | Swing | +4.78 | ||||||
| Source: Elections Ontario[1] | ||||||||
| 2018 Ontario general election | ||||||||
|---|---|---|---|---|---|---|---|---|
| Party | Candidate | Votes | % | ±% | ||||
| Progressive Conservative | Mike Harris Jr. | 17,005 | 39.57 | +3.18 | ||||
| New Democratic | Kelly Dick | 16,319 | 37.97 | +16.78 | ||||
| Liberal | Joe Gowing | 6,035 | 14.04 | -19.30 | ||||
| Green | Bob Jonkman | 2,853 | 6.64 | -0.33 | ||||
| Libertarian | Daniel Benoy | 550 | 1.28 | -0.85 | ||||
| Consensus Ontario | Dan Holt | 212 | 0.49 | |||||
| Total valid votes | 42,974 | 100.0 | ||||||
| Turnout | 60.8 | |||||||
| Eligible voters | 70,712 | |||||||
| Source: Elections Ontario[2] | ||||||||
| 2014 Ontario general election | ||||||||
|---|---|---|---|---|---|---|---|---|
| Party | Candidate | Votes | % | ±% | ||||
| Progressive Conservative | Michael Harris | 17,083 | 36.39 | -7.82 | ||||
| Liberal | Wayne Wright | 15,664 | 33.34 | -2.16 | ||||
| New Democratic | James Villeneuve | 9,958 | 21.19 | +3.62 | ||||
| Green | David Weber | 3,277 | 6.97 | +4.22 | ||||
| Libertarian | David Schumm | 1,001 | 2.13 | – | ||||
| Total valid votes | 46,983 | 100.0 | ||||||
| Progressive Conservative hold | Swing | -2.83 | ||||||
| Source: Elections Ontario[3] | ||||||||
| 2011 Ontario general election | ||||||||
|---|---|---|---|---|---|---|---|---|
| Party | Candidate | Votes | % | ±% | ||||
| Progressive Conservative | Michael Harris | 18,017 | 44.18 | +7.15 | ||||
| Liberal | Leeanna Pendergast | 14,476 | 35.50 | -6.32 | ||||
| New Democratic | Mark Cairns | 7,165 | 17.57 | +5.92 | ||||
| Green | Robert Rose | 1,121 | 2.75 | -4.44 | ||||
| Total valid votes | 40,779 | 100.0 | ||||||
| Total rejected, unmarked and declined ballots | 244 | 0.59 | ||||||
| Turnout | 41,023 | 46.62 | ||||||
| Eligible voters | 87,992 | |||||||
| Progressive Conservative gain from Liberal | Swing | +6.74 | ||||||
| Source: Elections Ontario[4] | ||||||||
| 2007 Ontario general election | ||||||||
|---|---|---|---|---|---|---|---|---|
| Party | Candidate | Votes | % | ±% | ||||
| Liberal | Leeanna Pendergast | 16,315 | 41.82 | +2.03 | ||||
| Progressive Conservative | Michael Harris | 14,450 | 37.04 | -5.83 | ||||
| New Democratic | Mark Cairns | 4,545 | 11.65 | -0.08 | ||||
| Green | Colin Jones | 2,805 | 7.19 | |||||
| Family Coalition | Len Solomon | 510 | 1.31 | |||||
| Libertarian | Larry Stevens | 246 | 0.63 | |||||
| Freedom | David Driver | 145 | 0.37 | |||||
| Total valid votes | 39,016 | 100.0 | ||||||
| Liberal notional gain from Progressive Conservative | Swing | +3.93 | ||||||
^ Change based on redistributed results
2007 electoral reform referendum
| 2007 Ontario electoral reform referendum | |||
|---|---|---|---|
| Side | Votes | % | |
| First Past the Post | 24,287 | 63.7 | |
| Mixed member proportional | 13,872 | 36.3 | |
| Total valid votes | 38,159 | 100.0 | |
Sources
References
- "Vote Totals from Official Tabulation - Kitchener—Conestoga (048)" (PDF). Elections Ontario. Retrieved September 7, 2022.
- "Summary of Valid Votes Cast for each Candidate" (PDF). Elections Ontario. p. 5. Archived from the original (PDF) on 28 December 2018. Retrieved 16 January 2019.
- Elections Ontario (2014). "Official result from the records, 038 Kitchener-Conestoga" (PDF). Retrieved 27 June 2015.[permanent dead link]
- Elections Ontario (2011). "Official return from the records / Rapport des registres officiels - Kitchener—Conestoga" (PDF). Retrieved 2 June 2014.[permanent dead link]
Текст в блоке "Читать" взят с сайта "Википедия" и доступен по лицензии Creative Commons Attribution-ShareAlike; в отдельных случаях могут действовать дополнительные условия.
Другой контент может иметь иную лицензию. Перед использованием материалов сайта WikiSort.org внимательно изучите правила лицензирования конкретных элементов наполнения сайта.
Другой контент может иметь иную лицензию. Перед использованием материалов сайта WikiSort.org внимательно изучите правила лицензирования конкретных элементов наполнения сайта.
2019-2025
WikiSort.org - проект по пересортировке и дополнению контента Википедии
WikiSort.org - проект по пересортировке и дополнению контента Википедии