world.wikisort.org - USA
Wapello County is a county located in the U.S. state of Iowa. As of the 2020 census, the population was 35,437.[1] The county seat is Ottumwa.[2] The county was formed on February 17, 1843, and named for Wapello, a Meskwaki chief.[3]
Wapello County | |
|---|---|
U.S. county | |
 The courthouse in Ottumwa | |
 Location within the U.S. state of Iowa | |
 Iowa's location within the U.S. | |
| Coordinates: 41°01′46″N 92°24′32″W | |
| Country | |
| State | |
| Founded | 1843 |
| Named for | Wapello |
| Seat | Ottumwa |
| Largest city | Ottumwa |
| Area | |
| • Total | 436 sq mi (1,130 km2) |
| • Land | 432 sq mi (1,120 km2) |
| • Water | 4.2 sq mi (11 km2) 1.0%% |
| Population (2020) | |
| • Total | 35,437 |
| • Density | 81/sq mi (31/km2) |
| Time zone | UTC−6 (Central) |
| • Summer (DST) | UTC−5 (CDT) |
| Congressional district | 2nd |
| Website | www |

Wapello County is included in the Ottumwa, IA Micropolitan Statistical Area.
Geography
According to the U.S. Census Bureau, the county has a total area of 436 square miles (1,130 km2), of which 432 square miles (1,120 km2) is land and 4.2 square miles (11 km2) (1.0%) is water.[4]
Major highways
 U.S. Highway 34
 U.S. Highway 63
 Iowa Highway 16
 Iowa Highway 137
 Iowa Highway 149
Transit
- Ottumwa station
- Ottumwa Transit Authority
- List of intercity bus stops in Iowa
Adjacent counties
- Mahaska County (northwest)
- Keokuk County (northeast)
- Jefferson County (east)
- Davis County (south)
- Monroe County (west)
Demographics
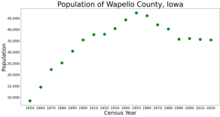
| Historical population | |||
|---|---|---|---|
| Census | Pop. | %± | |
| 1850 | 8,471 | — | |
| 1860 | 14,518 | 71.4% | |
| 1870 | 22,346 | 53.9% | |
| 1880 | 25,285 | 13.2% | |
| 1890 | 30,426 | 20.3% | |
| 1900 | 35,426 | 16.4% | |
| 1910 | 37,743 | 6.5% | |
| 1920 | 37,937 | 0.5% | |
| 1930 | 40,480 | 6.7% | |
| 1940 | 44,280 | 9.4% | |
| 1950 | 47,397 | 7.0% | |
| 1960 | 46,126 | −2.7% | |
| 1970 | 42,149 | −8.6% | |
| 1980 | 40,241 | −4.5% | |
| 1990 | 35,696 | −11.3% | |
| 2000 | 36,051 | 1.0% | |
| 2010 | 35,625 | −1.2% | |
| 2020 | 35,437 | −0.5% | |
| U.S. Decennial Census[5] 1790-1960[6] 1900-1990[7] 1990-2000[8] 2010-2018[9] | |||
2020 census
The 2020 census recorded a population of 35,437 in the county, with a population density of 81.2225/sq mi (31.3602/km2). There were 15,734 housing units, of which 14,167 were occupied.[1]
| Race | Num. | Perc. |
|---|---|---|
| White (NH) | 27,295 | 77.02% |
| Black or African American (NH) | 1,443 | 4.1% |
| Native American (NH) | 66 | 0.2% |
| Asian (NH) | 622 | 1.8% |
| Pacific Islander (NH) | 518 | 1.5% |
| Other/Mixed (NH) | 1,161 | 3.3% |
| Hispanic or Latino | 4,332 | 12.22% |
2010 census
The 2010 census recorded a population of 35,625 in the county, with a population density of 82.5016/sq mi (31.8540/km2). There were 16,098 housing units, of which 14,552 were occupied.[11]
2000 census

As of the census[12] of 2000, there were 36,051 people, 14,784 households, and 9,801 families residing in the county. The population density was 84 people per square mile (32/km2). There were 15,873 housing units at an average density of 37 per square mile (14/km2). The racial makeup of the county was 96.28% White, 0.93% Black or African American, 0.28% Native American, 0.65% Asian, 0.02% Pacific Islander, 1.05% from other races, and 0.79% from two or more races. 2.22% of the population were Hispanic or Latino of any race.
There were 14,784 households, out of which 28.80% had children under the age of 18 living with them, 52.70% were married couples living together, 9.90% had a female householder with no husband present, and 33.70% were non-families. 28.20% of all households were made up of individuals, and 13.40% had someone living alone who was 65 years of age or older. The average household size was 2.37 and the average family size was 2.89.
In the county, the population was spread out, with 23.30% under the age of 18, 9.70% from 18 to 24, 26.00% from 25 to 44, 23.30% from 45 to 64, and 17.80% who were 65 years of age or older. The median age was 39 years. For every 100 females there were 94.80 males. For every 100 females age 18 and over, there were 91.70 males.
The median income for a household in the county was $32,188, and the median income for a family was $39,224. Males had a median income of $31,346 versus $21,286 for females. The per capita income for the county was $16,500. About 9.40% of families and 13.20% of the population were below the poverty line, including 18.00% of those under age 18 and 7.90% of those age 65 or over.
Communities
Cities
- Agency
- Blakesburg
- Chillicothe
- Eddyville
- Eldon
- Kirkville
- Ottumwa
Unincorporated communities
- Ashland
- Bladensburg
- Dahlonega
- Dudley
- Farson
- Munterville
- Phillips
- Pickwick
- Ottumwa Junction
- Rutledge
Townships
- Adams
- Agency
- Cass
- Center
- Columbia
- Competine
- Dahlonega
- Green
- Highland
- Keokuk
- Pleasant
- Polk
- Richland
- Washington
Population ranking
The population ranking of the following table is based on the 2020 census of Wapello County.[1]
† county seat
| Rank | City/Town/etc. | Municipal type | Population (2020 Census) |
|---|---|---|---|
| 1 | † Ottumwa | City | 25,529 |
| 2 | Eddyville (partially in Mahaska and Monroe Counties) | City | 970 |
| 3 | Eldon | City | 783 |
| 4 | Agency | City | 620 |
| 5 | Blakesburg | City | 274 |
| 6 | Kirkville | City | 157 |
| 7 | Chillicothe | City | 76 |
Politics
| Year | Republican | Democratic | Third party | |||
|---|---|---|---|---|---|---|
| No. | % | No. | % | No. | % | |
| 2020 | 9,516 | 60.87% | 5,821 | 37.24% | 296 | 1.89% |
| 2016 | 8,715 | 57.53% | 5,594 | 36.93% | 840 | 5.54% |
| 2012 | 6,789 | 43.05% | 8,663 | 54.93% | 318 | 2.02% |
| 2008 | 6,663 | 41.80% | 8,820 | 55.33% | 457 | 2.87% |
| 2004 | 7,403 | 44.31% | 9,125 | 54.62% | 179 | 1.07% |
| 2000 | 6,313 | 41.70% | 8,355 | 55.19% | 471 | 3.11% |
| 1996 | 4,828 | 32.69% | 8,437 | 57.12% | 1,505 | 10.19% |
| 1992 | 4,852 | 30.17% | 8,670 | 53.91% | 2,561 | 15.92% |
| 1988 | 5,350 | 34.14% | 10,177 | 64.93% | 146 | 0.93% |
| 1984 | 7,098 | 39.88% | 10,545 | 59.24% | 157 | 0.88% |
| 1980 | 7,475 | 42.31% | 8,923 | 50.50% | 1,270 | 7.19% |
| 1976 | 6,786 | 39.30% | 10,249 | 59.35% | 233 | 1.35% |
| 1972 | 9,301 | 51.19% | 8,348 | 45.94% | 522 | 2.87% |
| 1968 | 7,825 | 41.96% | 9,375 | 50.28% | 1,447 | 7.76% |
| 1964 | 5,524 | 28.26% | 13,971 | 71.48% | 51 | 0.26% |
| 1960 | 11,036 | 49.79% | 11,116 | 50.15% | 15 | 0.07% |
| 1956 | 10,401 | 48.65% | 10,960 | 51.26% | 20 | 0.09% |
| 1952 | 11,571 | 52.24% | 10,449 | 47.17% | 130 | 0.59% |
| 1948 | 7,875 | 41.50% | 10,841 | 57.13% | 260 | 1.37% |
| 1944 | 8,244 | 43.19% | 10,732 | 56.22% | 113 | 0.59% |
| 1940 | 9,039 | 43.03% | 11,880 | 56.56% | 87 | 0.41% |
| 1936 | 7,647 | 41.31% | 10,578 | 57.14% | 287 | 1.55% |
| 1932 | 7,256 | 42.49% | 9,504 | 55.66% | 316 | 1.85% |
| 1928 | 11,586 | 66.10% | 5,793 | 33.05% | 149 | 0.85% |
| 1924 | 9,870 | 56.96% | 3,039 | 17.54% | 4,420 | 25.51% |
| 1920 | 9,884 | 67.99% | 4,131 | 28.42% | 522 | 3.59% |
| 1916 | 4,398 | 47.65% | 3,994 | 43.28% | 837 | 9.07% |
| 1912 | 2,755 | 32.53% | 3,102 | 36.62% | 2,613 | 30.85% |
| 1908 | 4,541 | 50.69% | 3,724 | 41.57% | 694 | 7.75% |
| 1904 | 4,912 | 60.60% | 2,473 | 30.51% | 720 | 8.88% |
| 1900 | 4,742 | 53.21% | 3,902 | 43.78% | 268 | 3.01% |
| 1896 | 4,319 | 50.75% | 4,041 | 47.49% | 150 | 1.76% |
See also
- Big 4 Fair Art Hall, located at the Wapello County Fairgrounds
- Wapello County Courthouse
- National Register of Historic Places listings in Wapello County, Iowa
References
- "2020 Census State Redistricting Data". census.gov. United states Census Bureau. Retrieved August 12, 2021.
- "Find a County". National Association of Counties. Retrieved June 7, 2011.
- "Wapello County". Archived from the original on April 26, 2007. Retrieved January 20, 2008.
- "US Gazetteer files: 2010, 2000, and 1990". United States Census Bureau. February 12, 2011. Retrieved April 23, 2011.
- "U.S. Decennial Census". United States Census Bureau. Retrieved July 20, 2014.
- "Historical Census Browser". University of Virginia Library. Retrieved July 20, 2014.
- "Population of Counties by Decennial Census: 1900 to 1990". United States Census Bureau. Retrieved July 20, 2014.
- "Census 2000 PHC-T-4. Ranking Tables for Counties: 1990 and 2000" (PDF). United States Census Bureau. Retrieved July 20, 2014.
- "State & County QuickFacts". United States Census Bureau. Archived from the original on August 6, 2011. Retrieved July 20, 2014.
- "P2 HISPANIC OR LATINO, AND NOT HISPANIC OR LATINO BY RACE – 2020: DEC Redistricting Data (PL 94-171) – Wapello County, Iowa".
- "Population & Housing Occupancy Status 2010" (PDF). United States Census Bureau American FactFinder. Retrieved August 15, 2022.
- "U.S. Census website". United States Census Bureau. Retrieved January 31, 2008.
- Leip, David. "Dave Leip's Atlas of U.S. Presidential Elections". uselectionatlas.org. Retrieved April 28, 2018.
External links
Places adjacent to Wapello County, Iowa | ||||||||||||||||
|---|---|---|---|---|---|---|---|---|---|---|---|---|---|---|---|---|
| ||||||||||||||||
Municipalities and communities of Wapello County, Iowa, United States | ||
|---|---|---|
County seat: Ottumwa | ||
| Cities |
|  |
| Townships |
| |
| Unincorporated communities | ||
| Footnotes | ‡This populated place also has portions in an adjacent county or counties | |
| ||
State of Iowa | |
|---|---|
Des Moines (capital) | |
| Topics |
|
| Regions |
|
| Largest cities |
|
| Counties |
|
Authority control | |
|---|---|
| General | |
| National libraries | |
| Other | |
На других языках
[de] Wapello County
Das Wapello County[3] ist ein County im US-amerikanischen Bundesstaat Iowa. Im Jahr 2010 hatte das County 35.625 Einwohner und eine Bevölkerungsdichte von 31,9 Einwohnern pro Quadratkilometer. Bis 2013 verringerte sich die Einwohnerzahl auf 35.391.[4] Der Verwaltungssitz (County Seat) ist Ottumwa.[5]- [en] Wapello County, Iowa
[es] Condado de Wapello
El condado de Wapello (en inglés: Wapello County, Iowa) es un condado del estado de Iowa, Estados Unidos. Según el censo de 2020, tiene una población de 35 437 habitantes.[1][ru] Уопелло (округ)
Уо́пелло[1] (англ. Wapello County) — округ в США, штате Айова. На 2000 год численность населения составляла &&&&&&&&&&036051.&&&&&036 051 человек. По оценке бюро переписи населения США в 2009 году население округа составляло &&&&&&&&&&035334.&&&&&035 334 человек.[2] Окружным центром является город Оттамуа.Другой контент может иметь иную лицензию. Перед использованием материалов сайта WikiSort.org внимательно изучите правила лицензирования конкретных элементов наполнения сайта.
WikiSort.org - проект по пересортировке и дополнению контента Википедии