world.wikisort.org - USA
Linn County is a county located in the U.S. state of Iowa. As of the 2020 census, the population was 230,299,[1] making it the second-most populous county in Iowa. The county seat is Cedar Rapids.[2] Linn County is named in honor of Senator Lewis F. Linn of Missouri.[3] Linn County is included in the Cedar Rapids, IA Metropolitan Statistical Area.[4]
Linn County | |
|---|---|
U.S. county | |
 Linn County Courthouse | |
|
Logo | |
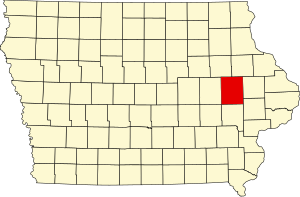 Location within the U.S. state of Iowa | |
 Iowa's location within the U.S. | |
| Coordinates: 42°04′43″N 91°35′59″W | |
| Country | |
| State | |
| Founded | 1839 |
| Named for | Lewis Linn |
| Seat | Cedar Rapids |
| Largest city | Cedar Rapids |
| Area | |
| • Total | 725 sq mi (1,880 km2) |
| • Land | 717 sq mi (1,860 km2) |
| • Water | 7.6 sq mi (20 km2) 1.1% |
| Population (2020) | |
| • Total | 230,299 |
| • Density | 320/sq mi (120/km2) |
| Time zone | UTC−6 (Central) |
| • Summer (DST) | UTC−5 (CDT) |
| Congressional district | 1st |
| Website | www |
History
The earliest inhabitants of Linn County, prior to Anglo settlement, were the Sac and Fox tribes. Relations were described by 20th century historians as amicable. Native Americans provided food and furs to whites in exchange for merchandise.[5]
Linn County was created as a named but unorganized area on December 21, 1837, as a part of Wisconsin Territory. It became part of Iowa Territory on July 4, 1838, when the territory was organized.[6] Linn County was organized by the first legislative assembly of the Iowa Territory on January 15, 1839. A site was selected for its first county seat along Indian Creek, and was named Marion, after the Revolutionary War general Francis Marion. As early as 1855, there were debates over moving the county seat to the fast-growing Cedar Rapids, southwest of Marion, but it was not until November 6, 1919, that there were enough votes in favor of the move (9,960 to 4,823).[7] The first rail line was built through Cedar Rapids in 1859, and made the town (and the county) a major commercial hub in eastern Iowa.
Many areas of the county were damaged by the flooding of Cedar River in June 2008, and again during the August 2020 Midwest derecho.
Geography
According to the U.S. Census Bureau, the county has a total area of 725 square miles (1,880 km2), of which 717 square miles (1,860 km2) is land and 7.6 square miles (20 km2) (1.1%) is water.[8]
Major highways
 Interstate 380
 Iowa Highway 27
 U.S. Highway 30
 U.S. Highway 151
 U.S. Highway 218
 Iowa Highway 1
 Iowa Highway 13
Transit
- Cedar Rapids Transit
- List of intercity bus stops in Iowa
Adjacent counties
- Benton County (west)
- Buchanan County (northwest)
- Cedar County (southeast)
- Delaware County (northeast)
- Iowa County (southwest)
- Johnson County (south)
- Jones County (east)
Demographics
| Historical population | |||
|---|---|---|---|
| Census | Pop. | %± | |
| 1850 | 5,444 | — | |
| 1860 | 18,947 | 248.0% | |
| 1870 | 31,080 | 64.0% | |
| 1880 | 37,237 | 19.8% | |
| 1890 | 45,303 | 21.7% | |
| 1900 | 55,392 | 22.3% | |
| 1910 | 60,720 | 9.6% | |
| 1920 | 74,004 | 21.9% | |
| 1930 | 82,336 | 11.3% | |
| 1940 | 89,142 | 8.3% | |
| 1950 | 104,274 | 17.0% | |
| 1960 | 136,899 | 31.3% | |
| 1970 | 163,213 | 19.2% | |
| 1980 | 169,775 | 4.0% | |
| 1990 | 168,767 | −0.6% | |
| 2000 | 191,701 | 13.6% | |
| 2010 | 211,226 | 10.2% | |
| 2020 | 230,299 | 9.0% | |
| U.S. Decennial Census[9] 1790–1960[10] 1900–1990[11] 1990–2000[12] 2010–2019[13] | |||

2020 census
The 2020 census recorded a population of 230,299 in the county, with a population density of 317.2724/sq mi (122.49956/km2). 94.04% of the population reported being of one race. 78.91% were non-Hispanic White, 7.14% were Black, 3.87% were Hispanic, 0.24% were Native American, 2.33% were Asian, 0.23% were Native Hawaiian or Pacific Islander and 7.28% were some other race or more than one race. There were 101,230 housing units, of which 94,751 were occupied.[1]
2010 census
The 2010 census recorded a population of 211,226 in the county, with a population density of 294.4163/sq mi (113.6748/km2). There were 92,251 housing units, of which 86,134 were occupied.[14]
2000 census

At the 2000 census there were 191,701 people, 76,753 households, and 50,349 families in the county. The population density was 267 inhabitants per square mile (103/km2). There were 80,551 housing units at an average density of 112 per square mile (43/km2). The racial makup of the county was 93.90% White, 2.57% Black or African American, 0.22% Native American, 1.37% Asian, 0.05% Pacific Islander, 0.46% from other races, and 1.44% from two or more races. 1.42%.[15] were Hispanic or Latino of any race.
Of the 76,753 households 31.80% had children under the age of 18 living with them, 53.20% were married couples living together, 9.00% had a female householder with no husband present, and 34.40% were non-families. 27.50% of households were one person and 8.90% were one person aged 65 or older. The average household size was 2.43 and the average family size was 2.99.
Age spread: 25.30% under the age of 18, 10.10% from 18 to 24, 30.30% from 25 to 44, 22.10% from 45 to 64, and 12.20% 65 or older. The median age was 35 years. For every 100 females, there were 96.10 males. For every 100 females age 18 and over, there were 93.40 males.
The median household income was $46,206 and the median family income was $56,494. Males had a median income of $38,525 versus $26,403 for females. The per capita income for the county was $22,977. About 4.30% of families and 6.50% of the population were below the poverty line, including 7.60% of those under age 18 and 6.40% of those age 65 or over.
Government
On July 24, 2007, the voters of Linn County approved a measure to change the form of government from a three-member Board of Supervisors elected at large to a five-member Board of Supervisors elected by district. The supervisors serve overlapping four-year terms.[16]
The current supervisors are:
| Name | District | First elected |
|---|---|---|
| Stacey Walker | District 1 | 2016 |
| Ben Rogers | District 2 | 2008 |
| Louis Zumbach | District 3 | 2020 |
The Board of Supervisors operate as both the executive and legislative branches of Linn County government. The following departments report directly to the Board of Supervisors: Communications, Community Services, Engineering/Secondary Road, Facilities, Finance and Budget, Human Resources, Information Technology, LIFTS (para-transit), Planning and Development, Policy and Administration, Purchasing, Risk Management, Soil and Water Conservation, Sustainability, and Veteran Affairs. Conservation and Public Health report to independent boards appointed by the Board of Supervisors. The County Attorney, Auditor, Recorder, Sheriff and Treasurer are elected separately.[17]
| Year | Republican | Democratic | Third party | |||
|---|---|---|---|---|---|---|
| No. | % | No. | % | No. | % | |
| 2020 | 53,364 | 41.87% | 70,874 | 55.61% | 3,220 | 2.53% |
| 2016 | 48,390 | 41.32% | 58,935 | 50.33% | 9,773 | 8.35% |
| 2012 | 47,622 | 40.20% | 68,581 | 57.90% | 2,250 | 1.90% |
| 2008 | 43,626 | 38.48% | 68,037 | 60.01% | 1,706 | 1.50% |
| 2004 | 49,442 | 44.65% | 60,442 | 54.58% | 856 | 0.77% |
| 2000 | 40,417 | 43.90% | 48,897 | 53.11% | 2,750 | 2.99% |
| 1996 | 30,958 | 37.28% | 45,497 | 54.79% | 6,580 | 7.92% |
| 1992 | 30,215 | 33.99% | 38,567 | 43.39% | 20,103 | 22.62% |
| 1988 | 33,129 | 43.18% | 42,993 | 56.04% | 596 | 0.78% |
| 1984 | 41,061 | 51.12% | 38,528 | 47.97% | 726 | 0.90% |
| 1980 | 36,254 | 46.35% | 31,950 | 40.84% | 10,020 | 12.81% |
| 1976 | 36,513 | 47.79% | 38,252 | 50.07% | 1,632 | 2.14% |
| 1972 | 36,503 | 52.78% | 31,370 | 45.36% | 1,287 | 1.86% |
| 1968 | 30,918 | 47.99% | 29,898 | 46.40% | 3,614 | 5.61% |
| 1964 | 21,845 | 35.22% | 40,106 | 64.66% | 78 | 0.13% |
| 1960 | 34,200 | 55.30% | 27,614 | 44.65% | 25 | 0.04% |
| 1956 | 33,402 | 60.60% | 21,667 | 39.31% | 47 | 0.09% |
| 1952 | 31,383 | 58.72% | 21,818 | 40.83% | 240 | 0.45% |
| 1948 | 20,881 | 48.45% | 20,995 | 48.71% | 1,222 | 2.84% |
| 1944 | 21,293 | 50.03% | 21,123 | 49.63% | 146 | 0.34% |
| 1940 | 23,581 | 54.54% | 19,531 | 45.17% | 123 | 0.28% |
| 1936 | 19,129 | 48.06% | 19,724 | 49.55% | 953 | 2.39% |
| 1932 | 18,733 | 50.75% | 17,693 | 47.93% | 489 | 1.32% |
| 1928 | 25,452 | 68.24% | 11,715 | 31.41% | 132 | 0.35% |
| 1924 | 22,371 | 64.49% | 5,941 | 17.13% | 6,378 | 18.39% |
| 1920 | 20,036 | 72.02% | 6,932 | 24.92% | 853 | 3.07% |
| 1916 | 8,212 | 55.67% | 6,131 | 41.56% | 408 | 2.77% |
| 1912 | 4,326 | 33.83% | 5,422 | 42.41% | 3,038 | 23.76% |
| 1908 | 6,938 | 54.22% | 5,493 | 42.93% | 364 | 2.84% |
| 1904 | 8,131 | 65.36% | 3,600 | 28.94% | 709 | 5.70% |
| 1900 | 7,745 | 59.10% | 5,019 | 38.30% | 342 | 2.61% |
| 1896 | 7,335 | 57.14% | 5,283 | 41.16% | 218 | 1.70% |
| 1892 | 5,602 | 50.85% | 5,032 | 45.67% | 383 | 3.48% |
| 1888 | 5,247 | 53.19% | 4,373 | 44.33% | 244 | 2.47% |
| 1884 | 4,840 | 52.48% | 4,306 | 46.69% | 77 | 0.83% |
| 1880 | 4,508 | 58.52% | 2,875 | 37.32% | 320 | 4.15% |
Communities
Cities
- Alburnett
- Bertram
- Cedar Rapids
- Center Point
- Central City
- Coggon
- Ely
- Fairfax
- Hiawatha
- Lisbon
- Marion
- Mount Vernon
- Palo
- Prairieburg
- Robins
- Springville
- Walford
- Walker
Unincorporated communities
- Covington
- Lafayette
- Toddville
- Troy Mills
- Waubeek
- Western
- Whittier
- Viola
Ghost towns
Townships
- Bertram
- Boulder
- Brown
- Buffalo
- Clinton
- College
- Fairfax
- Fayette
- Franklin
- Grant
- Jackson
- Linn
- Maine
- Marion
- Monroe
- Otter Creek
- Putnam
- Spring Grove
- Washington
Population ranking
The population ranking of the following table is based on the 2020 census of Linn County.[1]
† county seat
| Rank | City/Town/etc. | Municipal type | Population (2020 Census) |
|---|---|---|---|
| 1 | † Cedar Rapids | City | 137,710 |
| 2 | Marion | City | 41,535 |
| 3 | Hiawatha | City | 7,183 |
| 4 | Mount Vernon | City | 4,527 |
| 5 | Robins | City | 3,353 |
| 6 | Fairfax | City | 2,828 |
| 7 | Center Point | City | 2,579 |
| 8 | Ely | City | 2,328 |
| 9 | Lisbon | City | 2,233 |
| 10 | Palo | City | 1,407 |
| 11 | Walford (partially in Benton County) | City | 1,366 |
| 12 | Central City | City | 1,264 |
| 13 | Springville | City | 1,154 |
| 14 | Coggon | City | 701 |
| 15 | Walker | City | 688 |
| 16 | Alburnett | City | 675 |
| 17 | Bertram | City | 269 |
| 18 | Prairieburg | City | 160 |
See also
- National Register of Historic Places listings in Linn County, Iowa
- USS Linn County (LST-900)
References
- "2020 Census State Redistricting Data". census.gov. United states Census Bureau. Retrieved August 12, 2021.
- "Find a County". National Association of Counties. Retrieved June 7, 2011.
- Gannett, Henry (1905). The Origin of Certain Place Names in the United States. U.S. Government Printing Office. p. 187.
- United States Office of Management and Budget. "Update of Statistical Area Definitions and Guidance on Their Uses" (PDF). pp. 5, 36. Archived from the original (PDF) on May 14, 2006. Retrieved July 21, 2006.
- Brewer, Luther; Barthinus, Wick (1911). History of Linn County Iowa. Chicago: The Pioneer Publishing Company. pp. 10–12.
- "WI: Individual County Chronologies". publications.newberry.org. Archived from the original on April 14, 2017. Retrieved September 28, 2016.
- "History of Linn County". Archived from the original on May 3, 2009.
- "US Gazetteer files: 2010, 2000, and 1990". United States Census Bureau. February 12, 2011. Retrieved April 23, 2011.
- "U.S. Decennial Census". United States Census Bureau. Retrieved July 18, 2014.
- "Historical Census Browser". University of Virginia Library. Retrieved July 18, 2014.
- "Population of Counties by Decennial Census: 1900 to 1990". United States Census Bureau. Retrieved July 18, 2014.
- "Census 2000 PHC-T-4. Ranking Tables for Counties: 1990 and 2000" (PDF). United States Census Bureau. Retrieved July 18, 2014.
- "State & County QuickFacts". United States Census Bureau. Archived from the original on June 7, 2011. Retrieved July 18, 2014.
- "Population & Housing Occupancy Status 2010" (PDF). United States Census Bureau American FactFinder. Retrieved August 15, 2022.
- "U.S. Census website". United States Census Bureau. Retrieved January 31, 2008.
- "Board of Supervisors". Archived from the original on February 18, 2009. Retrieved February 18, 2009.
- "Linn County, IA – Official Website | Official Website". www.linncounty.org. Retrieved January 20, 2016.
- Leip, David. "Dave Leip's Atlas of U.S. Presidential Elections". uselectionatlas.org. Retrieved April 9, 2018.
External links
- Linn County government's website
- The History of Linn county, Iowa Western Historical Company(1878 copyright expired) This searchable and pdf downloadable book was scanned into the public domain by Google books.
- History of Linn County Iowa by Luther A. Brewer and Barthinius L. Wick The Pioneer Publishing Company(1911 copyright expired) This searchable and pdf downloadable book was scanned into the public domain by Google books.
Places adjacent to Linn County, Iowa | ||||||||||||||||
|---|---|---|---|---|---|---|---|---|---|---|---|---|---|---|---|---|
| ||||||||||||||||
Municipalities and communities of Linn County, Iowa, United States | ||
|---|---|---|
County seat: Cedar Rapids | ||
| Cities |
|  |
| Townships |
| |
| Unincorporated communities | ||
| Footnotes | ‡This populated place also has portions in an adjacent county or counties | |
| ||
State of Iowa | |
|---|---|
Des Moines (capital) | |
| Topics |
|
| Regions |
|
| Largest cities |
|
| Counties |
|
Authority control | |
|---|---|
| General | |
| National libraries | |
| Other | |
На других языках
[de] Linn County (Iowa)
Das Linn County[1] ist ein County im Osten des US-amerikanischen Bundesstaates Iowa. Bei der Volkszählung im Jahr 2010 hatte das County 211.226 Einwohner und eine Bevölkerungsdichte von 113,6 Einwohnern pro Quadratkilometer.[2] Der Verwaltungssitz (County Seat) ist Cedar Rapids[3], benannt nach dem Cedar River, der durch das County fließt und in den 1840er Jahren die Säge- und Getreidemühlen angetrieben hat.- [en] Linn County, Iowa
[ru] Линн (округ, Айова)
Линн[1] (англ. Linn County) — округ в США, штате Айова. На 2000 год численность населения составляла &&&&&&&&&0191702.&&&&&0191 702 человек. По оценке бюро переписи населения США в 2009 году население округа составляло &&&&&&&&&0209226.&&&&&0209 226 человек.[2] Окружным центром является город Сидар-Рапидс.Другой контент может иметь иную лицензию. Перед использованием материалов сайта WikiSort.org внимательно изучите правила лицензирования конкретных элементов наполнения сайта.
WikiSort.org - проект по пересортировке и дополнению контента Википедии