world.wikisort.org - USA
Tolland County is a county in the northeastern part of the U.S. state of Connecticut. As of the 2020 census, its population was 149,788.[1] It is incorporated into 13 towns and was originally formed on 13 October 1785 from portions of eastern Hartford County and western Windham County.
Tolland County | |
|---|---|
County of Connecticut | |
 The University of Connecticut's main campus, in Storrs. | |
 Location within the U.S. state of Connecticut | |
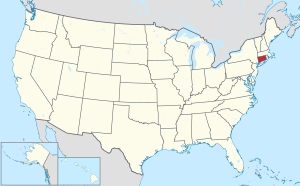 Connecticut's location within the U.S. | |
| Coordinates: 41°51′N 72°20′W | |
| Country | |
| State | |
| Founded | 1785 |
| Named for | Tolland, Somerset |
| Seat | none (since 1960) Tolland (1785-1889) Rockville (1889-1960) |
| Largest town | Vernon |
| Area | |
| • Total | 417 sq mi (1,080 km2) |
| • Land | 410 sq mi (1,100 km2) |
| • Water | 6.8 sq mi (18 km2) 1.6%% |
| Population (2020) | |
| • Total | 149,788 |
| • Density | 359.2/sq mi (138.7/km2) |
| Time zone | UTC−5 (Eastern) |
| • Summer (DST) | UTC−4 (EDT) |
| Congressional district | 2nd |

The county is included in the Hartford-East Hartford-Middletown, CT Metropolitan Statistical Area.
Counties in Connecticut have no governmental function; all legal power is vested in the state, city and town governments. The office of High Sheriff in Connecticut counties was officially abolished by ballot in 2000, and corrections and court services were transferred to the state marshals. Tolland County has the same boundaries as the Tolland Judicial District.
Geography
According to the U.S. Census Bureau, the county has a total area of 417 square miles (1,080 km2), of which 410 square miles (1,100 km2) is land and 6.8 square miles (18 km2) (1.6%) is water.[2] It is the second-smallest county in Connecticut by land area and smallest by total area.
Adjacent counties
- Hartford County - west
- New London County - south
- Windham County - east
- Hampden County, Massachusetts - northwest
- Worcester County, Massachusetts - northeast
Demographics
| Historical population | |||
|---|---|---|---|
| Census | Pop. | %± | |
| 1790 | 13,251 | — | |
| 1800 | 14,319 | 8.1% | |
| 1810 | 13,779 | −3.8% | |
| 1820 | 14,330 | 4.0% | |
| 1830 | 18,702 | 30.5% | |
| 1840 | 17,980 | −3.9% | |
| 1850 | 20,091 | 11.7% | |
| 1860 | 20,709 | 3.1% | |
| 1870 | 22,000 | 6.2% | |
| 1880 | 24,112 | 9.6% | |
| 1890 | 25,081 | 4.0% | |
| 1900 | 24,523 | −2.2% | |
| 1910 | 26,459 | 7.9% | |
| 1920 | 27,216 | 2.9% | |
| 1930 | 28,659 | 5.3% | |
| 1940 | 31,866 | 11.2% | |
| 1950 | 44,709 | 40.3% | |
| 1960 | 68,737 | 53.7% | |
| 1970 | 103,440 | 50.5% | |
| 1980 | 114,823 | 11.0% | |
| 1990 | 128,699 | 12.1% | |
| 2000 | 136,364 | 6.0% | |
| 2010 | 152,691 | 12.0% | |
| 2020 | 149,788 | −1.9% | |
| U.S. Decennial Census[3] 1790-1960[4] 1900-1990[5] 1990-2000[6] 2010-2018[7] | |||
2000 census
As of the year 2000, there were 136,364 people, 49,431 households, and 34,156 families living in the county. The population density was 332 sq mi (128/km2). There were 51,570 housing units at an average density of 126/sq mi (49/km2). The racial makeup of the county was 92.34% White, 2.72% Black or African American, 0.21% Native American, 2.27% Asian, 0.03% Pacific Islander, 1.08% from other races, and 1.35% from two or more races. 2.84% of the population were Hispanic or Latino of any race. 14.9% were of Irish, 14.1% Italian, 9.9% English, 8.8% French, 8.2% German, 8.0% Polish and 5.7% French Canadian ancestry. 90.5% spoke English, 2.9% Spanish and 1.6% French as their first language.
There were 49,431 households, out of which 33.30% had children under the age of 18 living with them, 58.00% were married couples living together, 8.00% had a female householder with no husband present, and 30.90% were non-families. 23.50% of all households were made up of individuals, and 7.70% had someone living alone who was 65 years of age or older. The average household size was 2.54 and the average family size was 3.03.
In the county, the population was spread out, with 23.10% under the age of 18, 12.90% from 18 to 24, 30.70% from 25 to 44, 23.20% from 45 to 64, and 10.20% who were 65 years of age or older. The median age was 36 years. For every 100 females, there were 100.60 males. For every 100 females age 18 and over, there were 99.50 males.
The median income for a household in the county was $59,044, and the median income for a family was $70,856. Males had a median income of $46,619 versus $34,255 for females. The per capita income for the county was $25,474. 5.60% of the population and 2.90% of families were below the poverty line. Out of the total people living in poverty, 4.60% are under the age of 18 and 5.20% are 65 or older.
2010 census
As of the 2010 United States Census, there were 152,691 people, 54,477 households, and 36,707 families living in the county.[8] The population density was 372.2 inhabitants per square mile (143.7/km2). There were 57,963 housing units at an average density of 141.3 per square mile (54.6/km2).[9] The racial makeup of the county was 89.8% white, 3.4% Asian, 3.3% black or African American, 0.2% American Indian, 1.6% from other races, and 1.8% from two or more races. Those of Hispanic or Latino origin made up 4.3% of the population.[8] In terms of ancestry, 22.0% were Irish, 16.8% were Italian, 14.3% were English, 14.2% were German, 10.6% were Polish, 5.6% were French Canadian, and 3.5% were American.[10]
Of the 54,477 households, 31.5% had children under the age of 18 living with them, 54.9% were married couples living together, 8.6% had a female householder with no husband present, 32.6% were non-families, and 24.2% of all households were made up of individuals. The average household size was 2.51 and the average family size was 3.00. The median age was 38.3 years.[8]
The median income for a household in the county was $77,175 and the median income for a family was $91,631. Males had a median income of $62,579 versus $46,818 for females. The per capita income for the county was $33,108. About 3.2% of families and 6.4% of the population were below the poverty line, including 5.2% of those under age 18 and 4.6% of those age 65 or over.[11]
Demographic breakdown by town
Income
Data is from the 2010 United States Census and the 2006-2010 American Community Survey 5-Year Estimates.[12][13]
| Rank | Town | Per capita income |
Median household income |
Median family income |
Population | Number of households | |
|---|---|---|---|---|---|---|---|
| 1 | Bolton | Town | $42,312 | $89,432 | $93,472 | 4,980 | 1,915 |
| 2 | Tolland | Town | $41,883 | $99,764 | $108,564 | 15,052 | 5,312 |
| 3 | Hebron | Town | $39,416 | $108,444 | $112,894 | 9,686 | 3,398 |
| 4 | Andover | Town | $38,710 | $84,274 | $96,286 | 3,303 | 1,244 |
| 5 | Ellington | Town | $37,322 | $81,582 | $95,547 | 15,602 | 6,257 |
| 6 | Columbia | Town | $36,865 | $85,893 | $102,353 | 5,485 | 2,154 |
| 7 | Somers | Town | $35,134 | $98,977 | $108,636 | 11,444 | 3,328 |
| 8 | Coventry | Town | $34,524 | $86,244 | $91,931 | 12,435 | 4,783 |
| 9 | Vernon | Town | $33,160 | $61,103 | $77,649 | 29,179 | 12,976 |
| 10 | Union | Town | $32,032 | $79,911 | $84,750 | 854 | 334 |
| 11 | Willington | Town | $29,616 | $62,500 | $96,422 | 6,041 | 2,423 |
| 12 | Stafford | Town | $28,027 | $64,494 | $69,789 | 12,087 | 4,767 |
| 13 | Mansfield | Town | $21,579 | $65,839 | $84,128 | 26,543 | 5,586 |
Race
Data is from the 2007-2011 American Community Survey 5-Year Estimates, ACS Demographic and Housing Estimates, "Race alone or in combination with one or more other races."[14]
| Rank | Town | Population | White | Black | Asian | American Indian |
Other | Hispanic | |
|---|---|---|---|---|---|---|---|---|---|
| 1 | Vernon | Town | 29,199 | 88.5% | 8.8% | 4.0% | 0.8% | 1.8% | 7.1% |
| 2 | Mansfield | Town | 26,130 | 84.4% | 6.2% | 10.7% | 0.3% | 1.8% | 6.3% |
| 3 | Ellington | Town | 15,394 | 96.0% | 1.6% | 2.7% | 0.3% | 0.2% | 1.1% |
| 4 | Tolland | Town | 14,931 | 97.2% | 1.9% | 2.4% | 1.5% | 0.4% | 3.1% |
| 5 | Coventry | Town | 12,402 | 97.1% | 1.6% | 1.7% | 0.6% | 0.3% | 2.1% |
| 6 | Stafford | Town | 12,055 | 97.4% | 1.2% | 1.6% | 0.6% | 0.9% | 3.3% |
| 7 | Somers | Town | 11,385 | 85.3% | 10.0% | 2.8% | 0.6% | 4.0% | 5.8% |
| 8 | Hebron | Town | 9,620 | 99.0% | 0.0% | 1.6% | 0.9% | 0.5% | 2.4% |
| 9 | Willington | Town | 6,070 | 98.9% | 3.7% | 0.2% | 0.7% | 0.2% | 2.4% |
| 10 | Columbia | Town | 5,449 | 97.8% | 1.9% | 1.7% | 1.9% | 0.4% | 2.1% |
| 11 | Bolton | Town | 5,006 | 98.0% | 2.9% | 0.0% | 0.9% | 0.8% | 4.5% |
| 12 | Andover | Town | 3,143 | 96.5% | 3.0% | 1.7% | 1.3% | 0.0% | 0.0% |
| 13 | Union | Town | 990 | 99.4% | 0.0% | 0.7% | 1.6% | 0.0% | 1.3% |
Communities
Towns
Other communities
- Amston
- Coventry Lake
- Crystal Lake
- Gilead
- Hebron Center
- Hydeville
- Mashapaug
- Mansfield Center
- Rockville
- Somers center
- South Coventry
- Stafford Hollow
- Stafford Springs
- Storrs
Politics
| Year | Republican | Democratic | Third party | |||
|---|---|---|---|---|---|---|
| No. | % | No. | % | No. | % | |
| 2020 | 34,819 | 43.23% | 44,006 | 54.63% | 1,721 | 2.14% |
| 2016 | 34,194 | 44.16% | 38,506 | 49.73% | 4,724 | 6.10% |
| 2012 | 30,450 | 42.89% | 39,366 | 55.45% | 1,175 | 1.66% |
| 2008 | 29,266 | 38.76% | 45,053 | 59.67% | 1,182 | 1.57% |
| 2004 | 31,245 | 43.56% | 39,146 | 54.57% | 1,338 | 1.87% |
| 2000 | 24,705 | 39.40% | 33,554 | 53.52% | 4,441 | 7.08% |
| 1996 | 19,394 | 33.08% | 30,007 | 51.18% | 9,224 | 15.73% |
| 1992 | 20,632 | 31.16% | 27,425 | 41.42% | 18,158 | 27.42% |
| 1988 | 28,375 | 50.80% | 26,884 | 48.13% | 602 | 1.08% |
| 1984 | 32,981 | 61.88% | 20,103 | 37.72% | 214 | 0.40% |
| 1980 | 22,127 | 43.95% | 18,557 | 36.86% | 9,662 | 19.19% |
| 1976 | 23,703 | 50.41% | 23,079 | 49.08% | 242 | 0.51% |
| 1972 | 25,798 | 56.45% | 19,505 | 42.68% | 394 | 0.86% |
| 1968 | 16,666 | 45.47% | 18,007 | 49.13% | 1,982 | 5.41% |
| 1964 | 9,951 | 30.90% | 22,195 | 68.92% | 58 | 0.18% |
| 1960 | 15,386 | 51.35% | 14,575 | 48.65% | 0 | 0.00% |
| 1956 | 15,880 | 63.54% | 9,111 | 36.46% | 0 | 0.00% |
| 1952 | 13,466 | 58.69% | 9,425 | 41.08% | 52 | 0.23% |
| 1948 | 9,012 | 52.01% | 7,970 | 45.99% | 347 | 2.00% |
| 1944 | 8,208 | 51.15% | 7,721 | 48.12% | 117 | 0.73% |
| 1940 | 7,503 | 49.37% | 7,669 | 50.46% | 25 | 0.16% |
| 1936 | 5,965 | 45.43% | 6,676 | 50.85% | 488 | 3.72% |
| 1932 | 5,857 | 51.85% | 4,985 | 44.13% | 455 | 4.03% |
| 1928 | 6,502 | 59.74% | 4,256 | 39.10% | 126 | 1.16% |
| 1924 | 5,161 | 62.29% | 2,239 | 27.02% | 885 | 10.68% |
| 1920 | 5,135 | 66.13% | 2,308 | 29.72% | 322 | 4.15% |
| 1916 | 2,758 | 54.72% | 2,032 | 40.32% | 250 | 4.96% |
| 1912 | 2,024 | 42.66% | 1,901 | 40.06% | 820 | 17.28% |
| 1908 | 2,816 | 57.35% | 1,742 | 35.48% | 352 | 7.17% |
| 1904 | 2,964 | 58.66% | 1,772 | 35.07% | 317 | 6.27% |
| 1900 | 2,997 | 61.48% | 1,678 | 34.42% | 200 | 4.10% |
| 1896 | 5,664 | 67.67% | 2,245 | 26.82% | 461 | 5.51% |
| 1892 | 4,316 | 51.06% | 3,762 | 44.51% | 374 | 4.42% |
| 1888 | 4,363 | 52.88% | 3,613 | 43.79% | 275 | 3.33% |
| 1884 | 3,896 | 50.57% | 3,459 | 44.90% | 349 | 4.53% |
In popular culture
Tolland County is briefly referenced in the novel Moby-Dick by Herman Melville as the place that the ill-fated African-American shipmate, Pip, comes from.
See also
- National Register of Historic Places listings in Tolland County, Connecticut
- New England Civil War Museum
References
- "Census - Geography Profile: Tolland County, Connecticut". United States Census Bureau. Retrieved November 20, 2021.
- "US Gazetteer files: 2010, 2000, and 1990". United States Census Bureau. February 12, 2011. Retrieved April 23, 2011.
- "U.S. Decennial Census". United States Census Bureau. Retrieved June 11, 2014.
- "Historical Census Browser". University of Virginia Library. Retrieved June 11, 2014.
- "Population of Counties by Decennial Census: 1900 to 1990". United States Census Bureau. Retrieved June 11, 2014.
- "Census 2000 PHC-T-4. Ranking Tables for Counties: 1990 and 2000" (PDF). United States Census Bureau. Archived (PDF) from the original on October 9, 2022. Retrieved June 11, 2014.
- "State & County QuickFacts". United States Census Bureau. Retrieved June 11, 2014.
- "DP-1 Profile of General Population and Housing Characteristics: 2010 Demographic Profile Data". United States Census Bureau. Archived from the original on February 13, 2020. Retrieved January 12, 2016.
- "Population, Housing Units, Area, and Density: 2010 - County". United States Census Bureau. Archived from the original on February 13, 2020. Retrieved January 12, 2016.
- "DP02 SELECTED SOCIAL CHARACTERISTICS IN THE UNITED STATES – 2006-2010 American Community Survey 5-Year Estimates". United States Census Bureau. Archived from the original on February 13, 2020. Retrieved January 12, 2016.
- "DP03 SELECTED ECONOMIC CHARACTERISTICS – 2006-2010 American Community Survey 5-Year Estimates". United States Census Bureau. Archived from the original on February 13, 2020. Retrieved January 12, 2016.
- "SELECTED ECONOMIC CHARACTERISTICS 2006-2010 American Community Survey 5-Year Estimates". U.S. Census Bureau. Archived from the original on February 12, 2020. Retrieved November 25, 2012.
- "Profile of General Population and Housing Characteristics: 2010 Demographic Profile Data". U.S. Census Bureau. Archived from the original on May 21, 2019. Retrieved November 25, 2012.
- "ACS DEMOGRAPHIC AND HOUSING ESTIMATES 2007-2011 American Community Survey 5-Year Estimates". U.S. Census Bureau. Archived from the original on February 12, 2020. Retrieved January 8, 2013.
- Leip, David. "Dave Leip's Atlas of U.S. Presidential Elections". uselectionatlas.org. Retrieved May 26, 2017.
External links
- Tolland County 911
- Federal Statistics for Tolland Co. Conn.
- National Register of Historic Places listing for Tolland Co., Connecticut
- State parks and Forests in Tolland County
- Tolland County Chamber of Commerce
Places adjacent to Tolland County, Connecticut | ||||||||||||||||
|---|---|---|---|---|---|---|---|---|---|---|---|---|---|---|---|---|
| ||||||||||||||||
Municipalities and communities of Tolland County, Connecticut, United States | ||
|---|---|---|
County seat: Rockville | ||
| Towns | 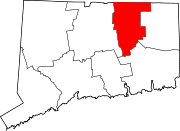 | |
| CDPs | ||
| Other communities |
| |
| ||
State of Connecticut | |
|---|---|
Hartford (capital) | |
| Topics |
|
| Society |
|
| Regions |
|
| Counties | |
| Cities | |
| All Towns |
|
| Places |
|
На других языках
[de] Tolland County
Tolland County[1] ist ein County im Bundesstaat Connecticut der Vereinigten Staaten mit 136.364 Einwohnern. Die größte Stadt des Countys ist Vernon. Der traditionelle Verwaltungssitz (County Seat) ist Tolland, allerdings wurden in Connecticut alle Verwaltungsfunktionen auf die Gemeinden übertragen.- [en] Tolland County, Connecticut
Другой контент может иметь иную лицензию. Перед использованием материалов сайта WikiSort.org внимательно изучите правила лицензирования конкретных элементов наполнения сайта.
WikiSort.org - проект по пересортировке и дополнению контента Википедии