world.wikisort.org - USA
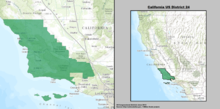
California's 24th congressional district is a congressional district in the U.S. state of California. The district is currently represented by Salud Carbajal. It contains all of Santa Barbara County, most of San Luis Obispo County, and part of Ventura County. Cities in the district include Santa Barbara, Ventura, San Luis Obispo, Santa Maria, and Ojai.[3]
| California's 24th congressional district | |||
|---|---|---|---|
Interactive map of district boundaries since 2023 (Used in the 2022 elections) | |||
| Representative |
| ||
| Population (2021) | 740,591 | ||
| Median household income | $83,173[1] | ||
| Ethnicity |
| ||
| Cook PVI | D+10[2] | ||


Prior to redistricting in 2011, the district covered the inland portions of Ventura and Santa Barbara counties, as well as a sparsely-populated portion of the Ventura County coast. Redistricting in 2021 removed the northern part of San Luis Obispo County and added the cities of Ojai and Ventura.
Results in statewide elections
| Year | Office | Results |
|---|---|---|
| 1992 | President | Clinton 48–30% |
| Senator | Boxer 50–43% | |
| Senator | Feinstein 57–37% | |
| 1994 | Governor | [data unknown/missing] |
| Senator | Feinstein | |
| 1996 | President | Clinton |
| 1998 | Governor | [data unknown/missing] |
| Senator | [data unknown/missing] | |
| 2000 | President[4] | Gore 57–38% |
| Senator[5] | Feinstein 59–35% | |
| 2002 | Governor[6] | Simon 52–39% |
| 2003 | Recall[7][8] | |
| Schwarzenegger 55–20% | ||
| 2004 | President[9] | Bush 56–43% |
| Senator[10] | Jones 48–47% | |
| 2006 | Governor[11] | Schwarzenegger 66–30% |
| Senator[12] | Feinstein 49–46% | |
| 2008 | President[13] | Obama 52–46% |
| 2010 | Governor | Whitman 54–41% |
| Senator | Fiorina 55–40% | |
| 2012 | President[14] | Obama 54–43% |
| Senator | Feinstein 56–44% | |
| 2014 | Governor | Brown 57–43% |
| 2016 | President | Clinton 57–37% |
| Senator | Harris 62–38% | |
| 2018 | Governor | Newsom 57–43% |
| Senator | Feinstein 53–47% | |
| 2020 | President | Biden 61–37% |
| 2021 | Recall[15] |
Composition
| # | County | Seat | Population |
|---|---|---|---|
| 79 | San Luis Obispo | San Luis Obispo | 283,159 |
| 83 | Santa Barbara | Santa Barbara | 446,475 |
As of the 2020 redistricting, California's 24th congressional district is located on the southern edge of the Central Coast. It encompasses Santa Barbara County, most of San Luis Obispo County and part of Ventura County. The district also takes in six of the Channel Islands.
San Luis Obispo County is split between this district and the 19th district. They are partitioned by Highway 1, Cayucos Creek Rd, Thunder Canyon Rd, Old Creek Rd, Santa Rita Rd, Tara Creek, Fuentes Rd, Highway 41, San Miguel Rd, Palo Verde Rd, Old Morro Rd, Los Osos Rd, San Rafael Rd, Atascadero Ave, San Antonio Rd, N Santa Margarita Rd, Santa Clara Rd, Rocky Canyon Truck Trail, Highway 229, Lion Ridge Rd, O’Donovan Rd, Highway 58, Calf Canyon Highway, La Panza Rd, Upton Canyon Rd, Camatta Creek Rd, San Juan Creek, and Bitterwater Rd. The 24th district takes in the cities of San Luis Obispo, Arroyo Grande, Morro Bay, and Grover Beach, as well as the census-designated places Nipomo and Los Osos.
Ventura County is split between this district and the 26th district. They are partitioned by Highway 150, Los Padres National Park, Highway 33, Cozy del, Cozy Ojai Rd, Shelf Road Trail, Gridley Rd, Grand Ave, Thatcher Creek, Boardman Rd, Sulphur Mountain Rd, Cahada Larga Rd, Highway 33, Shell Rd E, Manuel Canyon Rd, Aliso St, Willoughby Rd, Aliso Canyon Rd, Foothill Rd, N Wells Rd, Highway 126, Highway 118, Brown Barranca, Montgomery Ave, Telephone Rd, Ramelin Ave, Harmon Barranca, Johnson Dr, S Victoria Ave, Highway 101, E Harbor Blvd, and Olivias Park Dr. The 24th district takes in the city of Ventura.
Cities & CDP with 10,000 or more people
- Ventura - 110,763
- Santa Maria - 109,707
- Santa Barbara - 88,665
- Lompoc - 44,444
- Orcutt - 35,262
- Goleta - 32,690
- Arroyo Grande - 18,441
- Nipomo - 18,182
- Los Osos - 16,533
- Isla Vista - 15,500
- Grover Beach - 13,459
- Carpinteria - 13,264
- Morro Bay - 10,757
List of members representing the district
| Member | Party | Dates | Cong ress |
Electoral history | Counties |
|---|---|---|---|---|---|
| District created January 3, 1953 | |||||
 Norris Poulson |
Republican | January 3, 1953 – June 11, 1953 |
83rd | Redistricted from the 13th district and re-elected in 1952. Resigned to become Mayor of Los Angeles. |
1953–1963 Los Angeles |
| Vacant | June 11, 1953 – November 10, 1953 | ||||
 Glenard P. Lipscomb |
Republican | November 10, 1953 – February 1, 1970 |
83rd 84th 85th 86th 87th 88th 89th 90th 91st |
Elected to finish Poulson's term. Re-elected in 1954. Re-elected in 1956. Re-elected in 1958. Re-elected in 1960. Re-elected in 1962. Re-elected in 1964. Re-elected in 1966. Re-elected in 1968. Died. | |
| 1967–1973 Los Angeles, southwestern San Bernardino | |||||
| Vacant | February 1, 1970 – June 30, 1970 |
91st | |||
 John H. Rousselot |
Republican | June 30, 1970 – January 3, 1975 |
91st 92nd 93rd |
Elected to finish Lipscomb's term. Re-elected later in 1970. Re-elected in 1972. Redistricted to the 26th district. | |
| 1973–1983 Los Angeles | |||||
 Henry Waxman |
Democratic | January 3, 1975 – January 3, 1993 |
94th 95th 96th 97th 98th 99th 100th 101st 102nd |
Elected in 1974. Re-elected in 1976. Re-elected in 1978. Re-elected in 1980. Re-elected in 1982. Re-elected in 1984. Re-elected in 1986. Re-elected in 1988. Re-elected in 1990. Redistricted to the 29th district. | |
| 1983–1993 North central Los Angeles (Hollywood) | |||||
 Anthony C. Beilenson |
Democratic | January 3, 1993 – January 3, 1997 |
103rd 104th |
Redistricted from the 23rd district and re-elected in 1992. Re-elected in 1994. Retired. |
1993–2003 Southwestern Los Angeles, southeastern Ventura (Thousand Oaks) |
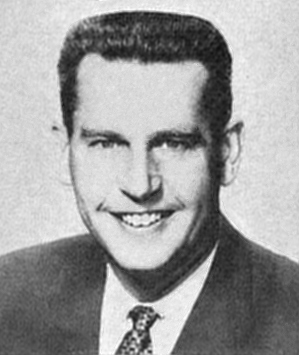
 Brad Sherman |
Democratic | January 3, 1997 – January 3, 2003 |
105th 106th 107th |
Elected in 1996. Re-elected in 1998. Re-elected in 2000. Redistricted to the 27th district. | |
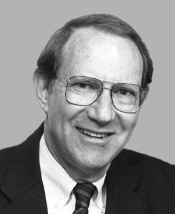
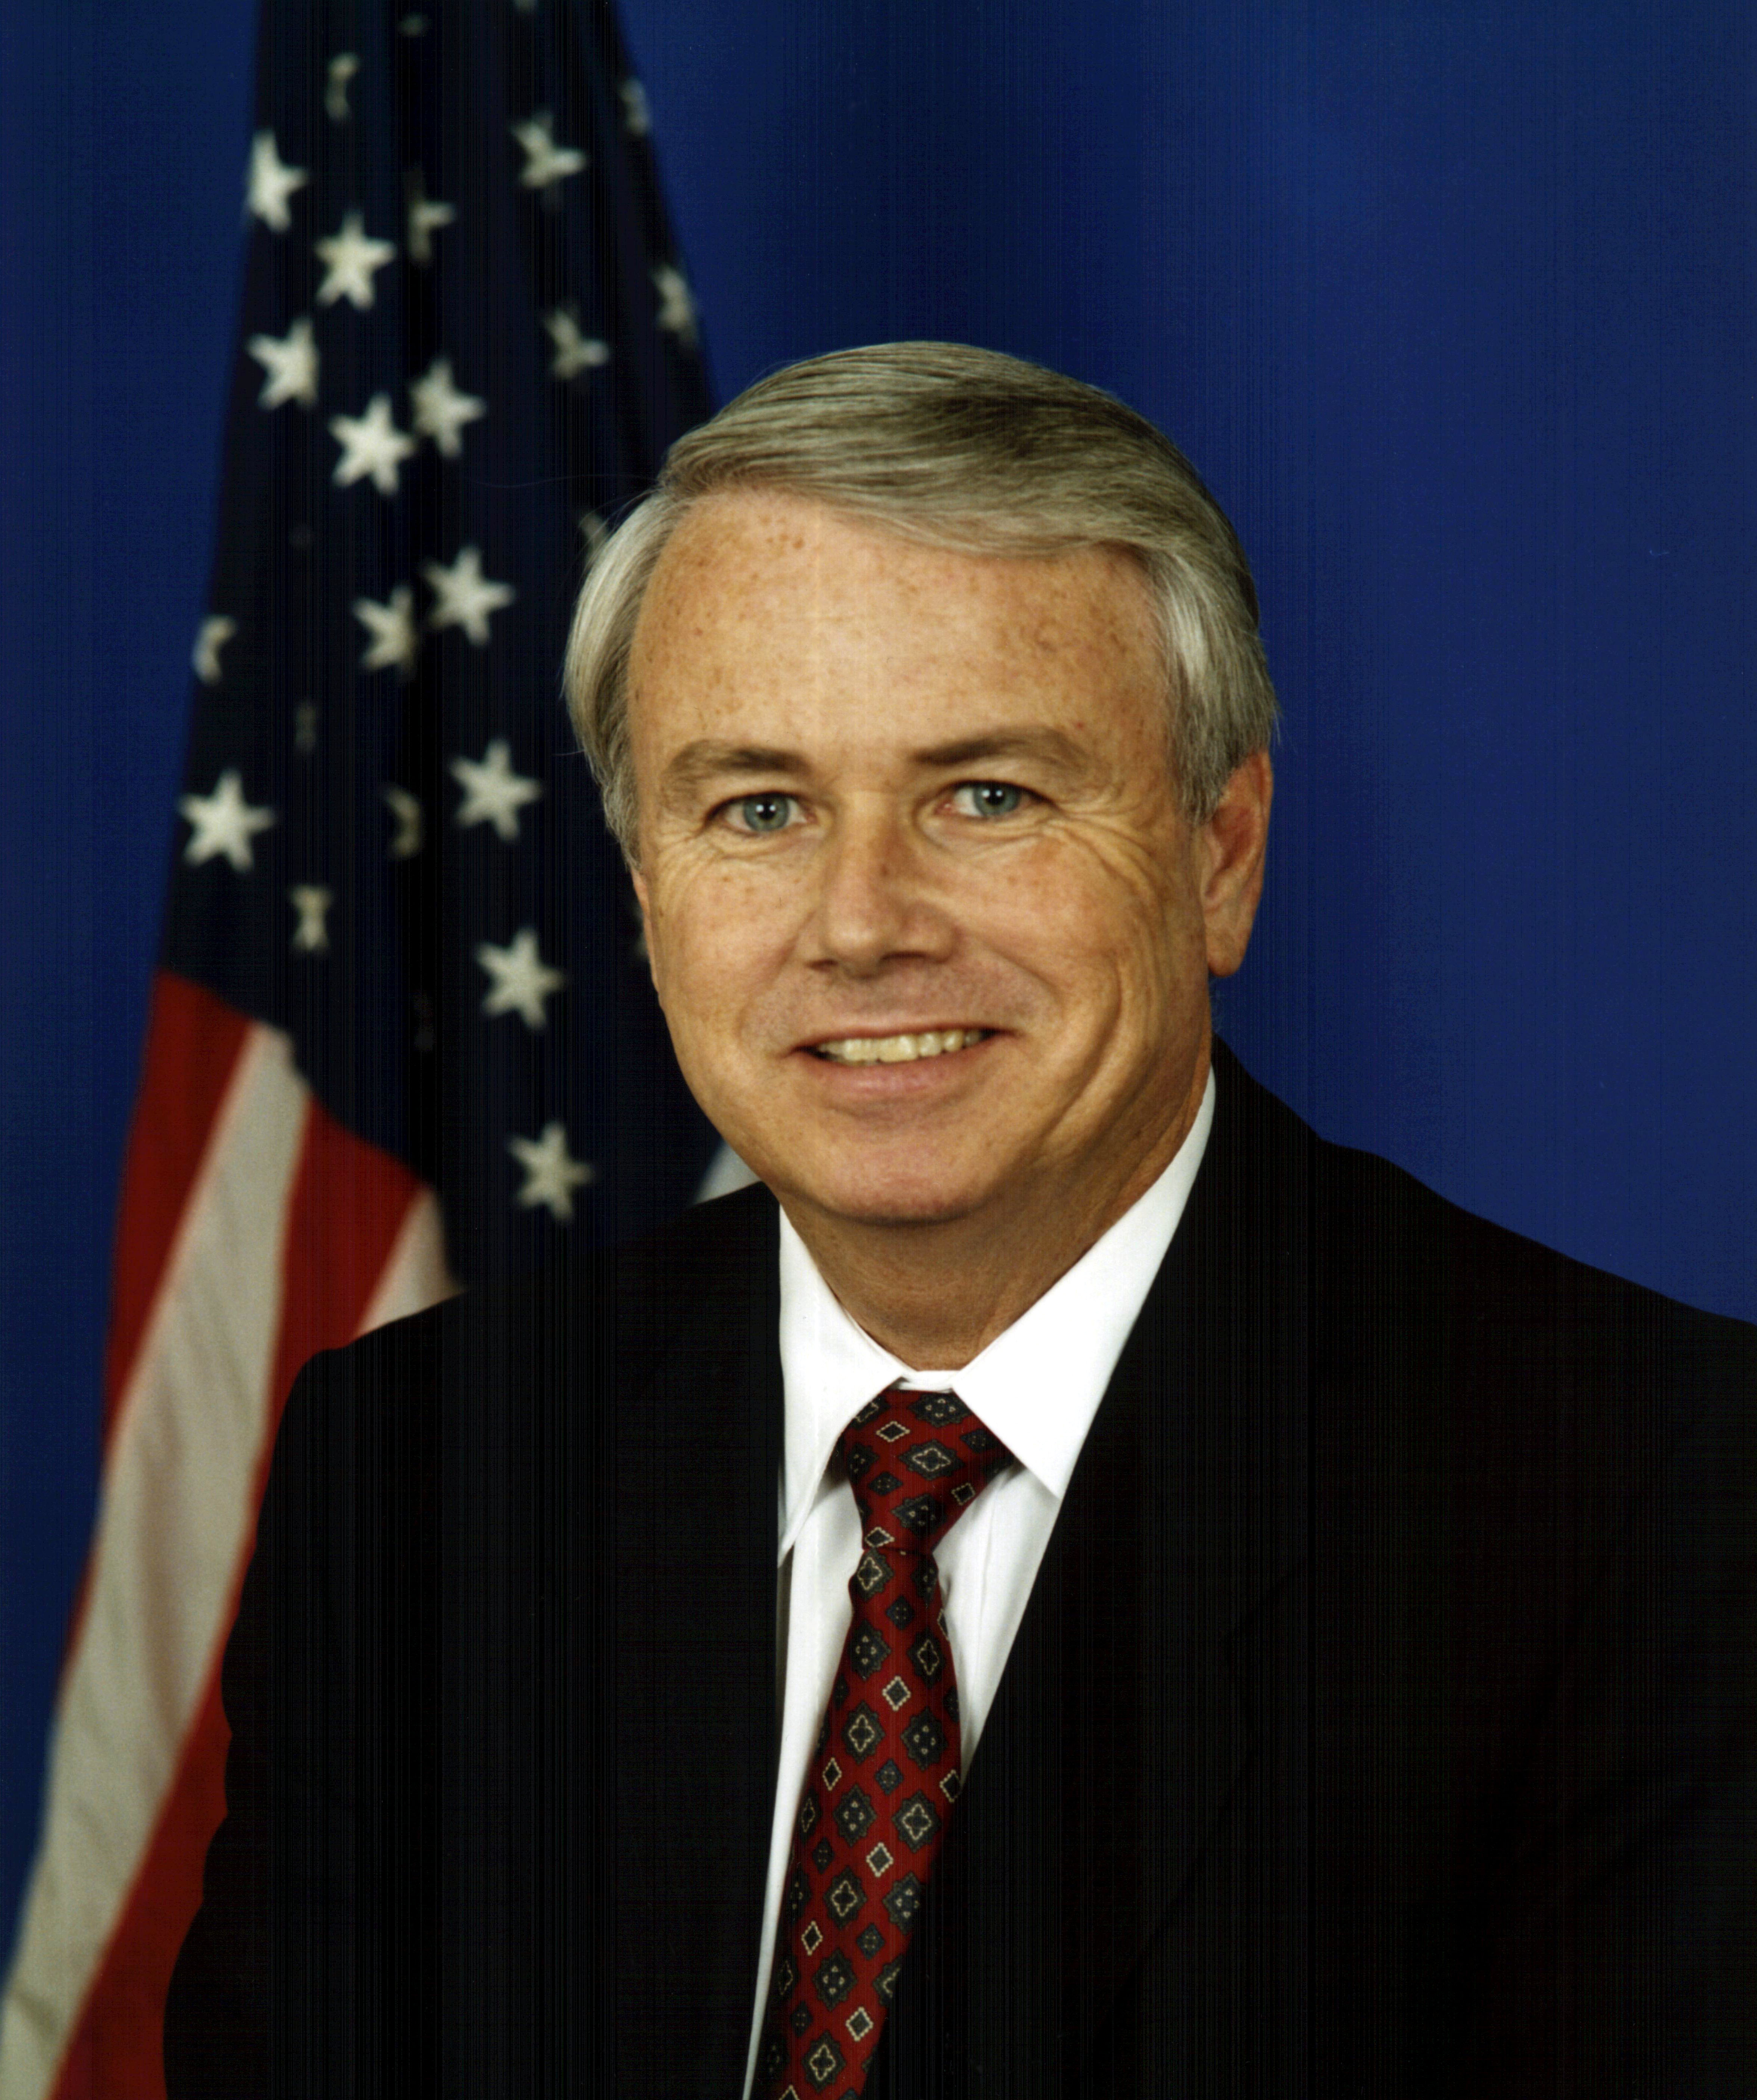 Elton Gallegly |
Republican | January 3, 2003 – January 3, 2013 |
108th 109th 110th 111th 112th |
Redistricted from the 23rd district and re-elected in 2002. Re-elected in 2004. Re-elected in 2006. Re-elected in 2008. Re-elected in 2010. Retired. |
2003–2013 Inland Santa Barbara, most of Ventura |
 Lois Capps |
Democratic | January 3, 2013 – January 3, 2017 |
113th 114th |
Redistricted from the 23rd district and re-elected in 2012. Re-elected in 2014. Retired. |
2013–present Central Coast including San Luis Obispo and Santa Barbara |
 Salud Carbajal |
Democratic | January 3, 2017 – Present |
115th 116th 117th |
Elected in 2016. Re-elected in 2018. Re-elected in 2020. Re-elected in 2022. | |
Election results
|
1952 • 1953 (Special) • 1954 • 1956 • 1958 • 1960 • 1962 • 1964 • 1966 • 1968 • 1970 (Special) • 1970 • 1972 • 1974 • 1976 • 1978 • 1980 • 1982 • 1984 • 1986 • 1988 • 1990 • 1992 • 1994 • 1996 • 1998 • 2000 • 2002 • 2004 • 2006 • 2008 • 2010 • 2012 • 2014 • 2016 • 2018 • 2020 |
1952
| Party | Candidate | Votes | % | |
|---|---|---|---|---|
| Republican | Norris Poulson (incumbent) | 119,799 | 87.4 | |
| Progressive | Bertram L. Sharp | 17,307 | 12.6 | |
| Total votes | 137,106 | 100.0 | ||
| Turnout | ||||
| Republican hold | ||||
1953 (Special)
Republican Glenard P. Lipscomb won the special election to replace fellow Republican Norris Poulson, who was elected Mayor of Los Angeles. Data for this special election is not available.[17]
1954
| Party | Candidate | Votes | % | |
|---|---|---|---|---|
| Republican | Glenard P. Lipscomb (inc.) | 65,431 | 56.9 | |
| Democratic | George Arnold | 49,592 | 43.1 | |
| Total votes | 115,023 | 100.0 | ||
| Turnout | ||||
| Republican hold | ||||
1956
| Party | Candidate | Votes | % | |
|---|---|---|---|---|
| Republican | Glenard P. Lipscomb (inc.) | 84,120 | 61.9 | |
| Democratic | Fay Porter | 51,692 | 38.1 | |
| Total votes | 135,812 | 100.0 | ||
| Turnout | ||||
| Republican hold | ||||
1958
| Party | Candidate | Votes | % | |
|---|---|---|---|---|
| Republican | Glenard P. Lipscomb (inc.) | 68,184 | 56.4 | |
| Democratic | William H. Ware, Jr. | 52,804 | 43.6 | |
| Total votes | 120,988 | 100.0 | ||
| Turnout | ||||
| Republican hold | ||||
1960
| Party | Candidate | Votes | % | |
|---|---|---|---|---|
| Republican | Glenard P. Lipscomb (inc.) | 82,497 | 59.7 | |
| Democratic | Norman Hass | 55,613 | 40.3 | |
| Total votes | 138,110 | 100.0 | ||
| Turnout | ||||
| Republican hold | ||||
1962
| Party | Candidate | Votes | % | |
|---|---|---|---|---|
| Republican | Glenard P. Lipscomb (inc.) | 120,884 | 70.3 | |
| Democratic | Knox Mellon | 50,970 | 29.7 | |
| Total votes | 171,854 | 100.0 | ||
| Turnout | ||||
| Republican hold | ||||
1964
| Party | Candidate | Votes | % | |
|---|---|---|---|---|
| Republican | Glenard P. Lipscomb (inc.) | 139,784 | 67.9 | |
| Democratic | Bryan W. Stevens | 65,967 | 32.1 | |
| Total votes | 205,751 | 100.0 | ||
| Turnout | ||||
| Republican hold | ||||
1966
| Party | Candidate | Votes | % | |
|---|---|---|---|---|
| Republican | Glenard P. Lipscomb (inc.) | 148,190 | 76.3 | |
| Democratic | Earl G. McNall | 46,115 | 23.7 | |
| Total votes | 194,305 | 100.0 | ||
| Turnout | ||||
| Republican hold | ||||
1968
| Party | Candidate | Votes | % | |
|---|---|---|---|---|
| Republican | Glenard P. Lipscomb (inc.) | 152,180 | 72.8 | |
| Democratic | Fred Warner Neal | 56,723 | 27.2 | |
| Total votes | 208,903 | |||
| Republican hold | ||||
1970 (Special)
| Party | Candidate | Votes | % | |
|---|---|---|---|---|
| Republican | John H. Rousselot | 62,749 | 68.2 | |
| Democratic | Myrlie B. Evers | 29,248 | 31.8 | |
| Total votes | 91,997 | 100.0 | ||
| Turnout | ||||
| Republican hold | ||||
1970
| Party | Candidate | Votes | % | |
|---|---|---|---|---|
| Republican | John H. Rousselot (inc.) | 124,071 | 65.1 | |
| Democratic | Myrlie B. Evers | 61,777 | 32.4 | |
| American Independent | Brian Scanlon | 3,018 | 1.6 | |
| Peace and Freedom | Harold Kaplan | 1,858 | 1.0 | |
| Total votes | 190,724 | 100.0 | ||
| Turnout | ||||
| Republican hold | ||||
1972
| Party | Candidate | Votes | % | |
|---|---|---|---|---|
| Republican | John H. Rousselot (inc.) | 141,274 | 70.1 | |
| Democratic | Luther Mandell | 60,170 | 29.9 | |
| Total votes | 201,444 | |||
| Republican hold | ||||
1974
| Party | Candidate | Votes | % | |
|---|---|---|---|---|
| Democratic | Henry Waxman | 85,343 | 64.0 | |
| Republican | Elliott Stone Graham | 43,680 | 33.0 | |
| American Independent | David E. Davis | 3,980 | 3.0 | |
| Total votes | 133,003 | 100.0 | ||
| Turnout | ||||
| Democratic hold | ||||
1976
| Party | Candidate | Votes | % | |
|---|---|---|---|---|
| Democratic | Henry Waxman (incumbent) | 108,296 | 67.8 | |
| Republican | David Irvins Simmons | 51,478 | 32.2 | |
| Total votes | 159,774 | 100.0 | ||
| Turnout | ||||
| Democratic hold | ||||
1978
| Party | Candidate | Votes | % | |
|---|---|---|---|---|
| Democratic | Henry Waxman (incumbent) | 85,075 | 62.7 | |
| Republican | Howard G. Schaefer | 44,243 | 32.6 | |
| Peace and Freedom | Kevin Casey Peters | 6,453 | 4.8 | |
| Total votes | 135,771 | 100.0 | ||
| Turnout | ||||
| Democratic hold | ||||
1980
| Party | Candidate | Votes | % | |
|---|---|---|---|---|
| Democratic | Henry Waxman (incumbent) | 93,569 | 63.8 | |
| Republican | Roland Cayard | 39,744 | 27.1 | |
| Peace and Freedom | Margaret "Maggie" Feigin | 5,905 | 4.0 | |
| Libertarian | Robert E. Lehman | 5,172 | 3.5 | |
| American Independent | Jack Smilowitz | 2,341 | 1.6 | |
| Total votes | 146,731 | 100.0 | ||
| Turnout | ||||
| Democratic hold | ||||
1982
| Party | Candidate | Votes | % | |
|---|---|---|---|---|
| Democratic | Henry Waxman (incumbent) | 88,516 | 65.1 | |
| Republican | Jerry Zerg | 42,133 | 31.0 | |
| Libertarian | Jeff Mandel | 5,420 | 1.8 | |
| Total votes | 136,069 | 100.0 | ||
| Turnout | ||||
| Democratic hold | ||||
1984
| Party | Candidate | Votes | % | |
|---|---|---|---|---|
| Democratic | Henry Waxman (incumbent) | 97,340 | 63.4 | |
| Republican | Jerry Zerg | 51,010 | 33.2 | |
| Peace and Freedom | James Green | 2,780 | 1.8 | |
| Libertarian | Tim Custer | 2,477 | 1.6 | |
| Total votes | 153,607 | 100.0 | ||
| Turnout | ||||
| Democratic hold | ||||
1986
| Party | Candidate | Votes | % | |
|---|---|---|---|---|
| Democratic | Henry Waxman (incumbent) | 103,914 | 87.9 | |
| Libertarian | George Abrahams | 8,871 | 7.5 | |
| Peace and Freedom | James Green | 5,388 | 4.6 | |
| Total votes | 118,173 | 100.0 | ||
| Turnout | ||||
| Democratic hold | ||||
1988
| Party | Candidate | Votes | % | |
|---|---|---|---|---|
| Democratic | Henry Waxman (incumbent) | 112,038 | 72.2 | |
| Republican | John N. Cowles | 36,835 | 23.8 | |
| Peace and Freedom | James Green | 3,571 | 2.3 | |
| Libertarian | George Abrahams | 2,627 | 1.7 | |
| Total votes | 155,071 | 100.0 | ||
| Turnout | ||||
| Democratic hold | ||||
1990
| Party | Candidate | Votes | % | |
|---|---|---|---|---|
| Democratic | Henry Waxman (incumbent) | 71,562 | 68.9 | |
| Republican | John N. Cowles | 26,607 | 25.6 | |
| Peace and Freedom | Maggie Phair | 5,706 | 5.5 | |
| Total votes | 103,875 | 100.0 | ||
| Turnout | ||||
| Democratic hold | ||||
1992
| Party | Candidate | Votes | % | |
|---|---|---|---|---|
| Democratic | Anthony C. Beilenson (inc.) | 141,742 | 55.5 | |
| Republican | Tom McClintock | 99,835 | 39.1 | |
| Peace and Freedom | John Paul Lindblad | 13,690 | 5.4 | |
| Total votes | 255,267 | 100.0 | ||
| Turnout | ||||
| Democratic hold | ||||
1994
| Party | Candidate | Votes | % | |
|---|---|---|---|---|
| Democratic | Anthony C. Beilenson (inc.) | 95,342 | 49.35 | |
| Republican | Rich Sybert | 91,806 | 47.52 | |
| Libertarian | John C. Koehler | 6,031 | 3.12 | |
| Total votes | 193,179 | 100.0 | ||
| Turnout | ||||
| Democratic hold | ||||
1996
| Party | Candidate | Votes | % | |
|---|---|---|---|---|
| Democratic | Brad Sherman | 106,193 | 49.5 | |
| Republican | Rich Sybert | 93,629 | 43.6 | |
| Peace and Freedom | Ralph Shroyer | 6,267 | 2.9 | |
| Libertarian | Erich Miller | 5,691 | 2.6 | |
| Natural Law | Ron Lawrence | 3,068 | 1.4 | |
| Total votes | 214,848 | 100.0 | ||
| Turnout | ||||
| Democratic hold | ||||
1998
| Party | Candidate | Votes | % | |
|---|---|---|---|---|
| Democratic | Brad Sherman (incumbent) | 103,491 | 57.31 | |
| Republican | Randy Hoffman | 69,501 | 38.49 | |
| Natural Law | Catherine Carter | 3,033 | 1.68 | |
| Libertarian | Erich D. Miller | 2,695 | 1.49 | |
| Peace and Freedom | Ralph Shroyer | 1,860 | 1.03 | |
| Total votes | 180,580 | 100.0 | ||
| Turnout | ||||
| Democratic hold | ||||
2000
| Party | Candidate | Votes | % | |
|---|---|---|---|---|
| Democratic | Brad Sherman (incumbent) | 155,398 | 66.1 | |
| Republican | Jerry Doyle | 70,169 | 29.8 | |
| Libertarian | Juan Carlos Ros | 6,966 | 2.9 | |
| Natural Law | Michael Cuddehe | 2,911 | 1.2 | |
| Total votes | 235,444 | 100.0 | ||
| Turnout | ||||
| Democratic hold | ||||
2002
| Party | Candidate | Votes | % | |
|---|---|---|---|---|
| Republican | Elton Gallegly (incumbent) | 120,585 | 65.2 | |
| Democratic | Fern Rudin | 58,755 | 31.8 | |
| Libertarian | Gary Harber | 5,666 | 3.0 | |
| Total votes | 185,006 | 100.0 | ||
| Turnout | ||||
| Republican hold | ||||
2004
| Party | Candidate | Votes | % | |
|---|---|---|---|---|
| Republican | Elton Gallegly (incumbent) | 178,660 | 62.9 | |
| Democratic | Brett Wagner | 96,397 | 33.9 | |
| Green | Stuart A. Bechman | 9,321 | 3.2 | |
| Total votes | 284,378 | 100.0 | ||
| Turnout | ||||
| Republican hold | ||||
2006
| Party | Candidate | Votes | % | |
|---|---|---|---|---|
| Republican | Elton Gallegly (incumbent) | 129,812 | 62.1 | |
| Democratic | Jill M. Martinez | 79,461 | 37.9 | |
| No party | Michael Kurt Stettler (write-in) | 16 | 0.0 | |
| No party | Henry Nicolle (write-in) | 3 | 0.0 | |
| Total votes | 209,292 | 100.0 | ||
| Turnout | ||||
| Republican hold | ||||
2008
| Party | Candidate | Votes | % | |
|---|---|---|---|---|
| Republican | Elton Gallegly (incumbent) | 174,492 | 58.20 | |
| Democratic | Marta Ann Jorgensen | 125,560 | 41.80 | |
| Turnout | ||||
| Republican hold | ||||
2010
| Party | Candidate | Votes | % | |
|---|---|---|---|---|
| Republican | Elton Gallegly (incumbent) | 144,055 | 59.94 | |
| Democratic | Timothy J. Allison | 96,279 | 40.06 | |
| Turnout | ||||
| Republican hold | ||||
2012
| Primary election | ||||
|---|---|---|---|---|
| Party | Candidate | Votes | % | |
| Democratic | Lois Capps (incumbent) | 72,356 | 46.4 | |
| Republican | Abel Maldonado | 46,295 | 29.7 | |
| Republican | Chris Mitchum | 33,604 | 21.5 | |
| No party preference | Matt Boutté | 3,832 | 2.5 | |
| Total votes | 156,087 | 100.0 | ||
| General election | ||||
| Democratic | Lois Capps (incumbent) | 156,749 | 55.1 | |
| Republican | Abel Maldonado | 127,746 | 44.9 | |
| Total votes | 284,495 | 100.0 | ||
| Democratic hold | ||||
2014
| Primary election | ||||
|---|---|---|---|---|
| Party | Candidate | Votes | % | |
| Democratic | Lois Capps (incumbent) | 45,482 | 44.5 | |
| Republican | Christopher Mitchum | 15,927 | 15.6 | |
| Republican | Justin Donald Fareed | 15,013 | 14.7 | |
| Republican | Dale Francisco | 12,256 | 12.0 | |
| Republican | Bradley Allen | 6,573 | 6.4 | |
| Democratic | Sandra J. Marshall-Eminger | 3,675 | 3.6 | |
| Democratic | Paul H. Coyne, Jr. | 1,753 | 1.7 | |
| No party preference | Steve Isakson | 947 | 0.9 | |
| Republican | Alexis Stuart | 527 | 0.5 | |
| Total votes | 102,153 | 100.00 | ||
| General election | ||||
| Democratic | Lois Capps (incumbent) | 103,228 | 52% | |
| Republican | Christopher Mitchum | 95,566 | 48% | |
| Total votes | 198,794 | 100% | ||
| Democratic hold | ||||
2016
| Primary election | ||||
|---|---|---|---|---|
| Party | Candidate | Votes | % | |
| Democratic | Salud Carbajal | 66,402 | 31.9 | |
| Republican | Justin Fareed | 42,521 | 20.5 | |
| Republican | Katcho Achadjian | 37,716 | 18.1 | |
| Democratic | Helene Schneider | 31,046 | 14.9 | |
| Democratic | William "Bill" Ostrander | 12,657 | 6.1 | |
| Republican | Matt T. Kokkonen | 11,636 | 5.6 | |
| No party preference | John Uebersax | 2,188 | 1.1 | |
| No party preference | Steve Isakson | 2,172 | 1.0 | |
| Democratic | Benjamin Lucas | 1,568 | 0.8 | |
| Total votes | 207,906 | 100.0 | ||
| General election | ||||
| Democratic | Salud Carbajal | 166,034 | 53.4 | |
| Republican | Justin Fareed | 144,780 | 46.6 | |
| Total votes | 310,814 | 100.0 | ||
| Democratic hold | ||||
2018
| Primary election | ||||
|---|---|---|---|---|
| Party | Candidate | Votes | % | |
| Democratic | Salud Carbajal (incumbent) | 94,558 | 53.6 | |
| Republican | Justin Fareed | 64,177 | 36.4 | |
| Republican | Michael E. Woody | 17,715 | 10.0 | |
| General election | ||||
| Democratic | Salud Carbajal (incumbent) | 166,550 | 58.6 | |
| Republican | Justin Fareed | 117,881 | 41.4 | |
| Total votes | 284,431 | 100.0 | ||
| Democratic hold | ||||
2020
| Party | Candidate | Votes | % | |
|---|---|---|---|---|
| Democratic | Salud Carbajal (incumbent) | 139,973 | 57.8 | |
| Republican | Andy Caldwell | 92,537 | 38.2 | |
| No party preference | Kenneth Young | 9,650 | 4.0 | |
| Total votes | 242,160 | 100.0 | ||
| General election | ||||
| Democratic | Salud Carbajal (incumbent) | 212,564 | 58.7 | |
| Republican | Andy Caldwell | 149,781 | 41.3 | |
| Total votes | 362,345 | 100.0 | ||
| Democratic hold | ||||
See also
- List of United States congressional districts
References
- "My Congressional District".
- "Partisan Voting Index – Districts of the 115th Congress" (PDF). The Cook Political Report. April 7, 2017. Retrieved April 7, 2017.
- "CA 2022 Congressional". Dave's Redistricting. January 4, 2022. Retrieved November 14, 2022.
- Statement of Vote (2000 President) Archived 2011-05-20 at the Wayback Machine
- Statement of Vote (2000 Senator) Archived 2011-05-20 at the Wayback Machine
- Statement of Vote (2002 Governor) Archived 2010-11-11 at the Wayback Machine
- Statement of Vote (2003 Recall Question) Archived 2011-05-20 at the Wayback Machine
- Statement of Vote (2003 Governor) Archived 2011-05-20 at the Wayback Machine
- Statement of Vote (2004 President) Archived 2011-05-20 at the Wayback Machine
- Statement of Vote (2004 Senator) Archived 2011-08-10 at the Wayback Machine
- Statement of Vote (2006 Governor) Archived 2011-08-10 at the Wayback Machine
- Statement of Vote (2006 Senator) Archived 2011-08-10 at the Wayback Machine
- (2008 Presidential election) Archived June 12, 2009, at the Wayback Machine
- "Daily Kos Elections' presidential results by congressional district for 2016, 2012, and 2008".
- "Counties by Congressional District for Recall Question" (PDF). sos.ca.gov. September 14, 2021. Retrieved May 2, 2022.
- 1952 election results
- 1953 special election results
- 1954 election results
- 1956 election results
- 1958 election results
- 1960 election results
- 1962 election results
- 1964 election results
- 1966 election results
- 1968 election results
- 1970 special election results
- 1970 election results
- 1972 election results
- 1974 election results
- 1976 election results
- 1978 election results
- 1980 election results
- 1982 election results
- 1984 election results
- 1986 election results
- 1988 election results
- 1990 election results
- 1992 election results
- 1994 election results
- 1996 election results
- 1998 election results
- 2000 election results
- 2002 general election results Archived February 3, 2009, at the Wayback Machine
- 2004 general election results[permanent dead link]
- 2006 general election results Archived November 27, 2008, at the Wayback Machine
- Statement of Vote November 4, 2008, General Election Archived October 18, 2012, at the Wayback Machine
- STATISTICS OF THE PRESIDENTIAL AND CONGRESSIONAL ELECTION OF NOVEMBER 4, 2008
- Statement of Vote November 2, 2010, General Election[permanent dead link]
- STATISTICS OF THE PRESIDENTIAL AND CONGRESSIONAL ELECTION OF NOVEMBER 2, 2010
- U.S. House of Representatives District 24 - Districtwide Results
- "2016 General Election Results | California Secretary of State". Archived from the original on November 17, 2016. Retrieved November 17, 2016.
External links
- GovTrack.us: California's 24th congressional district
- RAND California Election Returns: District Definitions
- California Voter Foundation map - CD24
Другой контент может иметь иную лицензию. Перед использованием материалов сайта WikiSort.org внимательно изучите правила лицензирования конкретных элементов наполнения сайта.
WikiSort.org - проект по пересортировке и дополнению контента Википедии