world.wikisort.org - USA
California's 11th congressional district is a congressional district in the U.S. state of California. Currently, the 11th district consists of most of Contra Costa County. Mark DeSaulnier, a Democrat, has represented the district since January 2015.
| California's 11th congressional district | |||
|---|---|---|---|
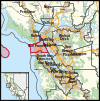
Interactive map of district boundaries since 2023 (Used in the 2022 elections) | |||
| Representative |
| ||
| Population (2021) | 771,855 | ||
| Median household income | $110,251[1] | ||
| Ethnicity |
| ||
| Cook PVI | D+24[2] | ||

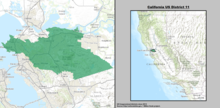
Cities and CDPs in the district include Alamo, Bay Point, Blackhawk, Clayton, Concord, Diablo, El Cerrito, El Sobrante, Kensington, Lafayette, Moraga, Orinda, Pinole, Pittsburg, Pleasant Hill, San Pablo, Richmond, and Walnut Creek; most of Danville; and parts of Antioch and Martinez.[3]
Following redistricting in 2021 by the California Citizens Redistricting Commission, the 11th district is entirely in San Francisco, and includes most of the city with the exception of the Excelsior District, Visitacion Valley, Portola, and Ocean View on the city's southern edge.[4] Speaker of the House Nancy Pelosi will represent the new 11th district.
Recent election results from statewide races
| Year | Office | Results |
|---|---|---|
| 1992 | President | Clinton 40.6–38.5% |
| Senator | Herschensohn 47.3–42.3% | |
| Senator | Feinstein 48.7–47.6% | |
| 1994 | Governor | [data unknown/missing] |
| Senator | [data unknown/missing] | |
| 1996 | President | [data unknown/missing] |
| 1998 | Governor[5] | Davis 52.0–45.7% |
| Senator[6] | Fong 49.1–47.1% | |
| 2000 | President[7] | Bush 49.7–46.6% |
| Senator[8] | Feinstein 51.8–42.2% | |
| 2002 | Governor[9] | Simon 50.5–40.9% |
| 2003 | Recall[10][11] | |
| Schwarzenegger 51.5–24.1% | ||
| 2004 | President[12] | Bush 53.9–45.3% |
| Senator[13] | Boxer 50.2–46.6% | |
| 2006 | Governor[14] | Schwarzenegger 65.3–31.1% |
| Senator[15] | Feinstein 55.4–40.3% | |
| 2008 | President[16] | Obama 53.8–44.5% |
| 2010 | Governor[17] | Whitman 48.9–46.7% |
| Senator[18] | Fiorina 50.7–43.8% | |
| 2012 | President | Obama 67.6–30.0% |
| Senator[19] | Feinstein 71.5–28.5% | |
| 2014 | Governor[20] | Brown 70.4–29.6% |
| 2016 | President | Clinton 71.5–22.7% |
| Senator[21] | Harris 70.6–29.4% | |
| 2018 | Governor[22] | Newsom 70.5–29.5% |
| Senator[23] | Feinstein 59.6–40.4% | |
| 2020 | President | Biden 74.3–23.6% |
| 2021 | Recall[24] |
Composition
| # | County | Seat | Population |
|---|---|---|---|
| 75 | San Francisco | San Francisco | 815,201 |
Due to the 2020 redistricting, California's 11th district has effectively been shifted to the former geography of the 12th district. The district encompasses the city of San Francisco almost entirely, except for the neighborhoods of Crocker Amazon, Excelsior, Little Hollywood, Mission Terrace, Oceanview, Outer Mission, Portola, and Visitacion Valley.
Cities
- San Francisco - 815,201
List of members representing the district
| Member | Party | Dates | Cong ress(es) |
Electoral history | Counties |
|---|---|---|---|---|---|
| District created March 4, 1913 | |||||
 William Kettner |
Democratic | March 4, 1913 – March 3, 1921 |
63rd 64th 65th 66th |
Elected in 1912. Re-elected in 1914. Re-elected in 1916. Re-elected in 1918. Retired. |
Imperial, Inyo, Mono, Orange, Riverside, San Bernardino, San Diego |
 Phil Swing |
Republican | March 4, 1921 – March 3, 1933 |
67th 68th 69th 70th 71st 72nd |
Elected in 1920. Re-elected in 1922. Re-elected in 1924. Re-elected in 1926. Re-elected in 1928. Re-elected in 1930. Retired. | |
| William E. Evans | Republican | March 4, 1933 – January 3, 1935 |
73rd | Redistricted from the 9th district and re-elected in 1932. Lost re-election. |
Los Angeles |
 John S. McGroarty |
Democratic | January 3, 1935 – January 3, 1939 |
74th 75th |
Elected in 1934. Re-elected in 1936. Retired to run for Secretary of State of California. | |
 John Carl Hinshaw |
Republican | January 3, 1939 – January 3, 1943 |
76th 77th |
Elected in 1938. Re-elected in 1940. Redistricted to the 20th district. | |
| George E. Outland | Democratic | January 3, 1943 – January 3, 1947 |
78th 79th |
Elected in 1942. Re-elected in 1944. Lost re-election. |
Monterey, San Luis Obispo, Santa Barbara, Ventura |
 Ernest K. Bramblett |
Republican | January 3, 1947 – January 3, 1953 |
80th 81st 82nd |
Elected in 1946. Re-elected in 1948. Re-elected in 1950. Redistricted to the 13th district. | |
 J. Leroy Johnson |
Republican | January 3, 1953 – January 3, 1957 |
83rd 84th |
Redistricted from the 3rd district and re-elected in 1952. Re-elected in 1954. Lost re-election. |
San Joaquin, Stanislaus |
 John J. McFall |
Democratic | January 3, 1957 – January 3, 1963 |
85th 86th 87th |
Elected in 1956. Re-elected in 1958. Re-elected in 1960. Redistricted to the 15th district. | |
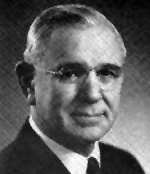 J. Arthur Younger |
Republican | January 3, 1963 – June 20, 1967 |
88th 89th 90th |
Redistricted from the 9th district and re-elected in 1962. Re-elected in 1964. Re-elected in 1966. Died. |
San Mateo |
| Vacant | June 20, 1967 – December 12, 1967 |
90th | |||
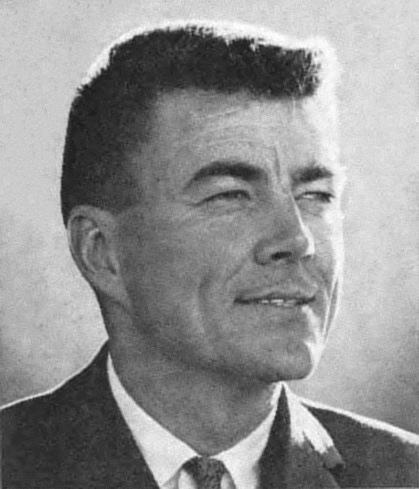 Pete McCloskey |
Republican | December 12, 1967 – January 3, 1973 |
90th 91st 92nd |
Elected to finish Younger's term. Re-elected in 1968. Re-elected in 1970. Redistricted to the 17th district. | |
 Leo Ryan |
Democratic | January 3, 1973 – November 18, 1978 |
93rd 94th 95th |
Elected in 1972. Re-elected in 1974. Re-elected in 1976. Re-elected in 1978 but assassinated. |
1973–1983 Northern San Mateo |
| Vacant | November 18, 1978 – April 3, 1979 |
95th 96th | |||
 William Royer |
Republican | April 3, 1979 – January 3, 1981 |
96th | Elected to finish Ryan's term. Lost re-election. | |
 Tom Lantos |
Democratic | January 3, 1981 – January 3, 1993 |
97th 98th 99th 100th 101st 102nd |
Elected in 1980. Re-elected in 1982. Re-elected in 1984. Re-elected in 1982. Re-elected in 1988. Re-elected in 1990. Redistricted to the 12th district. | |
1983–1993 | |||||
 Richard Pombo |
Republican | January 3, 1993 – January 3, 2007 |
103rd 104th 105th 106th 107th 108th 109th |
Elected in 1992. Re-elected in 1994. Re-elected in 1996. Re-elected in 1998. Re-elected in 2000. Re-elected in 2002. Re-elected in 2004. Lost re-election. |
1993–2003 Most of Sacramento and San Joaquin |
2003–2013 Eastern Alameda, southern and northeastern Contra Costa, most of San Joaquin, southern Santa Clara | |||||
 Jerry McNerney |
Democratic | January 3, 2007 – January 3, 2013 |
110th 111th 112th |
Elected in 2006. Re-elected in 2008. Re-elected in 2010. Redistricted to the 9th district. | |
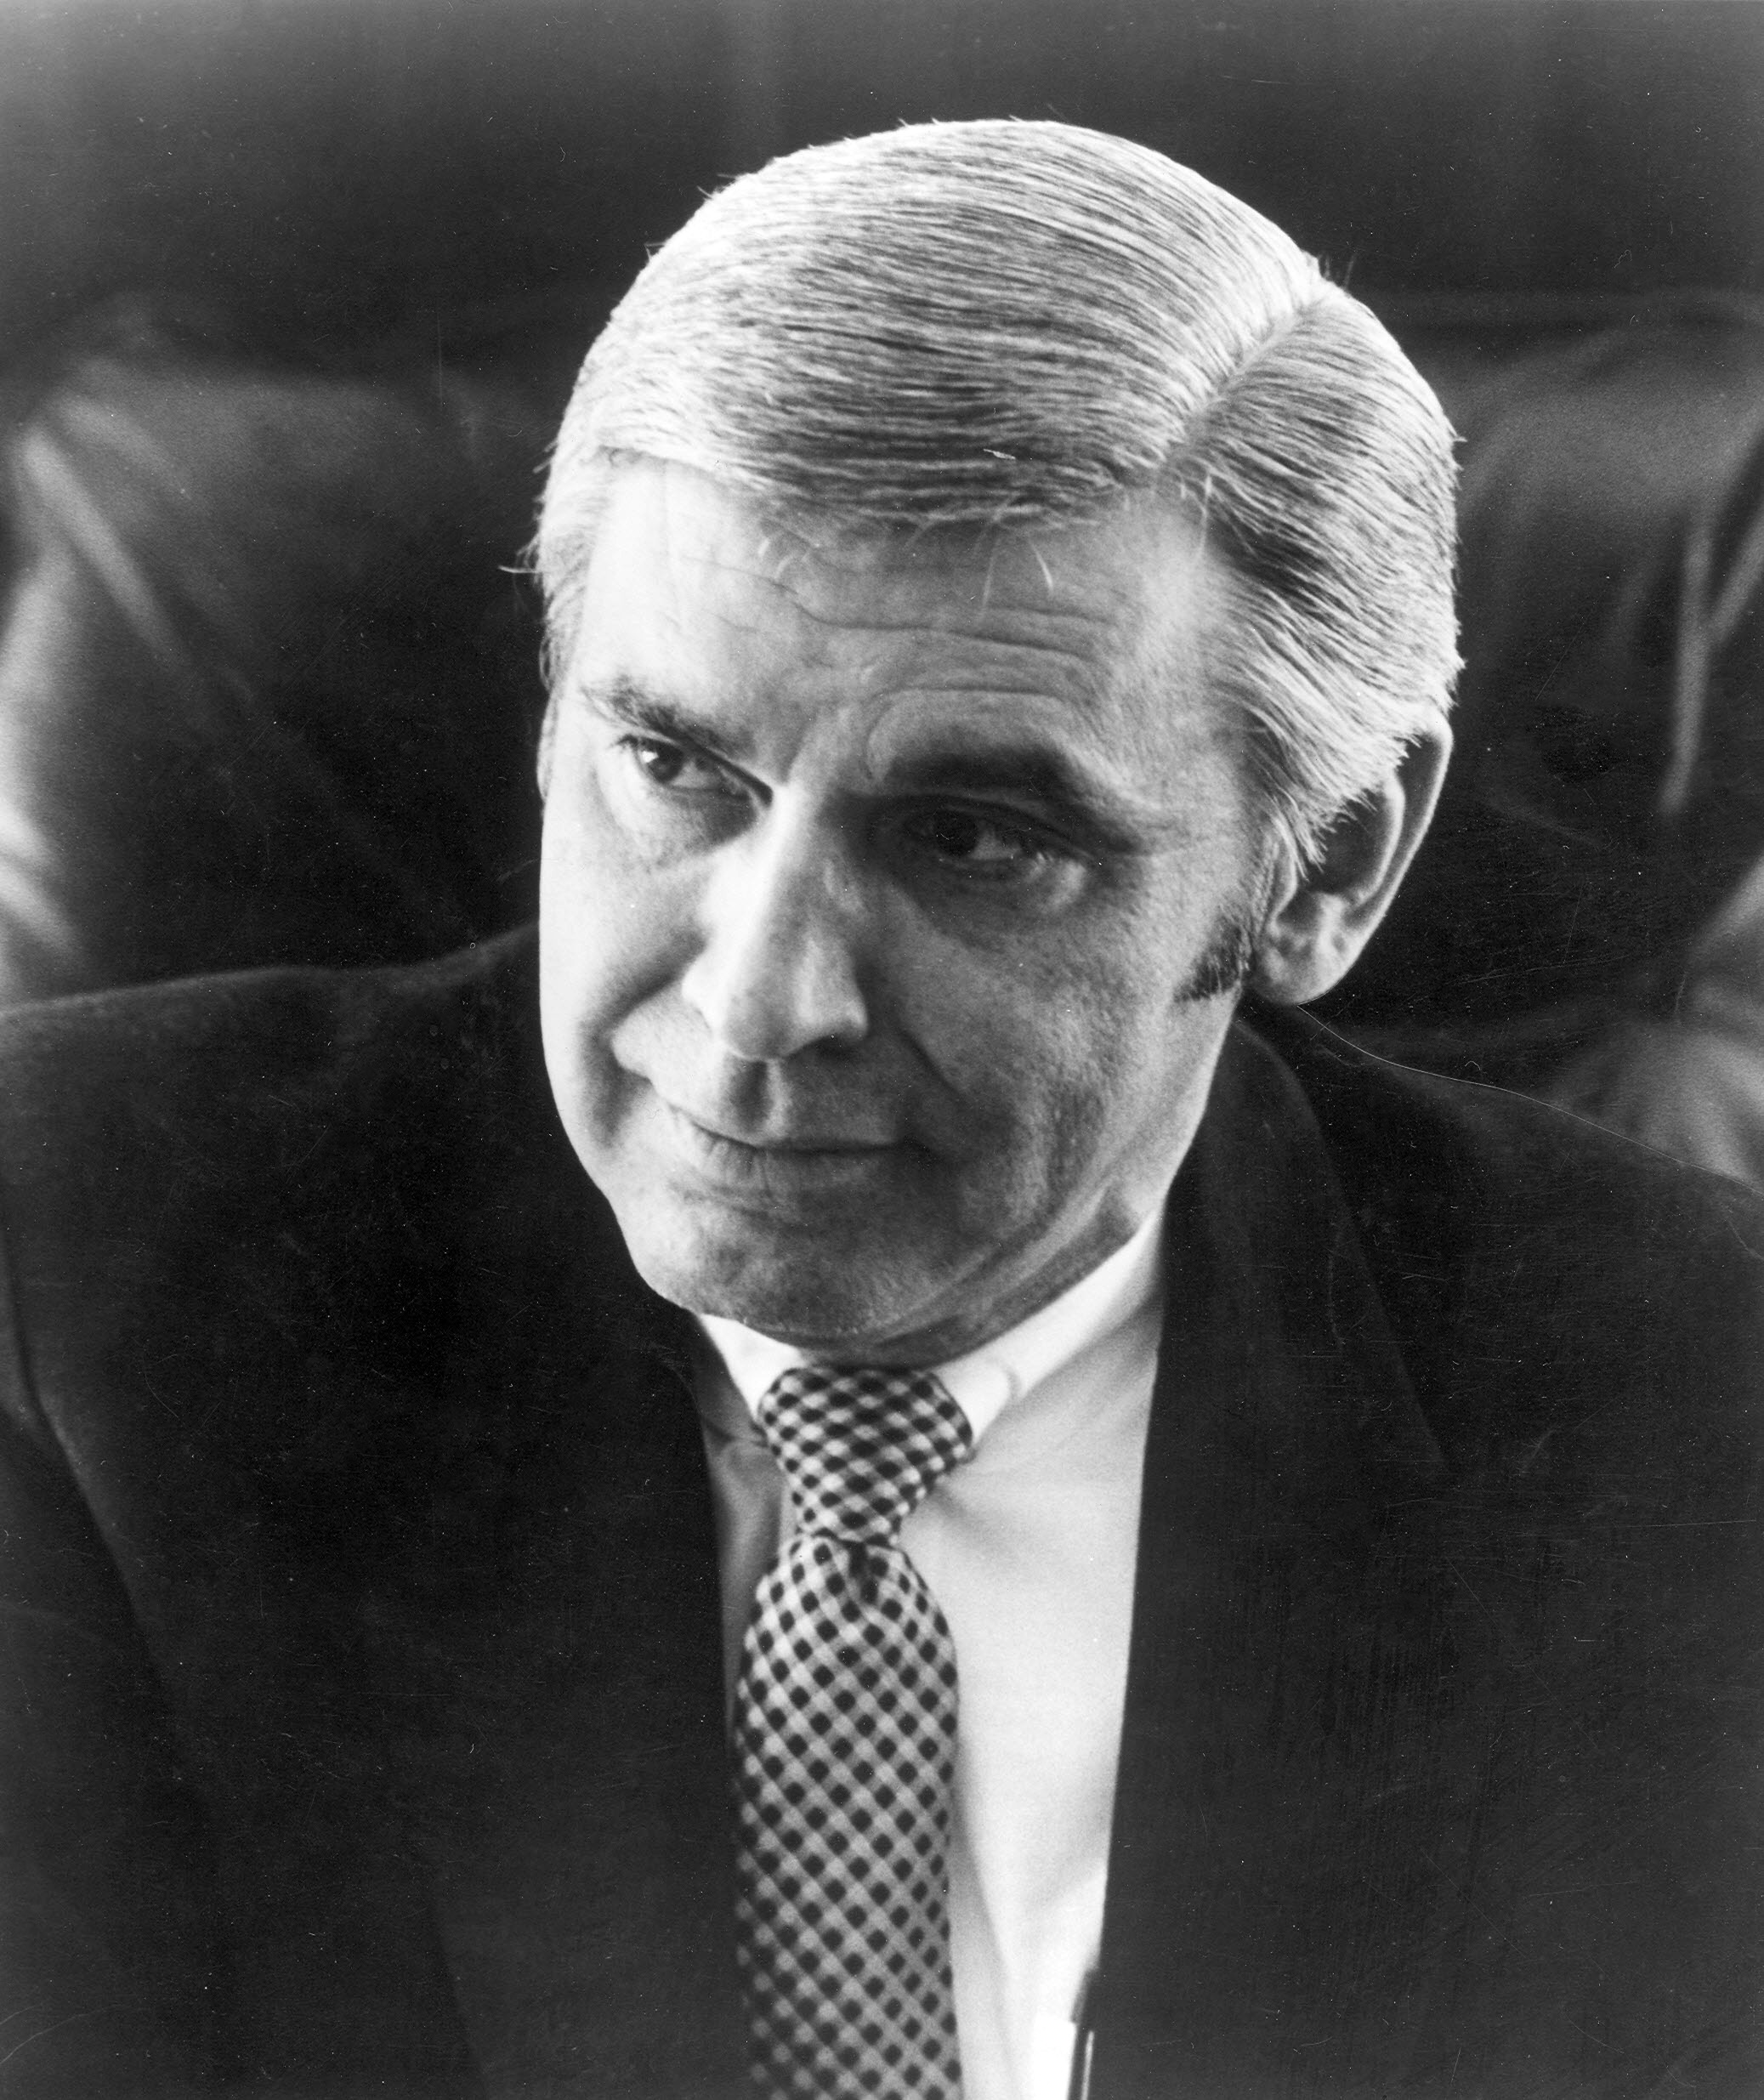
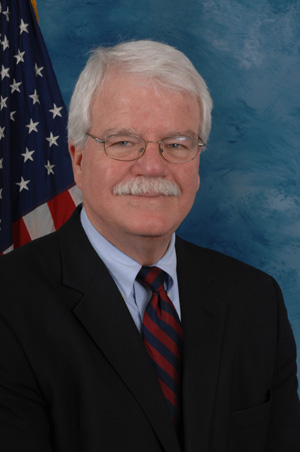 George Miller |
Democratic | January 3, 2013 – January 3, 2015 |
113th | Redistricted from the 7th district and re-elected in 2012. Retired. |
2013–present Most of Contra Costa |
 Mark DeSaulnier |
Democratic | January 3, 2015 – Present |
114th 115th 116th 117th |
Elected in 2014. Re-elected in 2016. Re-elected in 2018. Re-elected in 2020. Redistricted to the 10th district. | |
 Nancy Pelosi |
Democratic | January 3, 2023 – |
Redistricted from the 12th district and re-elected in 2022. | 2023–present: Most of San Francisco | |
Election results
1912
| Party | Candidate | Votes | % | |||
|---|---|---|---|---|---|---|
| Democratic | William Kettner | 24,822 | 42.7 | |||
| Republican | Samuel C. Evans | 21,426 | 36.8 | |||
| Socialist | Noble A. Richardson | 7,059 | 12.1 | |||
| Prohibition | Helen M. Stoddard | 4,842 | 8.3 | |||
| Total votes | 46,248 | 100.0 | ||||
| Turnout | ||||||
| Democratic gain from Republican | ||||||
1914
| Party | Candidate | Votes | % | |
|---|---|---|---|---|
| Democratic | William Kettner (Incumbent) | 47,165 | 52.7 | |
| Republican | James Carson Needham | 25,001 | 27.9 | |
| Prohibition | James S. Edwards | 11,278 | 12.7 | |
| Socialist | Casper Bauer | 6,033 | 6.7 | |
| Total votes | 89,477 | 100.0 | ||
| Turnout | ||||
| Democratic hold | ||||
1916
| Party | Candidate | Votes | % | |
|---|---|---|---|---|
| Democratic | William Kettner (Incumbent) | 42,051 | 44.5 | |
| Republican | Robert C. Harbison | 33,765 | 35.7 | |
| Prohibition | James S. Edwards | 14,759 | 15.6 | |
| Socialist | Marcus W. Robbins | 3,913 | 4.1 | |
| Total votes | 94,488 | 100.0 | ||
| Turnout | ||||
| Democratic hold | ||||
1918
| Party | Candidate | Votes | % | |
|---|---|---|---|---|
| Democratic | William Kettner (Incumbent) | 45,915 | 72.2 | |
| Prohibition | Stella B. Irvine | 17,642 | 27.8 | |
| Total votes | 63,557 | 100.0 | ||
| Turnout | ||||
| Democratic hold | ||||
1920
| Party | Candidate | Votes | % | |||
|---|---|---|---|---|---|---|
| Republican | Phil Swing | 59,425 | 72.9 | |||
| Democratic | Hugh L. Dickson | 22,144 | 27.1 | |||
| Total votes | 81,569 | 100.0 | ||||
| Turnout | ||||||
| Republican gain from Democratic | ||||||
1922
| Party | Candidate | Votes | % | |
|---|---|---|---|---|
| Republican | Phil Swing (Incumbent) | 79,039 | 91.4 | |
| Prohibition | Charles H. Randall | 7,466 | 8.6 | |
| Total votes | 86,505 | 100.0 | ||
| Turnout | ||||
| Republican hold | ||||
1924
| Party | Candidate | Votes | % | |
|---|---|---|---|---|
| Republican | Phil Swing (Incumbent) | 93,811 | 100.0 | |
| Turnout | ||||
| Republican hold | ||||
1926
| Party | Candidate | Votes | % | |
|---|---|---|---|---|
| Republican | Phil Swing (Incumbent) | 89,726 | 100.0 | |
| Turnout | ||||
| Republican hold | ||||
1928
| Party | Candidate | Votes | % | |
|---|---|---|---|---|
| Republican | Phil Swing (Incumbent) | 127,115 | 100.0 | |
| Turnout | ||||
| Republican hold | ||||
1930
| Party | Candidate | Votes | % | |
|---|---|---|---|---|
| Republican | Phil Swing (Incumbent) | 124,092 | 100.0 | |
| Turnout | ||||
| Republican hold | ||||
1932
| Party | Candidate | Votes | % | |
|---|---|---|---|---|
| Republican | William E. Evans (Incumbent) | 57,739 | 51.8 | |
| Democratic | Albert D. Hadley | 38,240 | 34.3 | |
| Liberty | Marshall V. Hartranft | 15,520 | 13.9 | |
| Total votes | 111,499 | 100.0 | ||
| Turnout | ||||
| Republican hold | ||||
1934
| Party | Candidate | Votes | % | |||
|---|---|---|---|---|---|---|
| Democratic | John S. McGroarty | 66,999 | 53.5 | |||
| Republican | William E. Evans (Incumbent) | 56,350 | 45.0 | |||
| Socialist | William E. Stephenson | 1,814 | 1.5 | |||
| Total votes | 125,163 | 100.0 | ||||
| Turnout | ||||||
| Democratic gain from Republican | ||||||
1936
| Party | Candidate | Votes | % | |
|---|---|---|---|---|
| Democratic | John S. McGroarty (Incumbent) | 69,679 | 50.5 | |
| Republican | John Carl Hinshaw | 54,914 | 39.8 | |
| Progressive | Robert S. Funk | 12,340 | 8.9 | |
| Communist | William Ingham | 1,041 | 0.8 | |
| Total votes | 137,974 | 100.0 | ||
| Turnout | ||||
| Democratic hold | ||||
1938
| Party | Candidate | Votes | % | |||
|---|---|---|---|---|---|---|
| Republican | John Carl Hinshaw | 68,712 | 47.0 | |||
| Democratic | Carl Stuart Hamblen | 59,993 | 41.1 | |||
| Townsend | Ralph D. Horton | 12,713 | 8.7 | |||
| Progressive | John R. Grey | 3,821 | 2.6 | |||
| Communist | Orla E. Lair | 817 | 0.6 | |||
| Total votes | 146,056 | 100.0 | ||||
| Turnout | ||||||
| Republican gain from Democratic | ||||||
1940
| Party | Candidate | Votes | % | |
|---|---|---|---|---|
| Republican | John Carl Hinshaw (Incumbent) | 170,504 | 96.6 | |
| Communist | Orla E. Lair | 6,003 | 3.4 | |
| Total votes | 176,507 | 100.0 | ||
| Turnout | ||||
| Republican hold | ||||
1942
| Party | Candidate | Votes | % | ||
|---|---|---|---|---|---|
| Democratic | George E. Outland | 31,611 | 50.7 | ||
| Republican | A. J. Dingeman | 30,781 | 49.3 | ||
| Total votes | 62,392 | 100.0 | |||
| Turnout | |||||
| Democratic win (new seat) | |||||
1944
| Party | Candidate | Votes | % | |
|---|---|---|---|---|
| Democratic | George E. Outland (Incumbent) | 52,218 | 56 | |
| Republican | A. J. Dingeman | 41,005 | 44 | |
| Total votes | 93,223 | 100 | ||
| Turnout | ||||
| Democratic hold | ||||
1946
| Party | Candidate | Votes | % | |||
|---|---|---|---|---|---|---|
| Republican | Ernest K. Bramblett | 41,902 | 53.1 | |||
| Democratic | George E. Outland (Incumbent) | 36,996 | 46.9 | |||
| Total votes | 78,898 | 100.0 | ||||
| Turnout | ||||||
| Republican gain from Democratic | ||||||
1948
| Party | Candidate | Votes | % | |
|---|---|---|---|---|
| Republican | Ernest K. Bramblett (Incumbent) | 87,143 | 80.8 | |
| Progressive | Cole Weston | 14,582 | 13.5 | |
| Democratic | George E. Outland (write-in) | 6,157 | 5.7 | |
| Total votes | 107,882 | 100.0 | ||
| Turnout | ||||
| Republican hold | ||||
1950
| Party | Candidate | Votes | % | |
|---|---|---|---|---|
| Republican | Ernest K. Bramblett (Incumbent) | 59,780 | 52.1 | |
| Democratic | Ardis M. Walker | 55,020 | 47.9 | |
| Total votes | 114,800 | 100.0 | ||
| Turnout | ||||
| Republican hold | ||||
1952
| Party | Candidate | Votes | % | |
|---|---|---|---|---|
| Republican | Justin L. Johnson (Incumbent) | 101,052 | 87.1 | |
| Progressive | Leslie B. Schilingheyde | 14,999 | 12.9 | |
| Total votes | 116,051 | 100.0 | ||
| Turnout | ||||
| Republican hold | ||||
1954
| Party | Candidate | Votes | % | |
|---|---|---|---|---|
| Republican | Justin L. Johnson (Incumbent) | 54,716 | 52.6 | |
| Democratic | Carl Sugar | 49,388 | 47.4 | |
| Total votes | 104,104 | 100.0 | ||
| Turnout | ||||
| Republican hold | ||||
1956
| Party | Candidate | Votes | % | |||
|---|---|---|---|---|---|---|
| Democratic | John J. McFall | 70,630 | 53.1 | |||
| Republican | Justin L. Johnson (Incumbent) | 62,448 | 46.9 | |||
| Total votes | 133,078 | 100.0 | ||||
| Turnout | ||||||
| Democratic gain from Republican | ||||||
1958
| Party | Candidate | Votes | % | |
|---|---|---|---|---|
| Democratic | John J. McFall (Incumbent) | 86,924 | 69.3 | |
| Republican | Frederick S. Van Dyke | 38,427 | 30.7 | |
| Total votes | 125,351 | 100.0 | ||
| Turnout | ||||
| Democratic hold | ||||
1960
| Party | Candidate | Votes | % | |
|---|---|---|---|---|
| Democratic | John J. McFall (Incumbent) | 97,368 | 65.4 | |
| Republican | Clifford B. Bull | 51,473 | 34.6 | |
| Total votes | 148,841 | 100.0 | ||
| Turnout | ||||
| Democratic hold | ||||
1962
| Party | Candidate | Votes | % | |
|---|---|---|---|---|
| Republican | J. Arthur Younger (Incumbent) | 101,963 | 62.3 | |
| Democratic | John D. Kaster | 61,623 | 37.7 | |
| Total votes | 163,586 | 100.0 | ||
| Turnout | ||||
| Republican hold | ||||
1964
| Party | Candidate | Votes | % | |
|---|---|---|---|---|
| Republican | J. Arthur Younger (Incumbent) | 116,022 | 54.8 | |
| Democratic | W. Mark Sullivan | 95,747 | 45.2 | |
| Total votes | 211,769 | 100.0 | ||
| Turnout | ||||
| Republican hold | ||||
1966
| Party | Candidate | Votes | % | |
|---|---|---|---|---|
| Republican | J. Arthur Younger (Incumbent) | 113,679 | 59.4 | |
| Democratic | W. Mark Sullivan | 77,605 | 40.6 | |
| Total votes | 191,284 | 100.0 | ||
| Turnout | ||||
| Republican hold | ||||
1967 (Special)
| Party | Candidate | Votes | % | |
|---|---|---|---|---|
| Republican | Pete McCloskey | 63,850 | 57.2 | |
| Democratic | Roy A. Archibald | 43,759 | 39.2 | |
| Independent | Shirley Temple | 3,938 | 3.5 | |
| Total votes | 111,547 | 100.0 | ||
| Turnout | ||||
| Republican hold | ||||
1968
| Party | Candidate | Votes | % | |
|---|---|---|---|---|
| Republican | Pete McCloskey (Incumbent) | 165,482 | 79.3 | |
| Democratic | Urban G. Whitaker Jr. | 40,979 | 19.6 | |
| Peace and Freedom | David Demorest Ransom | 2,157 | 1.0 | |
| Total votes | 208,618 | 100.0 | ||
| Turnout | ||||
| Republican hold | ||||
1970
| Party | Candidate | Votes | % | |
|---|---|---|---|---|
| Republican | Pete McCloskey (Incumbent) | 144,500 | 77.5 | |
| Democratic | Robert E. Gomperts | 39,188 | 21.0 | |
| Independent | Scattering | 2,786 | 1.5 | |
| Total votes | 186,474 | 100.0 | ||
| Turnout | ||||
| Republican hold | ||||
1972
| Party | Candidate | Votes | % | ||
|---|---|---|---|---|---|
| Democratic | Leo Ryan | 113,580 | 60.4 | ||
| Republican | Charles E. Chase | 69,655 | 37.0 | ||
| American Independent | Nicholas Waeil Kudrovzeff | 4,852 | 2.6 | ||
| Total votes | 188,087 | 100.0 | |||
| Turnout | |||||
| Democratic win (new seat) | |||||
1974
| Party | Candidate | Votes | % | |
|---|---|---|---|---|
| Democratic | Leo Ryan (Incumbent) | 106,075 | 75.8 | |
| Republican | Bob Jones | 29,783 | 21.3 | |
| American Independent | Nicholas Waeil Kudrovzeff | 4,293 | 2.9 | |
| Total votes | 140,151 | 100.0 | ||
| Turnout | ||||
| Democratic hold | ||||
1976
| Party | Candidate | Votes | % | |
|---|---|---|---|---|
| Democratic | Leo Ryan (Incumbent) | 107,618 | 61.1 | |
| Republican | Bob Jones | 62,435 | 35.4 | |
| American Independent | Nicholas Waeil Kudrovzeff | 6,141 | 3.5 | |
| Total votes | 176,194 | 100.0 | ||
| Turnout | ||||
| Democratic hold | ||||
1978
| Party | Candidate | Votes | % | |
|---|---|---|---|---|
| Democratic | Leo Ryan (Incumbent) | 92,882 | 60.5 | |
| Republican | Dave Welch | 54,621 | 35.6 | |
| American Independent | Nicholas Waeil Kudrovzeff | 5,961 | 3.9 | |
| Total votes | 153,464 | 100.0 | ||
| Turnout | ||||
| Democratic hold | ||||
1979 (Special)
| Party | Candidate | Votes | % | |||
|---|---|---|---|---|---|---|
| Republican | William Royer | 52,585 | 57.3 | |||
| Democratic | G.W. "Joe" Holsinger | 37,685 | 41.1 | |||
| American Independent | Nicholas W. Kudrovzeff | 770 | 0.8 | |||
| Peace and Freedom | Wilson G. Branch | 731 | 0.8 | |||
| Total votes | 91,771 | 100.0 | ||||
| Turnout | ||||||
| Republican gain from Democratic | ||||||
1980
| Party | Candidate | Votes | % | |||
|---|---|---|---|---|---|---|
| Democratic | Tom Lantos | 85,823 | 46.4 | |||
| Republican | William Royer (Incumbent) | 80,100 | 43.3 | |||
| Peace and Freedom | Wilson G. Branch | 13,723 | 7.4 | |||
| Libertarian | William S. Wade Jr. | 3,816 | 2.1 | |||
| American Independent | Nicholas W. Kudrovzeff | 1,550 | 0.8 | |||
| Total votes | 185,012 | 100.0 | ||||
| Turnout | ||||||
| Democratic gain from Republican | ||||||
1982
| Party | Candidate | Votes | % | |
|---|---|---|---|---|
| Democratic | Tom Lantos (Incumbent) | 109,812 | 57.1 | |
| Republican | William Royer | 76,462 | 39.7 | |
| Libertarian | Chuck Olson | 2,920 | 1.5 | |
| Peace and Freedom | Wilson G. Branch | 1,928 | 1.0 | |
| American Independent | Nicholas W. Kudrovzeff | 1,250 | 0.6 | |
| Total votes | 192,372 | 100.0 | ||
| Turnout | ||||
| Democratic hold | ||||
1984
| Party | Candidate | Votes | % | |
|---|---|---|---|---|
| Democratic | Tom Lantos (Incumbent) | 147,607 | 69.9 | |
| Republican | John J. "Jack" Hickey | 59,625 | 28.2 | |
| American Independent | Nicholas W. Kudrovzeff | 3,883 | 1.8 | |
| Total votes | 211,115 | 100.0 | ||
| Turnout | ||||
| Democratic hold | ||||
1986
| Party | Candidate | Votes | % | |
|---|---|---|---|---|
| Democratic | Tom Lantos (Incumbent) | 112,380 | 74.1 | |
| Republican | Bill Quarishi | 39,315 | 25.9 | |
| Total votes | 151,695 | 100.0 | ||
| Turnout | ||||
| Democratic hold | ||||
1988
| Party | Candidate | Votes | % | |
|---|---|---|---|---|
| Democratic | Tom Lantos (Incumbent) | 145,484 | 71.0 | |
| Republican | Bill Quarishi | 50,050 | 24.4 | |
| Libertarian | Bill Wade | 4,683 | 2.3 | |
| Peace and Freedom | Victor Martinez | 2,906 | 1.4 | |
| American Independent | Nicholas W. Kudrovzeff | 1,893 | 0.9 | |
| Total votes | 205,016 | 100.0 | ||
| Turnout | ||||
| Democratic hold | ||||
1990
| Party | Candidate | Votes | % | |
|---|---|---|---|---|
| Democratic | Tom Lantos (Incumbent) | 105,029 | 65.9 | |
| Republican | Bill Quarishi | 45,818 | 28.8 | |
| Libertarian | June R. Genis | 8,518 | 5.3 | |
| Total votes | 159,365 | 100.0 | ||
| Turnout | ||||
| Democratic hold | ||||
1992
| Party | Candidate | Votes | % | ||
|---|---|---|---|---|---|
| Republican | Richard Pombo | 94,453 | 47.6 | ||
| Democratic | Patti Garamendi | 90,539 | 45.6 | ||
| Libertarian | Christine Roberts | 13,498 | 6.8 | ||
| Total votes | 198,490 | 100.0 | |||
| Turnout | |||||
| Republican win (new seat) | |||||
1994
| Party | Candidate | Votes | % | |
|---|---|---|---|---|
| Republican | Richard Pombo (Incumbent) | 99,302 | 62.14 | |
| Democratic | Randy A. Perry | 55,794 | 34.91 | |
| Libertarian | Joseph B. Miller | 4,718 | 2.95 | |
| Total votes | 159,814 | 100.0 | ||
| Turnout | ||||
| Republican hold | ||||
1996
| Party | Candidate | Votes | % | |
|---|---|---|---|---|
| Republican | Richard Pombo (Incumbent) | 107,477 | 59.4 | |
| Democratic | Jason Silva | 65,536 | 36.2 | |
| Libertarian | Kelly Rego | 5,077 | 2.8 | |
| Natural Law | Selene Bush | 3,006 | 1.6 | |
| Total votes | 181,096 | 100.0 | ||
| Turnout | ||||
| Republican hold | ||||
1998
| Party | Candidate | Votes | % | |
|---|---|---|---|---|
| Republican | Richard Pombo (Incumbent) | 95,496 | 61.43 | |
| Democratic | Robert L. Figueroa | 56,345 | 36.25 | |
| Libertarian | Jesse Baird | 3,608 | 2.32 | |
| Total votes | 155,449 | 100.0 | ||
| Turnout | ||||
| Republican hold | ||||
2000
| Party | Candidate | Votes | % | |
|---|---|---|---|---|
| Republican | Richard Pombo (Incumbent) | 120,635 | 57.9 | |
| Democratic | Tom Y. Santos | 79,539 | 38.1 | |
| Libertarian | Kathryn A. Russow | 5,036 | 2.4 | |
| Natural Law | Jon A. Kurey | 3,397 | 1.6 | |
| Total votes | 208,607 | 100.0 | ||
| Turnout | ||||
| Republican hold | ||||
2002
| Party | Candidate | Votes | % | |
|---|---|---|---|---|
| Republican | Richard Pombo (Incumbent) | 104,921 | 60.4 | |
| Democratic | Elaine Shaw | 69,035 | 39.6 | |
| Total votes | 173,956 | 100.0 | ||
| Turnout | ||||
| Republican hold | ||||
2004
| Party | Candidate | Votes | % | |
|---|---|---|---|---|
| Republican | Richard Pombo (Incumbent) | 163,582 | 61.3 | |
| Democratic | Jerry McNerney | 103,587 | 38.7 | |
| Total votes | 267,169 | 100.0 | ||
| Turnout | ||||
| Republican hold | ||||
2006
| Party | Candidate | Votes | % | |||
|---|---|---|---|---|---|---|
| Democratic | Jerry McNerney | 109,868 | 53.3 | |||
| Republican | Richard Pombo (Incumbent) | 96,396 | 46.7 | |||
| Total votes | 206,264 | 100.0 | ||||
| Turnout | ||||||
| Democratic gain from Republican | ||||||
2008
| Party | Candidate | Votes | % | |
|---|---|---|---|---|
| Democratic | Jerry McNerney (Incumbent) | 164,500 | 55.3 | |
| Republican | Dean Andal | 133,104 | 44.7 | |
| Total votes | 297,616 | 100.0 | ||
| Turnout | ||||
| Democratic hold | ||||
2010
| Party | Candidate | Votes | % | |
|---|---|---|---|---|
| Democratic | Jerry McNerney (Incumbent) | 115,361 | 47.97 | |
| Republican | David Harmer | 112,703 | 46.86 | |
| American Independent | David Christensen | 12,439 | 5.17 | |
| Total votes | 240,503 | 100.00 | ||
| Democratic hold | ||||
2012
| Party | Candidate | Votes | % | |
|---|---|---|---|---|
| Democratic | George Miller (Incumbent) | 200,743 | 69.7 | |
| Republican | Virginia Fuller | 87,136 | 30.3 | |
| Total votes | 287,879 | 100.0 | ||
| Democratic hold | ||||
2014
| Party | Candidate | Votes | % | |
|---|---|---|---|---|
| Democratic | Mark DeSaulnier | 117,502 | 67% | |
| Republican | Tue Phan | 57,160 | 33% | |
| Total votes | 174,662 | 100.0% | ||
| Democratic hold | ||||
2016
| Party | Candidate | Votes | % | |
|---|---|---|---|---|
| Democratic | Mark DeSaulnier (Incumbent) | 214,868 | 72% | |
| Republican | Roger A. Petersen | 83,341 | 28% | |
| Total votes | 298,209 | 100.0% | ||
| Democratic hold | ||||
2018
| Party | Candidate | Votes | % | |
|---|---|---|---|---|
| Democratic | Mark DeSaulnier (Incumbent) | 204,369 | 74% | |
| Republican | John Fitzgerald | 71,312 | 25% | |
| Total votes | 275,681 | 100.0% | ||
| Democratic hold | ||||
2020
| Party | Candidate | Votes | % | |
|---|---|---|---|---|
| Democratic | Mark DeSaulnier (incumbent) | 271,063 | 73.0 | |
| Republican | Nisha Sharma | 100,293 | 27.0 | |
| Total votes | 371,356 | 100.0 | ||
| Democratic hold | ||||
See also
- List of United States congressional districts
References
- "My Congressional District".
- "Introducing the 2021 Cook Political Report Partisan Voter Index". The Cook Political Report. April 15, 2021. Retrieved April 15, 2021.
- "Maps: Final Congressional Districts". Citizens Redistricting Commission. Archived from the original on March 10, 2013. Retrieved February 24, 2013.
- "CA 2022 Congressional". Dave's Redistricting. January 4, 2022. Retrieved November 11, 2022.
- "Supplement To The Statement Of Vote - November 3, 1998 General Election Counties by Congressional Districts" (PDF). Archived from the original (PDF) on September 29, 2011. Retrieved July 24, 2011.
- "Supplement to the Statement of Vote - November 3, 1998 Election Counties by Congressional Districts" (PDF). Archived from the original (PDF) on September 29, 2011. Retrieved July 24, 2011.
- "Statement of Vote (2000 President)" (PDF). Archived from the original (PDF) on June 11, 2007. Retrieved September 17, 2008.
- "Statement of Vote (2000 Senator)" (PDF). Archived from the original (PDF) on June 11, 2007. Retrieved September 17, 2008.
- Statement of Vote (2002 Governor) Archived 2010-11-11 at the Wayback Machine
- "Statement of Vote (2003 Recall Question)" (PDF). Archived from the original (PDF) on May 20, 2011. Retrieved October 8, 2007.
- "Statement of Vote (2003 Governor)" (PDF). Archived from the original (PDF) on May 20, 2011. Retrieved October 8, 2007.
- "Statement of Vote (2004 President)" (PDF). Archived from the original (PDF) on August 1, 2010. Retrieved August 8, 2007.
- Statement of Vote (2004 Senator) Archived 2011-08-10 at the Wayback Machine
- Statement of Vote (2006 Governor) Archived 2011-08-10 at the Wayback Machine
- Statement of Vote (2006 Senator) Archived 2011-08-10 at the Wayback Machine
- "(2008 President)". Archived from the original on February 11, 2009. Retrieved March 5, 2009.
- "Supplement to the Statement of Vote - Counties by Congressional Districts for Governor" (PDF). Archived from the original (PDF) on June 1, 2011. Retrieved July 24, 2011.
- "Supplement to the Statement of Vote - Counties by Congressional Districts for United States Senator" (PDF). Archived from the original (PDF) on June 1, 2011. Retrieved July 24, 2011.
- Supplement to the Statement of Vote - Counties by Congressional Districts for United States Senator
- Supplement to the Statement of Vote - Counties by Congressional Districts for Governor
- Supplement to the Statement of Vote - Counties by Congressional Districts for United States Senator
- Supplement to the Statement of Vote - Counties by Congressional Districts for Governor
- Supplement to the Statement of Vote - Counties by Congressional Districts for United States Senator
- "Counties by Congressional District for Recall Question" (PDF). sos.ca.gov. September 14, 2021. Retrieved May 2, 2022.
- 1920 election results
- 1922 election results
- 1924 election results
- 1926 election results
- 1928 election results
- 1930 election results
- 1932 election results
- 1934 election results
- 1936 election results
- 1938 election results
- 1940 election results
- 1942 election results
- 1944 election results
- 1946 election results
- 1948 election results
- 1950 election results
- 1952 election results
- 1954 election results
- 1956 election results
- 1958 election results
- 1960 election results
- 1962 election results
- 1964 election results
- 1966 election results
- Michael J. Dubin, United States Congressional Elections, 1788-1997: The Official Results, McFarland & Company Inc, Jefferson, North Carolina, 1998, p. 656.
- 1968 election results
- 1970 election results
- 1972 election results
- 1974 election results
- 1976 election results
- 1978 election results
- Michael J. Dubin, United States Congressional Elections, 1788-1997: The Official Results, McFarland & Company Inc, Jefferson, North Carolina, 1998, p. 714.
- 1980 election results
- 1982 election results
- 1984 election results
- 1986 election results
- 1988 election results
- 1990 election results
- 1992 election results
- 1994 election results
- 1996 election results
- 1998 election results
- 2000 election results
- 2002 general election results Archived February 3, 2009, at the Wayback Machine
- 2004 general election results Archived 2008-08-21 at the Wayback Machine
- 2006 general election results Archived November 27, 2008, at the Wayback Machine
- 2012 general election results Archived October 19, 2013, at the Wayback Machine
- 2014 general election results
External links
- GovTrack.us: California's 11th congressional district
- RAND California Election Returns: District Definitions (out of date)
- California Voter Foundation map - CD11 (out of date)
Другой контент может иметь иную лицензию. Перед использованием материалов сайта WikiSort.org внимательно изучите правила лицензирования конкретных элементов наполнения сайта.
WikiSort.org - проект по пересортировке и дополнению контента Википедии