world.wikisort.org - USASince becoming a U.S. state in 1959, Alaska has been entitled to one member in the United States House of Representatives, elected in the state's sole, at-large congressional district. By area, Alaska's congressional district is the largest congressional district in the United States, and is the second largest electoral district represented by a single member in the world, behind only Nunavut's sole electoral district in Canada.
At-large U.S. House district for Alaska
| Alaska's at-large congressional district |
|---|
 |
| Representative | |
|---|
| Area | 665,384.04[1] sq mi (1,723,336.8 km2) |
|---|
| Distribution | - 65.7% urban[2]
- 34.3% rural
|
|---|
| Population (2021) | 732,673[3] |
|---|
Median household
income | $77,845[4] |
|---|
| Ethnicity | - 62.0% White
- 15.0% other
- 7.4% Two or more races
- 6.3% Hispanic
- 6.0% Asian
- 3.3% Black
|
|---|
| Occupation | - 60.5% White-collar
- 22.4% Blue-collar
- 17.1% Gray-collar
|
|---|
| Cook PVI | R+8[5] |
|---|
On August 31, 2022, Democrat Mary Peltola defeated Republican former governor Sarah Palin in the special election to replace Don Young, who died on March 18. Peltola became the first Democrat elected to the House of Representatives from Alaska since 1972, and the first Alaskan Native to be elected to the United States House of Representatives in history.
The district is the most Republican-leaning congressional district represented by a Democrat, with a partisan lean of R+8.
History
The district was created when Alaska achieved statehood on January 3, 1959. Alaska is still entitled to only one member in the House of Representatives.
Voter registration
| Voter registration as of January 3, 2021[6] |
|---|
| Party |
Total voters |
Percentage |
|
Unaffiliated |
338,931 |
56.52% |
|
Republican |
149,173 |
24.87% |
|
Democratic |
81,355 |
13.57% |
|
Alaskan Independence |
19,109 |
3.19% |
|
Minor parties |
11,136 |
1.85% |
| Total |
599,704 |
100% |
Recent statewide election results
List of members representing the district
| Representative |
Party |
Term |
Cong
ress |
Electoral history |
|---|
| District created January 3, 1959 |

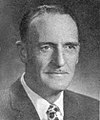
Ralph Julian Rivers |
Democratic |
January 3, 1959 –
December 30, 1966 |
86th
87th
88th
89th |
Elected in 1958.
Re-elected in 1960.
Re-elected in 1962.
Re-elected in 1964.
Lost re-election, then resigned early. |
| Vacant |
December 30, 1966 –
January 3, 1967 |
89th |
|

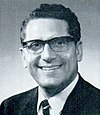
Howard Wallace Pollock |
Republican |
January 3, 1967 –
January 3, 1971 |
90th
91st |
Elected in 1966.
Re-elected in 1968.
Retired to run for governor. |

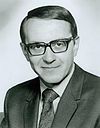
Nick Begich |
Democratic |
January 3, 1971 –
December 29, 1972 |
92nd |
Elected in 1970.
Went missing October 16, 1972.
Re-elected posthumously in 1972.
Declared dead December 29, 1972. |
| Vacant |
December 29, 1972 –
March 6, 1973 |
92nd
93rd |
|

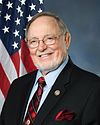
Don Young |
Republican |
March 6, 1973 –
March 18, 2022 |
93rd
94th
95th
96th
97th
98th
99th
100th
101st
102nd
103rd
104th
105th
106th
107th
108th
109th
110th
111th
112th
113th
114th
115th
116th
117th |
Elected to finish Begich's term.
Re-elected in 1974.
Re-elected in 1976.
Re-elected in 1978.
Re-elected in 1980.
Re-elected in 1982.
Re-elected in 1984.
Re-elected in 1986.
Re-elected in 1988.
Re-elected in 1990.
Re-elected in 1992.
Re-elected in 1994.
Re-elected in 1996.
Re-elected in 1998.
Re-elected in 2000.
Re-elected in 2002.
Re-elected in 2004.
Re-elected in 2006.
Re-elected in 2008.
Re-elected in 2010.
Re-elected in 2012.
Re-elected in 2014.
Re-elected in 2016.
Re-elected in 2018.
Re-elected in 2020.
Died. |
| Vacant |
March 18, 2022 –
September 13, 2022 |
117th |
|

Mary Peltola |
Democratic |
September 13, 2022 –
Present |
117th |
Elected to finish Young's term. |
Electoral history
The district had been considered safely Republican due to the fact that no Democrat was elected between 1972 and 2022.
1958 to 2010
| Year |
|
Republican |
|
Democratic |
|
Green |
|
Libertarian |
|
Others |
|
Write-in[7] |
|---|
| Candidate |
Votes |
Pct |
Candidate |
Votes |
Pct |
Candidate |
Votes |
Pct |
Candidate |
Votes |
Pct |
Candidate |
Votes |
Pct |
Votes |
Pct |
| 1958 |
Henry A. Benson |
20,699 |
42.5% |
Ralph Rivers |
27,948 |
57.5% |
|
|
|
|
|
|
|
|
|
|
|
| 1960 |
R. L. Rettig |
25,517 |
43.2% |
Ralph Rivers (Incumbent) |
33,546 |
56.8% |
|
|
|
|
|
|
|
|
|
|
|
| 1962 |
Lowell Thomas Jr. |
26,638 |
44% |
Ralph Rivers (Incumbent) |
33,953 |
56% |
|
|
|
|
|
|
|
|
|
|
|
| 1964 |
Lowell Thomas Jr. |
32,556 |
48.5% |
Ralph Rivers (Incumbent) |
34,590 |
51.5% |
|
|
|
|
|
|
|
|
|
|
|
| 1966 |
Howard W. Pollock |
34,040 |
51.6% |
Ralph Rivers (Incumbent) |
31,867 |
48.4% |
|
|
|
|
|
|
|
|
|
|
|
| 1968 |
Howard W. Pollock (Incumbent) |
43,577 |
54.2% |
Nick Begich |
36,785 |
45.8% |
|
|
|
|
|
|
|
|
|
|
|
| 1970 |
Frank Murkowski |
35,947 |
44.9% |
Nick Begich |
44,137 |
55.1% |
|
|
|
|
|
|
|
|
|
|
|
| 1972 |
Don Young |
41,750 |
43.8% |
Nick Begich (Incumbent) |
53,651 |
56.2% |
|
|
|
|
|
|
|
|
|
|
|
| 1973 |
Don Young |
35,044 |
51.4% |
Emil Notti |
33,123 |
48.6% |
|
|
|
|
|
|
|
|
|
|
|
| 1974 |
Don Young (Incumbent) |
51,641 |
53.8% |
William L. Hensley |
44,280 |
46.2% |
|
|
|
|
|
|
|
|
|
|
|
| 1976 |
Don Young (Incumbent) |
83,722 |
70.8% |
Eben Hopson |
34,194 |
28.9% |
|
|
|
|
|
|
|
|
|
292 |
0.2% |
| 1978 |
Don Young (Incumbent) |
68,811 |
55.4% |
Patrick Rodey |
55,176 |
44.4% |
|
|
|
|
|
|
|
|
|
200 |
0.2% |
| 1980 |
Don Young (Incumbent) |
114,089 |
73.8% |
Kevin Parnell |
39,922 |
25.8% |
|
|
|
|
|
|
|
|
|
607 |
0.4% |
| 1982 |
Don Young (Incumbent) |
128,274 |
70.8% |
Dave Carlson |
52,011 |
28.7% |
|
|
|
|
|
|
|
|
|
799 |
0.4% |
| 1984 |
Don Young (Incumbent) |
113,582 |
55% |
Pegge Begich |
86,052 |
41.7% |
|
|
|
|
|
|
Betty Breck (I) |
6,508 |
3.2% |
295 |
0.1% |
| 1986 |
Don Young (Incumbent) |
101,799 |
56.5% |
Pegge Begich |
74,053 |
41.1% |
|
|
|
Betty Breck |
4,182 |
2.3% |
|
|
|
243 |
0.1% |
| 1988 |
Don Young (Incumbent) |
120,595 |
62.5% |
Peter Gruenstein |
71,881 |
37.3% |
|
|
|
|
|
|
|
|
|
479 |
0.2% |
| 1990 |
Don Young (Incumbent) |
99,003 |
51.7% |
John S. Devens |
91,677 |
47.8% |
|
|
|
|
|
|
|
|
|
967 |
0.5% |
| 1992 |
Don Young (Incumbent) |
111,849 |
46.8% |
John S. Devens |
102,378 |
42.8% |
Mike Milligan |
9,529 |
4% |
|
|
|
Michael States (AI) |
15,049 |
6.3% |
311 |
0.1% |
| 1994 |
Don Young (Incumbent) |
118,537 |
56.9% |
Tony Smith |
68,172 |
32.7% |
Joni Whitmore |
21,277 |
10.2% |
|
|
|
|
|
|
254 |
0.1% |
| 1996 |
Don Young (Incumbent) |
138,834 |
59.4% |
Georgianna Lincoln |
85,114 |
36.4% |
John J. G. Grames |
4,513 |
1.9% |
|
|
|
William J. Nemec II (AI) |
5,017 |
2.1% |
222 |
0.1% |
| 1998 |
Don Young (Incumbent) |
139,676 |
62.6% |
Jim Duncan |
77,232 |
34.6% |
John J. G. Grames |
5,923 |
2.7% |
|
|
|
|
|
|
469 |
0.2% |
| 2000 |
Don Young (Incumbent) |
190,862 |
69.6% |
Clifford Mark Greene |
45,372 |
16.5% |
Anna C. Young |
22,440 |
8.2% |
Leonard J. Karpinski |
4,802 |
1.8% |
Jim Dore (AI) |
10,085 |
3.7% |
832 |
0.3% |
| 2002 |
Don Young (Incumbent) |
169,685 |
74.5% |
Clifford Mark Greene |
39,357 |
17.3% |
Russell deForest |
14,435 |
6.3% |
Rob Clift |
3,797 |
1.7% |
|
|
|
291 |
0.1% |
| 2004 |
Don Young (Incumbent) |
213,216 |
71.1% |
Thomas M. Higgins |
67,074 |
22.4% |
Timothy A. Feller |
11,434 |
3.8% |
Alvin A. Anders |
7,157 |
2.4% |
|
|
|
1,115 |
0.4% |
| 2006 |
Don Young (Incumbent) |
132,743 |
56.6% |
Diane E. Benson |
93,879 |
40% |
Eva Ince |
1,819 |
0.8% |
Alexander Crawford |
4,029 |
1.7% |
William Ratigan |
1,615 |
0.7% |
560 |
0.2% |
| 2008 |
Don Young (Incumbent) |
158,939 |
50.1% |
Ethan Berkowitz |
142,560 |
45% |
|
|
|
|
|
|
Don Wright |
14,274 |
4.5% |
1,205 |
0.4% |
| 2010 |
Don Young (Incumbent) |
175,384 |
69% |
Harry Crawford |
77,606 |
30.5% |
|
|
|
|
|
|
|
|
|
1,345 |
0.5% |
| Year |
Republican |
Democratic |
Green |
Libertarian |
Others |
Write-in |
Source: "Election Statistics". Office of the Clerk of the House of Representatives. Archived from the original on July 30, 2008. Retrieved August 8, 2008.
2012
2014
2016
2018
2020
2022 special
2022 Alaska's at-large congressional district special election
| Party |
Candidate |
Round 1 |
Round 2 |
| Votes |
% |
Transfer |
Votes |
% |
|
Democratic |
Mary Peltola |
74,807 |
39.66% |
+16,399 |
91,206 |
51.47% |
|
Republican |
Sarah Palin |
58,328 |
30.93% |
+27,659 |
85,987 |
48.53% |
|
Republican |
Nick Begich |
52,504 |
27.84% |
-52,504 |
Eliminated |
|
Write-in |
2,971 |
1.58% |
-2,971 |
Eliminated |
| Total votes |
188,610 |
100.00% |
|
177,193 |
94.29% |
| Inactive ballots |
0 |
0.00% |
+10,726 |
10,726 |
5.71% |
|
Democratic gain from Republican |
2022
2022 Alaska's at-large congressional district election
| Party |
Candidate |
Round 1 |
| Votes |
% |
Transfer |
|
Republican |
Nick Begich |
|
|
|
|
Libertarian |
Chris Bye |
|
|
|
|
Republican |
Sarah Palin |
|
|
|
|
Democratic |
Mary Peltola (incumbent) |
|
|
|
|
Write-in |
|
|
|
| Total votes |
|
|
|
| Inactive ballots |
|
|
|
Notes
- Also listed as having the Democratic nomination.
References
- Specific
- https://www.census.gov/prod/cen2010/cph-2-1.pdf [bare URL PDF]
- "Congressional Districts". proximityone.com. Retrieved October 9, 2020.
- Center for New Media & Promotion (CNMP), US Census Bureau. "My Congressional District". www.census.gov. Retrieved October 30, 2022.
- Center for New Media & Promotion (CNMP), US Census Bureau. "My Congressional District". www.census.gov. Retrieved October 30, 2022.
- "Introducing the 2022 Cook Political Report Partisan Voter Index". The Cook Political Report. June 8, 2022. Retrieved June 12, 2022.
- https://www.elections.alaska.gov/statistics/2021/JAN/VOTERS%20BY%20PARTY%20AND%20PRECINCT.htm [bare URL]
- Prior to the 1976 election, official election returns released by the State of Alaska were typewritten rather than computer generated, and write-in votes were not included in published vote totals
- Johnson, Cheryl L. (February 28, 2019). "Statistics of the Congressional Election of November 6, 2018". Clerk of the U.S. House of Representatives. Retrieved April 27, 2019.
- "State of Alaska 2020 General Election" (PDF). Alaska Division of Elections. November 3, 2020. Retrieved November 19, 2020.
- General
Alaska's congressional districts |
|---|
- See also
- Alaska's past and present representatives, senators, and delegations
- Recent U.S. House elections in Alaska: 2006, 2008, 2010, 2012, 2014, 2016, 2018, 2020, 2022
- All U.S. districts
- Apportionment
- Redistricting
- Gerrymandering
|
|
|---|
|
| Topics |
- Index
- Geography
- Earthquakes
- Climate
- Wildlife
- History
- People
- Transportation
- Government
- Delegations
- Music
- Symbols
|
|---|
| Society |
- Crime
- Demographics
- Economy
- Education
- Elections
- Rural dentistry
- Politics
- Sports
|
|---|
| Regions | |
|---|
Largest cities
pop. over 25,000 | |
|---|
Smaller cities
pop. over 2,000 | |
|---|
| Boroughs | |
|---|
| Native Corporations |
- Arctic Slope Regional Corporation
- Bering Straits Native Corporation
- NANA Regional Corporation
- Calista Corporation
- Doyon, Limited
- Cook Inlet Region, Inc.
- Bristol Bay Native Corporation
- The Aleut Corporation
- Chugach Alaska Corporation
- Sealaska Corporation
- Koniag, Incorporated
- Ahtna, Incorporated
- The 13th Regional Corporation
|
|---|
| Census Areas | |
|---|
 Alaska portal Alaska portal |
Authority control  | |
|---|
Текст в блоке "Читать" взят с сайта "Википедия" и доступен по лицензии Creative Commons Attribution-ShareAlike; в отдельных случаях могут действовать дополнительные условия.
Другой контент может иметь иную лицензию. Перед использованием материалов сайта WikiSort.org внимательно изучите правила лицензирования конкретных элементов наполнения сайта.
2019-2025
WikiSort.org - проект по пересортировке и дополнению контента Википедии


