world.wikisort.org - France
Courniou (French pronunciation: [kuʁnju]; Occitan: Cornhon) is a commune in the Hérault department in southern France.
Courniou | |
|---|---|
Commune | |
 View | |
 Coat of arms | |
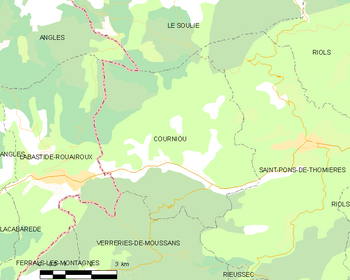
Location of Courniou  | |
 Courniou  Courniou | |
| Coordinates: 43°28′28″N 2°42′45″E | |
| Country | France |
| Region | Occitania |
| Department | Hérault |
| Arrondissement | Béziers |
| Canton | Saint-Pons-de-Thomières |
| Government | |
| • Mayor (2020–2026) | Catherine Sonzogni[1] |
| Area 1 | 30.06 km2 (11.61 sq mi) |
| Population | 616 |
| • Density | 20/km2 (53/sq mi) |
| Time zone | UTC+01:00 (CET) |
| • Summer (DST) | UTC+02:00 (CEST) |
| INSEE/Postal code | 34086 /34220 |
| Elevation | 329–951 m (1,079–3,120 ft) (avg. 362 m or 1,188 ft) |
| 1 French Land Register data, which excludes lakes, ponds, glaciers > 1 km2 (0.386 sq mi or 247 acres) and river estuaries. | |
Geography
Climate
Courniou has a warm-summer mediterranean climate (Köppen climate classification Csb). The average annual temperature in Courniou is 11.9 °C (53.4 °F). The average annual rainfall is 1,444.7 mm (56.88 in) with December as the wettest month. The temperatures are highest on average in July, at around 20.2 °C (68.4 °F), and lowest in January, at around 4.8 °C (40.6 °F). The highest temperature ever recorded in Courniou was 39.3 °C (102.7 °F) on 12 August 2003; the coldest temperature ever recorded was −15.5 °C (4.1 °F) on 16 January 1985.
| Climate data for Courniou (1981–2010 averages, extremes 1971−2014) | |||||||||||||
|---|---|---|---|---|---|---|---|---|---|---|---|---|---|
| Month | Jan | Feb | Mar | Apr | May | Jun | Jul | Aug | Sep | Oct | Nov | Dec | Year |
| Record high °C (°F) | 19.9 (67.8) |
23.0 (73.4) |
26.5 (79.7) |
28.2 (82.8) |
31.8 (89.2) |
36.0 (96.8) |
35.9 (96.6) |
39.3 (102.7) |
33.0 (91.4) |
29.1 (84.4) |
24.5 (76.1) |
22.0 (71.6) |
39.3 (102.7) |
| Average high °C (°F) | 8.0 (46.4) |
8.8 (47.8) |
11.9 (53.4) |
14.3 (57.7) |
18.5 (65.3) |
22.6 (72.7) |
25.8 (78.4) |
25.6 (78.1) |
21.7 (71.1) |
16.8 (62.2) |
11.4 (52.5) |
8.6 (47.5) |
16.2 (61.2) |
| Daily mean °C (°F) | 4.8 (40.6) |
5.3 (41.5) |
7.8 (46.0) |
9.9 (49.8) |
13.7 (56.7) |
17.4 (63.3) |
20.2 (68.4) |
20.0 (68.0) |
16.6 (61.9) |
12.9 (55.2) |
8.1 (46.6) |
5.5 (41.9) |
11.9 (53.4) |
| Average low °C (°F) | 1.7 (35.1) |
1.8 (35.2) |
3.7 (38.7) |
5.6 (42.1) |
8.9 (48.0) |
12.1 (53.8) |
14.5 (58.1) |
14.4 (57.9) |
11.5 (52.7) |
9.1 (48.4) |
4.9 (40.8) |
2.3 (36.1) |
7.6 (45.7) |
| Record low °C (°F) | −15.5 (4.1) |
−11.7 (10.9) |
−12.5 (9.5) |
−2.5 (27.5) |
−1.2 (29.8) |
3.5 (38.3) |
5.5 (41.9) |
5.0 (41.0) |
−0.3 (31.5) |
−2.0 (28.4) |
−8.2 (17.2) |
−10.5 (13.1) |
−15.5 (4.1) |
| Average precipitation mm (inches) | 161.0 (6.34) |
148.5 (5.85) |
117.9 (4.64) |
151.6 (5.97) |
102.6 (4.04) |
58.0 (2.28) |
35.4 (1.39) |
60.5 (2.38) |
92.6 (3.65) |
162.8 (6.41) |
174.5 (6.87) |
179.3 (7.06) |
1,444.7 (56.88) |
| Average precipitation days (≥ 1.0 mm) | 13.6 | 12.4 | 12.0 | 12.4 | 10.0 | 7.0 | 5.1 | 6.5 | 7.8 | 11.9 | 12.7 | 12.7 | 124.0 |
| Source: Meteociel[3] | |||||||||||||
Population
| Year | Pop. | ±% |
|---|---|---|
| 1962 | 385 | — |
| 1968 | 529 | +37.4% |
| 1975 | 503 | −4.9% |
| 1982 | 537 | +6.8% |
| 1990 | 595 | +10.8% |
| 1999 | 606 | +1.8% |
| 2008 | 620 | +2.3% |
See also
References
- "Répertoire national des élus: les maires". data.gouv.fr, Plateforme ouverte des données publiques françaises (in French). 9 August 2021.
- "Populations légales 2019". The National Institute of Statistics and Economic Studies. 29 December 2021.
- "Normales et records pour Courniou (34)". Meteociel. Retrieved 5 June 2022.
Wikimedia Commons has media related to Courniou.
Authority control | |
|---|---|
| General |
|
| National libraries | |
This Hérault geographical article is a stub. You can help Wikipedia by expanding it. |
Текст в блоке "Читать" взят с сайта "Википедия" и доступен по лицензии Creative Commons Attribution-ShareAlike; в отдельных случаях могут действовать дополнительные условия.
Другой контент может иметь иную лицензию. Перед использованием материалов сайта WikiSort.org внимательно изучите правила лицензирования конкретных элементов наполнения сайта.
Другой контент может иметь иную лицензию. Перед использованием материалов сайта WikiSort.org внимательно изучите правила лицензирования конкретных элементов наполнения сайта.
2019-2026
WikiSort.org - проект по пересортировке и дополнению контента Википедии
WikiSort.org - проект по пересортировке и дополнению контента Википедии