world.wikisort.org - Canada
Scarborough—Guildwood is a provincial electoral district in Toronto, Ontario, Canada, that has been represented in Legislative Assembly of Ontario since the 2007 provincial election.
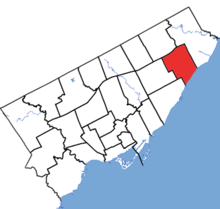 Scarborough—Guildwood in relation to the other Toronto ridings | |||
| Coordinates: | 43.763°N 79.207°W | ||
| Provincial electoral district | |||
| Legislature | Legislative Assembly of Ontario | ||
| MPP |
Liberal | ||
| District created | 2006 | ||
| First contested | 2007 | ||
| Last contested | 2022 | ||
| Demographics | |||
| Population (2016) | 102,390 | ||
| Electors (2018) | 68,662 | ||
| Area (km²) | 27 | ||
| Pop. density (per km²) | 3,792.2 | ||
| Census division(s) | Toronto | ||
| Census subdivision(s) | Toronto | ||


It was created in 2003 from parts of Scarborough East, Scarborough Southwest and Scarborough Centre.
It is centred on the Guildwood neighbourhood. It consists of the part of the City of Toronto bounded by a line drawn from Lake Ontario north along Markham Road, west along Eglinton Avenue, north along Bellamy Road South, west along Lawrence Avenue, north along McCowan Road, east along Highway 401, south along Morningside Avenue back to Lake Ontario.
Members of Provincial Parliament
| Assembly | Years | Member | Party | |
|---|---|---|---|---|
| Scarborough—Guildwood Riding created from Scarborough East, Scarborough Southwest and Scarborough Centre |
||||
| 39th | 2007–2011 | Margarett Best | Liberal | |
| 40th | 2011–2013 | |||
| 2013–2014 | Mitzie Hunter | Liberal | ||
| 41st | 2014–2018 | |||
| 42nd | 2018–2022 | |||
| 43rd | 2022–present | |||
| Sourced from the Ontario Legislative Assembly[1] | ||||
Election results
| 2022 Ontario general election | ||||||||
|---|---|---|---|---|---|---|---|---|
| ** Preliminary results — Not yet official ** | ||||||||
| Party | Candidate | Votes | % | ±% | ||||
| Liberal | Mitzie Hunter | 12,271 | 45.85 | +12.51 | ||||
| Progressive Conservative | Alicia Vianga | 8,484 | 31.70 | -1.44 | ||||
| New Democratic | Veronica Javier | 4,523 | 16.90 | -10.72 | ||||
| Green | Dean Boulding | 745 | 2.78 | +0.33 | ||||
| New Blue | Opa Hope Day | 351 | 1.31 | +0.10 | ||||
| Ontario Party | William Moore | 248 | 0.93 | |||||
| People's Political Party | Kevin Clarke | 139 | 0.52 | |||||
| Total valid votes | 26,761 | 100.0 | ||||||
| Total rejected, unmarked and declined ballots | ||||||||
| Turnout | 37.98 | |||||||
| Eligible voters | 70,445 | |||||||
| Liberal hold | Swing | +6.98 | ||||||
| Source: Elections Ontario[2] | ||||||||
| 2018 Ontario general election | ||||||||
|---|---|---|---|---|---|---|---|---|
| Party | Candidate | Votes | % | ±% | ||||
| Liberal | Mitzie Hunter | 11,972 | 33.34 | -16.72 | ||||
| Progressive Conservative | Roshan Nallaratnam | 11,898 | 33.14 | +5.42 | ||||
| New Democratic | Tom Packwood | 9,917 | 27.62 | +10.7 | ||||
| Green | Linda Rice | 878 | 2.45 | -0.49 | ||||
| Libertarian | Hamid-Reza Dehnad-Tabatabaei | 445 | 1.24 | -0.12 | ||||
| Trillium | George Marcos Garvida | 419 | 1.17 | |||||
| Special Needs | Wanda Ryan | 159 | 0.44 | |||||
| People's Political Party | Heather Dunbar | 151 | 0.42 | |||||
| Independent | Benjamin Mbaegbu | 66 | 0.18 | |||||
| Total valid votes | 35,905 | 100.0 | ||||||
| Total rejected, unmarked and declined ballots | ||||||||
| Turnout | ||||||||
| Eligible voters | ||||||||
| Liberal hold | Swing | -11.05 | ||||||
| Source: Elections Ontario[3] | ||||||||
| 2014 Ontario general election | ||||||||
|---|---|---|---|---|---|---|---|---|
| Party | Candidate | Votes | % | ±% | ||||
| Liberal | Mitzie Hunter | 17,498 | 50.06 | +14.21 | ||||
| Progressive Conservative | Ken Kirupa | 9,688 | 27.72 | -3.08 | ||||
| New Democratic | Shuja Syed | 5,915 | 16.92 | -11.43 | ||||
| Green | Jeffrey W. R. Bustard | 1,029 | 2.94 | +0.79 | ||||
| Libertarian | Richard Kerr | 476 | 1.36 | +0.87 | ||||
| Freedom | Khalid Mokhtarzada | 228 | 0.65 | +0.33 | ||||
| Canadians' Choice | John Sawdon | 120 | 0.34 | |||||
| Total valid votes | 34,954 | 100.0 | ||||||
| Liberal hold | Swing | +8.64 | ||||||
| Source: Elections Ontario[4] | ||||||||
| Ontario provincial by-election, August 1, 2013 Resignation of Margarett Best | ||||||||
|---|---|---|---|---|---|---|---|---|
| Party | Candidate | Votes | % | ±% | ||||
| Liberal | Mitzie Hunter | 8,852 | 35.85 | -13.09 | ||||
| Progressive Conservative | Ken Kirupa | 7,605 | 30.80 | +2.15 | ||||
| New Democratic | Adam Giambrone | 7,000 | 28.35 | +8.93 | ||||
| Green | Nick Leeson | 532 | 2.15 | +0.86 | ||||
| Independent | Jim Hamilton | 195 | 0.79 | |||||
| Special Needs | Danish Ahmed | 183 | 0.74 | |||||
| Libertarian | Heath Thomas | 120 | 0.49 | -0.79 | ||||
| Family Coalition | Raphael Rosch | 104 | 0.42 | |||||
| Freedom | Matthew Oliver | 80 | 0.32 | -0.10 | ||||
| The People | Bill Rawdah | 22 | 0.09 | |||||
| Total valid votes | 24,693 | 100.00 | ||||||
| Total rejected, unmarked and declined ballots | 180 | 0.72 | ||||||
| Turnout | 24,873 | 35.83 | ||||||
| Eligible voters | 69,425 | |||||||
| Liberal hold | Swing | -7.62 | ||||||
| Source: Elections Ontario[5] | ||||||||
| 2011 Ontario general election | ||||||||
|---|---|---|---|---|---|---|---|---|
| Party | Candidate | Votes | % | ±% | ||||
| Liberal | Margarett Best | 15,607 | 48.93 | +6.41 | ||||
| Progressive Conservative | Gary Ellis | 9,137 | 28.65 | +0.65 | ||||
| New Democratic | Lorri Urban | 6,194 | 19.42 | -.2.51 | ||||
| Green | Naoshad Pochkhanawala | 413 | 1.29 | -4.04 | ||||
| Libertarian | Sam Apelbaum | 407 | 1.28 | -0.15 | ||||
| Freedom | Matthew Oliver | 136 | 0.43 | |||||
| Total valid votes | 31,894 | 100.0 | ||||||
| Total rejected, unmarked and declined ballots | 223 | 0.69 | ||||||
| Turnout | 32,117 | 47.65 | ||||||
| Eligible voters | 67,408 | |||||||
| Liberal hold | Swing | +2.88 | ||||||
| Source: Elections Ontario[6] | ||||||||
| 2007 Ontario general election | ||||||||
|---|---|---|---|---|---|---|---|---|
| Party | Candidate | Votes | % | ±% | ||||
| Liberal | Margarett Best | 14,430 | 42.52 | -10.03 | ||||
| Progressive Conservative | Gary Grant | 9,503 | 28.00 | -1.99 | ||||
| New Democratic | Neethan Shan | 7,441 | 21.93 | +9.23 | ||||
| Green | Glenn Kitchen | 1,811 | 5.34 | |||||
| Libertarian | Sam Apelbaum | 484 | 1.43 | |||||
| Family Coalition | Daniel Carvalho | 267 | 0.79 | |||||
| Total valid votes | 33,936 | 100.0 | ||||||
| Difference | 4,927 | 14.52 | ||||||
| Total rejected ballots | 376 | 1.10 | ||||||
| Turnout | 34,312 | 51.28 | ||||||
| Liberal notional hold | Swing | -4.02 | ||||||
| Elections Ontario.[7] | ||||||||
^ Change based on redistributed result[8]
2007 electoral reform referendum
| 2007 Ontario electoral reform referendum | |||
|---|---|---|---|
| Side | Votes | % | |
| First Past the Post | 19,514 | 59.98 | |
| Mixed member proportional | 13,020 | 40.02 | |
| Total valid votes | 32,534 | 100.00 | |
| Sourced from Elections Ontario.[9] | |||
References
- For a listing of each MPP's Queen's Park curriculum vitae see below:
- For Margarett Best's Legislative Assembly information see "Margarett Best, MPP". Parliamentary History. Toronto: Legislative Assembly of Ontario. 2014. Retrieved 2014-09-08.
- For Mitzie Hunter's Legislative Assembly information see "Mitzie Hunter, MPP". Parliamentary History. Toronto: Legislative Assembly of Ontario. 2014. Retrieved 2014-09-08.
- "Candidates in: Scarborough—Guildwood (095)". Elections Ontario. Retrieved May 9, 2022.
- "Summary of Valid Votes Cast for each Candidate" (PDF). Elections Ontario. p. 10. Retrieved 20 January 2019.
- "General Election Results by District, 082 Scarborough—Guildwood". Elections Ontario. 2014. Retrieved 17 June 2014.
- "Summary of Valid Ballots Cast for each Candidate" (PDF). Elections Ontario. p. 1. Archived from the original (PDF) on 2014-05-05. Retrieved 2014-05-05.
- "Summary of Valid Ballots Cast for each Candidate" (PDF). Elections Ontario. p. 16. Archived from the original (PDF) on 2013-03-30. Retrieved 2012-09-28.
- "Summary of Valid Ballots Cast for each Candidate" (PDF). Elections Ontario. p. 14. Archived from the original (PDF) on 2012-06-08. Retrieved 2012-09-28.
- "082-Scarborough—Guildwood".
- "Referendum Statistical Results" (PDF). Elections Ontario. p. 10. Archived from the original (PDF) on 2012-06-08. Retrieved 2012-09-28.
External links
Текст в блоке "Читать" взят с сайта "Википедия" и доступен по лицензии Creative Commons Attribution-ShareAlike; в отдельных случаях могут действовать дополнительные условия.
Другой контент может иметь иную лицензию. Перед использованием материалов сайта WikiSort.org внимательно изучите правила лицензирования конкретных элементов наполнения сайта.
Другой контент может иметь иную лицензию. Перед использованием материалов сайта WikiSort.org внимательно изучите правила лицензирования конкретных элементов наполнения сайта.
2019-2025
WikiSort.org - проект по пересортировке и дополнению контента Википедии
WikiSort.org - проект по пересортировке и дополнению контента Википедии