world.wikisort.org - Canada
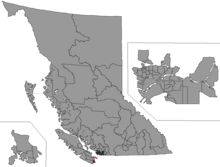
Saanich North and the Islands is a provincial electoral district for the Legislative Assembly of British Columbia, Canada. It is located in the northern suburbs of the provincial capital, Victoria, and includes the southern Gulf Islands.
 | |||
| Provincial electoral district | |||
| Legislature | Legislative Assembly of British Columbia | ||
| MLA |
Green | ||
| District created | 1990 | ||
| First contested | 1991 | ||
| Last contested | 2020 | ||
| Demographics | |||
| Population (2001) | 52,671 | ||
| Area (km²) | 462.65 | ||
| Pop. density (per km²) | 113.8 | ||
| Census subdivision(s) | Southern Gulf Islands, North Saanich, Central Saanich, and Sidney | ||
Saanich North and the Islands was created by 1990 legislation dividing the previous two-member district of Saanich and the Islands which came into effect for the 1991 B.C. election.
In 2017 Adam Olsen was elected MLA for the Green Party of BC and in 2020 Olsen defeated NDP Zeb King.
Demographics
| Population, 2001 | 52,671 |
| Population Change, 1996–2001 | 3.6% |
| Area (km²) | 462.65 |
| Pop. Density | 114 |
Geography
Saanich North and the Islands consists of the Southern Gulf Islands as well as the municipalities of North Saanich, Central Saanich, and Sidney on Vancouver Island.[1]
History
This section is empty. You can help by adding to it. (July 2010) |
Members of Legislative Assembly
Over the district's existence, it elected the following members of the Legislative Assembly of British Columbia:
| Saanich North and the Islands | ||||
|---|---|---|---|---|
| Assembly | Years | Member | Party | |
| 35th | 1991–1996 | Clive Tanner | Liberal | |
| 36th | 1996–2001 | Murray Coell | ||
| 37th | 2001–2005 | |||
| 38th | 2005–2009 | |||
| 39th | 2009–2013 | |||
| 40th | 2013–2017 | Gary Holman | New Democratic | |
| 41st | 2017–2020 | Adam Olsen | Green | |
| 42nd | 2020–present | |||
Election results
| 2020 British Columbia general election | ||||||||
|---|---|---|---|---|---|---|---|---|
| Party | Candidate | Votes | % | ±% | Expenditures | |||
| Green | Adam Olsen | 17,897 | 51.97 | +10.02 | $51,642.52 | |||
| New Democratic | Zeb King | 9,990 | 29.01 | −1.55 | $39,975.02 | |||
| Liberal | Stephen P. Roberts | 6,547 | 19.01 | −7.45 | $38,138.02 | |||
| Total valid votes | 34,434 | 100.00 | – | |||||
| Total rejected ballots | 159 | 0.46 | +0.24 | |||||
| Turnout | 34,593 | 67.66 | −6.48 | |||||
| Registered voters | 51,126 | |||||||
| Source: Elections BC[2][3] | ||||||||
| 2017 British Columbia general election | ||||||||
|---|---|---|---|---|---|---|---|---|
| Party | Candidate | Votes | % | ±% | Expenditures | |||
| Green | Adam Olsen | 14,775 | 41.95 | +9.88 | $68,851 | |||
| New Democratic | Gary Holman | 10,764 | 30.56 | −2.71 | $70,266 | |||
| Liberal | Stephen P. Roberts | 9,321 | 26.46 | −6.30 | $71,305 | |||
| Independent | Jordan Templeman | 364 | 1.03 | – | $1,127 | |||
| Total valid votes | 35,224 | 100.00 | – | |||||
| Total rejected ballots | 79 | 0.22 | −0.08 | |||||
| Turnout | 35,303 | 74.14 | +4.93 | |||||
| Registered voters | 47,615 | |||||||
| Source: Elections BC[4][5] | ||||||||
| 2013 British Columbia general election | ||||||||
|---|---|---|---|---|---|---|---|---|
| Party | Candidate | Votes | % | |||||
| New Democratic | Gary Holman | 10,515 | 33.27 | |||||
| Liberal | Stephen P. Roberts | 10,352 | 32.76 | |||||
| Green | Adam Olsen | 10,136 | 32.07 | |||||
| Independent | Scott McEachern | 599 | 1.90 | |||||
| Total valid votes | 31,602 | 100.00 | ||||||
| Total rejected ballots | 94 | 0.30 | ||||||
| Turnout | 31,696 | 69.21 | ||||||
| Source: Elections BC[6] | ||||||||
| 2009 British Columbia general election | ||||||||
|---|---|---|---|---|---|---|---|---|
| Party | Candidate | Votes | % | ±% | ||||
| Liberal | Murray Coell | 13,120 | 44.91 | +0.9 | ||||
| New Democratic | Gary Holman | 12,875 | 44.07 | +6.9 | ||||
| Green | Tom Bradfield | 3,220 | 11.02 | −4.1 | ||||
| Total valid votes | 29,215 | |||||||
| 2005 British Columbia general election | ||||||||
|---|---|---|---|---|---|---|---|---|
| Party | Candidate | Votes | % | |||||
| Liberal | Murray Coell | 13,265 | 44.01 | |||||
| New Democratic | Christine Hunt | 11,265 | 37.37 | |||||
| Green | Ken Rouleau | 4,557 | 15.12 | |||||
| Democratic Reform | Ian Douglas Bruce | 1,056 | 3.50 | |||||
| 2001 British Columbia general election | ||||||||
|---|---|---|---|---|---|---|---|---|
| Party | Candidate | Votes | % | |||||
| Liberal | Murray Coell | 15,406 | 54.29 | |||||
| Green | Andrew Lewis | 7,211 | 25.41 | |||||
| New Democratic | Paul Sam | 5,011 | 17.66 | |||||
| Marijuana | Christina Racki | 491 | 1.73 | |||||
| Independent | Balther Johannes Jensen | 257 | 0.91 | |||||
| 1996 British Columbia general election | ||||||||
|---|---|---|---|---|---|---|---|---|
| Party | Candidate | Votes | % | |||||
| Liberal | Murray Coell | 13,374 | 47.57% | |||||
| New Democratic | Lynda Laushway | 10,546 | 37.51% | |||||
| Reform | Ross Imrie | 1,627 | 5.79% | |||||
| Progressive Democrat | Gary Lundy | 1,533 | 5.45% | |||||
| Green | Wally du Temple | 898 | 3.19% | |||||
| Natural Law | Paul Tessier | 72 | 0.26% | |||||
| Western Canada Concept | Zino Del Monte | 63 | 0.22% | |||||
| Total valid votes | 28,113 | 100.00% | ||||||
| Total rejected ballots | 120 | 0.43% | ||||||
| Turnout | 28,233 | 77.89% | ||||||
| 1991 British Columbia general election | ||||||||
|---|---|---|---|---|---|---|---|---|
| Party | Candidate | Votes | % | |||||
| Liberal | Clive Tanner | 13,633 | 52.53 | |||||
| New Democratic | Elsie McMurphy | 8,745 | 33.70 | |||||
| Social Credit | Richard Holmes | 2,917 | 11.24 | |||||
| Reform | Don Hutchings | 557 | 2.15 | |||||
| Family Coalition | Thomas Aussenegg | 99 | 0.38 | |||||
| Total valid votes | 25,951 | 100.00 | ||||||
| Total rejected ballots | 307 | 1.17 | ||||||
| Turnout | 26,258 | 82.31 | ||||||
External links
- BC Stats Profile - 2001
- Results of 2001 election (pdf)
- 2001 Expenditures
- Results of 1996 election
- 1996 Expenditures
- Results of 1991 election
- 1991 Expenditures
- Website of the Legislative Assembly of British Columbia
- Riding Map (pdf)
References
- McElroy, Justin (April 11, 2017). "B.C. Votes 2017: Saanich North and the Islands riding profile". CBC News. Retrieved May 16, 2017.
- "Statement of Votes — 42nd Provincial General Election" (PDF). Elections BC. Retrieved August 7, 2021.
{{cite web}}: CS1 maint: url-status (link) - "Election Financing Reports". Elections BC. Retrieved February 7, 2021.
- "2017 Provincial General Election - Statement of Votes" (PDF). Elections BC. Retrieved January 28, 2021.
{{cite web}}: CS1 maint: url-status (link) - "Election Financing Reports". Elections BC. Retrieved September 13, 2020.
- "Statement of Votes - 40th Provincial General Election" (PDF). Elections BC. Retrieved May 17, 2017.
Другой контент может иметь иную лицензию. Перед использованием материалов сайта WikiSort.org внимательно изучите правила лицензирования конкретных элементов наполнения сайта.
WikiSort.org - проект по пересортировке и дополнению контента Википедии