world.wikisort.org - CanadaBurnaby North is a provincial electoral district for the Legislative Assembly of British Columbia, Canada.
Provincial electoral district in British Columbia, Canada
Burnaby North British Columbia electoral district British Columbia electoral district |
|---|
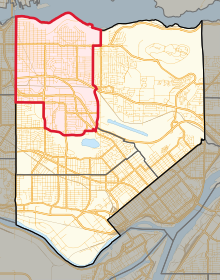 Location in Burnaby |
|
| Legislature | Legislative Assembly of British Columbia |
|---|
| MLA | Janet Routledge
New Democratic |
|---|
| District created | 1966 |
|---|
| First contested | 1966 |
|---|
| Last contested | 2020 |
|---|
|
| Population (2001) | 53,415 |
|---|
| Area (km²) | 22.94 |
|---|
| Pop. density (per km²) | 2,328.5 |
|---|
| Census division(s) | Metro Vancouver |
|---|
| Census subdivision(s) | Burnaby |
|---|
History
MLAs
| Assembly |
Years |
Member |
Party |
|---|
| 28th |
1966–1969 |
|
Eileen Dailly |
New Democratic |
| 29th |
1969–1972 |
| 30th |
1972–1975 |
| 31st |
1975–1979 |
| 32nd |
1979–1983 |
| 33rd |
1983–1986 |
| 34th |
1986–1991 |
Barry Jones |
| 35th |
1991–1996 |
| 36th |
1996–2001 |
Pietro Calendino |
| 37th |
2001–2005 |
|
Richard T. Lee |
Liberal |
| 38th |
2005–2009 |
| 39th |
2009–2013 |
| 40th |
2013–2017 |
| 41st |
2017–2020 |
|
Janet Routledge |
New Democratic |
| 42nd |
2020−present |
Election results
| 2020 British Columbia general election |
| Party |
Candidate |
Votes | % | | Expenditures |
|
New Democratic | Janet Routledge | 12,894 | 57.80 | +9.23 | $41,933.88 |
|
Liberal | Raymond Dong | 6,846 | 30.69 | −8.73 | $20,148.25 |
|
Green | Norine Shim | 2,568 | 11.51 | −0.50 | $3,015.12 |
| Total valid votes |
22,308 | 100.00 | – |
| Total rejected ballots |
| | |
| Turnout |
| | |
| Registered voters |
|
| Source: Elections BC[1] |
| 2017 British Columbia general election |
| Party |
Candidate |
Votes | % | | Expenditures |
|
New Democratic | Janet Routledge | 11,448 | 48.57 | +1.75 | $53,926.39 |
|
Liberal | Richard Lee | 9,290 | 39.42 | −4.43 | $62,342.21 |
|
Green | Peter Hallschmid | 2,831 | 12.01 | +5.01 | $1,106.54 |
| Total valid votes |
23,569 | 100.00 | – |
| Total rejected ballots |
171 | 0.72 | −0.03 |
| Turnout |
23,740 | 60.39 | +5.36 |
| Registered voters |
39,312 |
| Source: Elections BC[2][3] |
| 2013 British Columbia general election |
| Party |
Candidate |
Votes | % |
|
Liberal | Richard Lee | 10,543 | 46.82 |
|
New Democratic | Janet Routledge | 9,875 | 43.85 |
|
Green | Carrie McLaren | 1,577 | 7.00 |
|
No Affiliation | Wayne Michael Marklund | 523 | 2.32 |
| Total valid votes |
22,518 | 100.00 |
| Total rejected ballots |
170 | 0.75 |
| Turnout |
22,688 | 55.03 |
| Source: Elections BC[4] |
B.C. General Election 2009 Burnaby North
| Party |
Candidate |
Votes |
% |
± |
Expenditures |
|
Liberal | Richard Lee | 9,880 | 48.19% | | $106,301 |
|
New Democratic | Mondee Redman | 9,332 | 45.51% | | $69,538 |
|
Green | Doug Perry | 1,292 | 6.30% | – | $1,889 |
| Total valid votes |
20,504 | 100% |
| Total rejected ballots |
178 | 0.86% |
| Turnout |
20,682 | 53.85% |
| 2005 British Columbia general election |
| Party |
Candidate |
Votes | % |
|
Liberal | Richard T. Lee | 10,421 | 45.59 |
|
New Democratic | Pietro Calendino | 10,356 | 45.31 |
|
Green | Richard Brand | 1,763 | 7.71 |
|
Democratic Reform | Matthew Laird | 316 | 1.38 |
| Total valid votes |
22,856 | 100.00 |
| Total rejected ballots |
155 | 0.68 |
| Turnout |
23,011 | 59.76 |
B.C. General Election 2001: Burnaby North
| Party |
Candidate |
Votes |
% |
± |
Expenditures |
|
Liberal | Richard T. Lee | 11,062 | 54.37% | | $38,089 |
| |
NDP |
Pietro Calendino |
5,992 |
29.45% |
|
$32,684 |
|
Green | Tom Hetherington | 2,824 | 13.88% | – | $2,732 |
|
Marijuana | Dale Ware | 466 | 2.30% | | $394 |
| Total valid votes |
20,344 | 100.00% |
| Total rejected ballots |
102 | 0.50% |
| Turnout |
20,446 | 71.52% |
B.C. General Election 1996: Burnaby North
| Party |
Candidate |
Votes |
% |
± |
Expenditures |
| |
NDP |
Pietro Calendino |
8,926 |
45.47% |
|
$43,634 |
|
Liberal | Richard T. Lee | 8,160 | 41.57% | | $42,888 |
|
Reform | Daniela Bosa | 1,081 | 5.51% | | |
|
Progressive Democrat | Richard A.Y. Lee | 976 | 4.97% | – | $1,099 |
|
Green | Tom Hetherington | 395 | 2.01% | – | $930 |
| |
Natural Law |
Derek Nadeau |
62 |
0.32% |
|
$122 |
|
Libertarian | Carlo Nigro | 31 | 0.16% | | $100 |
| Total valid votes |
19,631 | 100.00% |
| Total rejected ballots |
180 | 0.91% |
| Turnout |
19,811 | 72.70% |
B.C. General Election 1991: Burnaby North
| Party |
Candidate |
Votes |
% |
± |
Expenditures |
| |
NDP |
Barry Jones |
9,809 |
48.43% |
|
$28,085 |
|
Liberal | Gaetan C. Myre | 6,337 | 31.29% | | $1,895 |
|
Social Credit | Margaret Woods | 3,833 | 18.92% | – | $31,779 |
|
Green | Jeani P. Lytle | 194 | 0.96% | – | $711 |
|
Libertarian | Carlo Nigro | 81 | 0.40% |
| Total valid votes |
20,254 | 100.00% |
| Total rejected ballots |
449 | 2.17% |
| Turnout |
20,703 | 75.24% |
References
External links
British Columbia provincial electoral districts (2017–present) |
|---|
| North/Central | |
|---|
| Southern Interior |
- Boundary-Similkameen
- Columbia River-Revelstoke
- Kamloops-North Thompson
- Kamloops-South Thompson
- Kelowna-Lake Country
- Kelowna-Mission
- Kelowna West
- Kootenay East
- Kootenay West
- Fraser-Nicola
- Nelson-Creston
- Penticton
- Shuswap
- Vernon-Monashee
|
|---|
| Fraser Valley / South LM | |
|---|
| Vancouver / North LM | |
|---|
| Vancouver Island | |
|---|
| See also: |
- 2015 British Columbia electoral redistribution
- List of British Columbia general elections
- 2017 general election
 Defunct districts Defunct districts
|
|---|
Текст в блоке "Читать" взят с сайта "Википедия" и доступен по лицензии Creative Commons Attribution-ShareAlike; в отдельных случаях могут действовать дополнительные условия.
Другой контент может иметь иную лицензию. Перед использованием материалов сайта WikiSort.org внимательно изучите правила лицензирования конкретных элементов наполнения сайта.
2019-2026
WikiSort.org - проект по пересортировке и дополнению контента Википедии
