world.wikisort.org - CanadaNunavut is a federal electoral district in Nunavut, Canada, that has been represented in the House of Commons of Canada since 1979. Before 1997, it was known as Nunatsiaq, and was one of two electoral districts in Northwest Territories.
Federal electoral district in Nunavut, Canada
Nunavut Nunavut electoral district Nunavut electoral district |
|---|
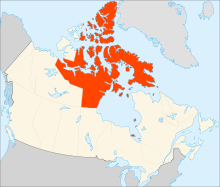 Nunavut riding in relation to Canada |
|
| Legislature | House of Commons |
|---|
| MP | Lori Idlout
New Democratic |
|---|
| District created | 1976 |
|---|
| First contested | 1979 |
|---|
| Last contested | 2021 |
|---|
| District webpage | profile, map |
|---|
|
| Population (2016)[1] | 35,944 |
|---|
| Electors (2015) | 18,124 |
|---|
| Area (km²)[2] | 1,877,787.62 |
|---|
| Pop. density (per km²) | 0.02 |
|---|
| Census division(s) | Kitikmeot Region, Keewatin Region, Baffin Region |
|---|
| Census subdivision(s) | Iqaluit, Rankin Inlet, Arviat, Baker Lake, Igloolik, Cambridge Bay, Pond Inlet, Pangnirtung, Kinngait, Kugluktuk |
|---|
The riding covers the entire territory of Nunavut. It is the largest federal electoral district by land area in Canada,[3] and since the abolition of the Division of Kalgoorlie in Western Australia, it is the second largest electoral district in the world after Yakutsk in Russia and the largest one represented by a single legislator.[4]
Demographics
- According to the Canada 2011 Census; 2013 representation[5][6]
- Ethnic groups: 86.3% Indigenous, 12.1% White
- Languages: 66.8% Inuktitut, 29.1% English, 1.4% French
- Religions: 86.0% Christian (50.3% Anglican, 23.9% Catholic, 4.9% Pentecostal, 6.8% Other), 12.9% No religion
- Median income (2010): $25,662
- Average income (2010): $43,505
The Nunavut riding holds a host of demographic records:
- Lowest median age:[7] 24.1 years
- Highest percentage of Indigenous peoples:[8] 85.0%
- Highest percentage of Inuit: 84.0%
- Highest percentage of a non-official language as mother tongue:[9] 69.4%
- Highest percentage of an Indigenous language as mother tongue: 68.0%
- Highest percentage of Inuktitut as mother tongue: 66.8%
- Highest percentage of an Indigenous language as home language:[10] 53.0%
- Highest percentage of Inuktitut as home language: 51.9%
- According to the Canada 2016 Census
- Most common mother tongue languages (2016) : 63.1% Inuktitut, 31.5% English, 1.7% French, 1.4% Inuinnaqtun, 0.4% Tagalog, 0.1% Spanish, 0.1% Arabic, 0.1% German[11]
History
The riding was created in 1976 as "Nunatsiaq" from parts of the Northwest Territories riding. It was renamed "Nunavut" in 1996.
In 1999, the district's boundaries were redefined in the Nunavut Act, the law governing the creation of Nunavut as a separate jurisdiction from the Northwest Territories.
The boundaries of this riding were not changed in the 2012 electoral redistribution.
Riding associations
Riding associations are the local branches of political parties:
| Party |
Association name |
CEO |
HQ address |
HQ city |
|
Conservative |
Conservative Party of Canada Nunavut Electoral District Association |
Julie-Anne Miller |
Post Office Box 1841 |
Iqaluit |
|
Liberal |
Nunavut Federal Liberal Association |
Michel Potvin |
Post Office Box 714 |
Iqaluit |
|
New Democratic |
Nunavut New Democratic Party Electoral District Association |
Bethany Scott |
Post Office Box 11380 |
Iqaluit |
Members of Parliament
This riding has elected the following Members of Parliament:
| Parliament |
Years |
Member |
Party |
Nunatsiaq
Riding created from Northwest Territories |
| 31st |
1979–1980 | | Peter Ittinuar | New Democratic |
| 32nd |
1980–1982 |
| 1982–1984 | | Liberal |
| 1984–1984 | | Independent |
| 33rd |
1984–1988 | | Thomas Suluk | Progressive Conservative |
| 34th |
1988–1993 | | Jack Anawak | Liberal |
| 35th |
1993–1997 |
| Nunavut |
| 36th |
1997–2000 | | Nancy Karetak-Lindell | Liberal |
| 37th |
2000–2004 |
| 38th |
2004–2006 |
| 39th |
2006–2008 |
| 40th |
2008–2011 | | Leona Aglukkaq | Conservative |
| 41st |
2011–2015 |
| 42nd |
2015–2016 | | Hunter Tootoo | Liberal |
| 2016–2019 | | Independent |
| 43rd |
2019–2021 | | Mumilaaq Qaqqaq | New Democratic |
| 44th |
2021–present | Lori Idlout |
Election results
Graph of election results in Nunavut/Nunatsiaq (parties that never received 2% of the vote are omitted)
Nunavut
| 2021 Canadian federal election |
| Party |
Candidate |
Votes | % | | Expenditures |
|
New Democratic | Lori Idlout | 3,427 | 47.7 | +6.9 | |
|
Liberal | Pat Angnakak | 2,578 | 35.9 | +5.0 | |
|
Conservative | Laura Mackenzie | 1,184 | 16.5 | -9.6 | |
| Total valid votes |
7,189 | 98.93 |
| Total rejected ballots |
78 | 1.07 | -0.15 |
| Turnout |
7,267 | 34.1 | -17.0 |
|
New Democratic hold |
Swing |
+1.0 |
| Source: Elections Canada[12] |
| 2019 Canadian federal election |
| Party |
Candidate |
Votes | % | | Expenditures |
|
New Democratic | Mumilaaq Qaqqaq | 3,861 | 40.8 | +14.2 | $5,618.37 |
|
Liberal | Megan Pizzo Lyall | 2,918 | 30.9 | -16.2 | $41,679.84 |
|
Conservative | Leona Aglukkaq | 2,469 | 26.1 | +1.3 | $88,289.32 |
|
Green | Douglas Roy | 206 | 2.2 | +0.7 | $0.00 |
| Total valid votes/expense limit |
9,454 | 100.0 |
| Total rejected ballots |
88 |
| Turnout |
9,542 | 51.1 |
| Eligible voters |
18,665 |
|
New Democratic gain from Liberal |
Swing |
+15.35 |
| Source: Elections Canada[13][14] |
| 2015 Canadian federal election |
| Party |
Candidate |
Votes | % | | Expenditures |
|
Liberal | Hunter Tootoo | 5,619 | 47.11 | +18.41 | $32,110.96 |
|
New Democratic | Jack Iyerak Anawak | 3,171 | 26.58 | +7.22 | – |
|
Conservative | Leona Aglukkaq | 2,956 | 24.78 | -25.12 | $36,393.17 |
|
Green | Spencer Rocchi | 182 | 1.53 | -0.51 | – |
| Total valid votes/expense limit |
11,928 | 100.00 | | $203,887.65 |
| Total rejected ballots |
95 | 0.79 | – |
| Turnout |
12,203 | 62.54 | – |
| Eligible voters |
19,223 |
|
Liberal gain from Conservative |
Swing |
+21.77 |
| Source: Elections Canada[15][16] |
| 2011 Canadian federal election |
| Party |
Candidate |
Votes | % | |
|
Conservative | Leona Aglukkaq | 3,930 | 49.85 | +15.07 |
|
Liberal | Paul Okalik | 2,260 | 28.62 | −0.38 |
|
New Democratic | Jack Hicks | 1,525 | 19.44 | −8.18 |
|
Green | Scott MacCallum | 160 | 2.1 | −6.27 |
| Total valid votes |
7,875 | 100.0 |
| Total rejected ballots |
56 | 0.71 |
| Turnout |
7,931 | 46.66 |
| Eligible voters |
16,998 |
|
Conservative hold |
Swing |
+7.73 |
| 2008 Canadian federal election |
| Party |
Candidate |
Votes | % | | Expenditures |
|
Conservative | Leona Aglukkaq | 2,806 | 34.78 | +5.72 | $59,574 |
|
Liberal | Kirt Ejesiak | 2,359 | 29.24 | −10.74 | $59,600 |
|
New Democratic | Paul Irngaut | 2,228 | 27.62 | +10.47 | $20,095 |
|
Green | Peter Ittinuar | 675 | 8.37 | +2.45 |
| Total valid votes/expense limit |
8,068 | 100.0 | | $80,098 |
|
Conservative gain from Liberal |
Swing |
+8.23 |
| 2006 Canadian federal election |
| Party |
Candidate |
Votes | % | | Expenditures |
|
Liberal | Nancy Karetak-Lindell | 3,673 | 39.98 | −11.32 | $10,669 |
|
Conservative | David Aglukark | 2,670 | 29.06 | +14.62 | $5,486 |
|
New Democratic | Bill Riddell | 1,576 | 17.15 | +1.98 | $11,990 |
|
Marijuana | D. Ed deVries | 724 | 7.88 | – | $1,162 |
|
Green | Feliks Kappi | 544 | 5.92 | +2.59 | $3,950 |
| Total valid votes/expense limit |
9,187 | 100.0 | | $74,506 |
| Total rejected ballots |
64 | 0.70 |
| Turnout |
9,251 | 54.10 |
|
Liberal hold |
Swing |
−12.97 |
| 2004 Canadian federal election |
| Party |
Candidate |
Votes | % | | Expenditures |
|
Liberal | Nancy Karetak-Lindell | 3,818 | 51.30 | −17.71 | $18,035 |
|
Independent | Manitok Thompson | 1,172 | 15.74 | – | $5,945 |
|
New Democratic | Bill Riddell | 1,129 | 15.17 | −3.09 | $12,810 |
|
Conservative | Duncan Cunningham | 1,075 | 14.44 | +6.24 | $16,838 |
|
Green | Nedd Kenney | 248 | 3.33 | −1.19 | $190 |
| Total valid votes |
7,442 | 100.00 |
| Total rejected ballots |
33 | 0.44 |
| Turnout |
7,475 | 43.86 |
|
Liberal hold |
Swing |
−16.72 |
| Change for the Conservatives is based on the results of the Progressive Conservatives. |
| 2000 Canadian federal election |
| Party |
Candidate |
Votes | % | | Expenditures |
|
Liberal | Nancy Karetak-Lindell | 5,327 | 69.01 | +23.13 | $35,282 |
|
New Democratic | Palluq Susan Enuaraq | 1,410 | 18.26 | −5.50 |
|
Progressive Conservative | Mike Sherman | 633 | 8.20 | −15.93 | $6,045 |
|
Green | Brian Robert Jones | 349 | 4.52 | – | $9,304 |
| Total valid votes |
7,719 | 100.00 |
| Total rejected ballots |
54 | 0.69 |
| Turnout |
7,773 | 54.10 |
|
Liberal hold |
Swing |
+14.32 |
| 1997 Canadian federal election |
| Party |
Candidate |
Votes | % | | Expenditures |
|
Liberal | Nancy Karetak-Lindell | 3,302 | 45.88 | −23.87 | $30,212 |
|
Progressive Conservative | Okalik Eegeesiak | 1,737 | 24.13 | +3.54 | $11,251 |
|
New Democratic | Hunter Tootoo | 1,710 | 23.76 | +14.10 | $11,918 |
|
Reform | John Turner | 447 | 6.21 | – | |
| Total valid votes |
7,196 | 100.00 |
| Total rejected ballots |
48 | 0.66 |
| Turnout |
7,244 | 59.80 |
|
Liberal notional hold |
Swing |
−13.70
|
Nunatsiaq
| 1993 Canadian federal election |
| Party |
Candidate |
Votes | % | |
|
Liberal | Jack Iyerak Anawak | 6,685 | 69.79 | +29.85 |
|
Progressive Conservative | Leena Evic-Twerdin | 1,970 | 20.57 | −2.37 |
|
New Democratic | Mike Illnik | 924 | 9.65 | −23.51 |
| Total valid votes |
9,579 | 100.00 |
|
Liberal hold |
Swing |
+16.11 |
| 1988 Canadian federal election |
| Party |
Candidate |
Votes | % | |
|
Liberal | Jack Iyerak Anawak | 3,356 | 39.94 | +11.04 |
|
New Democratic | Peter Kusugak | 2,786 | 33.15 | +4.50 |
|
Progressive Conservative | Sedluk Bryan Pearson | 1,928 | 22.94 | −28.52 |
|
Independent | Richard Inukpak Lee | 333 | 3.96 | – |
| Total valid votes |
8,403 | 100.00 |
|
Liberal gain from Progressive Conservative |
Swing |
+3.27 |
| 1984 Canadian federal election |
| Party |
Candidate |
Votes | % | |
|
Progressive Conservative | Thomas Suluk | 2,237 | 32.49 | +24.71 |
|
Liberal | Robert Kuptana | 1,990 | 28.90 | −12.90 |
|
New Democratic | Rhoda Innuksuk | 1,973 | 28.65 | −18.61 |
|
Independent | Peter Ittinuar | 686 | 9.96 | – |
| Total valid votes |
6,886 | 100.00 |
|
Progressive Conservative gain from New Democratic |
Swing |
+18.80 |
| Independent candidate Peter Ittinuar lost 37.31 percentage points from the 1980 election, when he ran as a New Democrat. |
| 1980 Canadian federal election |
| Party |
Candidate |
Votes | % | |
|
New Democratic | Peter Ittinuar | 2,688 | 47.27 | +10.99 |
|
Liberal | James Arvaluk | 2,377 | 41.80 | +15.81 |
|
Progressive Conservative | Lyle Stevenson | 442 | 7.77 | −18.22 |
|
Rhinoceros | Lloyd Ellsworth | 180 | 3.17 | – |
| Total valid votes |
5,687 | 100.00 |
|
New Democratic hold |
Swing |
−2.41 |
| 1979 Canadian federal election |
| Party |
Candidate |
Votes | % |
|
New Democratic | Peter Ittinuar | 1,963 | 37.74 |
|
Liberal | Tagak Curley | 1,887 | 36.27 |
|
Progressive Conservative | Abe Okpik | 1,352 | 25.99 |
| Total valid votes |
5,202 | 100.00 |
| This riding was created from part of Northwest Territories, where New Democrat Wally Firth was the incumbent. |
See also
- List of Canadian federal electoral districts
- Past Canadian electoral districts
References
Notes
- Statistics Canada: 2011
- Statistics Canada: 2011
- Madeline Redfern on Nunavut's electoral riding, largest in Canada, CBC, October 8, 2015
- Durack: the electorate bigger than many countries still finds it hard to get noticed, The Guardian, 14 May 2016
- "2011 National Household Survey Profile - Federal electoral district (2013 Representation Order)". May 8, 2013.
- "2011 National Household Survey Profile - Federal electoral district (2013 Representation Order)". May 8, 2013.
- "Age (131) and Sex (3) for the Population of Canada, Provinces, Territories and Federal Electoral Districts (2003 Representation Order), 2011 Census". www2.statcan.gc.ca. Retrieved November 19, 2012.
- "Aboriginal Identity (8), Sex (3) and Age Groups (12) for the Population of Canada, Provinces, Territories and Federal Electoral Districts (2003 Representation Order), 2006 Census - 20% Sample Data". 2.statcan.gc.ca. Retrieved November 19, 2012.
- "2011 Census of Canada: Topic-based tabulations | Detailed Mother Tongue (232), Knowledge of Official Languages (5), Age Groups (17A) and Sex (3) for the Population Excluding Institutional Residents of Canada, Provinces, Territories and Federal Electoral Districts (2003 Representation Order), 2011 Census". 2.statcan.gc.ca. October 24, 2012. Retrieved November 19, 2012.
- "First Official Language Spoken (7), Detailed Language Spoken Most Often at Home (232), Age Groups (17A) and Sex (3) for the Population Excluding Institutional Residents of Canada, Provinces, Territories and Federal Electoral Districts (2003 Representation Order), 2011 Census". 2.statcan.gc.ca. Retrieved November 19, 2012.
- "Mother Tongue (269), Knowledge of Official Languages (5), Age (15A) and Sex (3) for the Population Excluding Institutional Residents of Canada, Provinces and Territories and Federal Electoral Districts (2013 Representation Order), 2016 Census - 100% Data". August 2, 2017.
- "Election Night Results". Elections Canada. Retrieved October 28, 2021.
- "List of confirmed candidates". Elections Canada. Retrieved October 4, 2019.
- "Election Night Results". Elections Canada. Retrieved November 9, 2019.
- Elections Canada – Confirmed candidates for Nunavut, 30 September 2015
- Elections Canada – Final Candidates Election Expenses Limits
External links
Federal ridings in the territories of Canada |
|---|
| Liberal | | |
|---|
| New Democratic | |
|---|
|
|---|
| Regions | |
|---|
| Electoral districts | |
|---|
| Communities | |
|---|
Weather stations and
Canadian Armed Forces bases | |
|---|
| Mine sites | | Operating |
- Baffinland Iron Mine
- Doris North
- Meadowbank Gold Mine
|
|---|
| Defunct | Bent Horn Mine
- Cullaton Lake/Shear Lake Mine
- Jericho Diamond Mine
- Lupin Mine
- Nanisivik Mine
- Polaris mine
- Rankin Inlet Mine
|
|---|
|
|---|
| DEW line and NWS sites | |
|---|
| Former | |
|---|
Hudson's Bay Company
trading posts | |
|---|
Текст в блоке "Читать" взят с сайта "Википедия" и доступен по лицензии Creative Commons Attribution-ShareAlike; в отдельных случаях могут действовать дополнительные условия.
Другой контент может иметь иную лицензию. Перед использованием материалов сайта WikiSort.org внимательно изучите правила лицензирования конкретных элементов наполнения сайта.
2019-2025
WikiSort.org - проект по пересортировке и дополнению контента Википедии

