world.wikisort.org - Canada
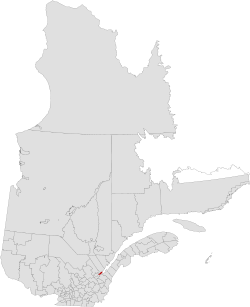
L'Île-d'Orléans is a regional county municipality in central Quebec, Canada, in the Capitale-Nationale region. Its seat is Sainte-Famille-de-l'Île-d'Orléans. The population in the 2016 census was 7,082 people.[3]
L'Île-d'Orléans | |
|---|---|
Regional county municipality | |
 | |
| Coordinates: 46°55′N 70°54′W[1] | |
| Country | Canada |
| Province | Quebec |
| Region | Capitale-Nationale |
| Effective | January 1, 1982 |
| County seat | Sainte-Famille-de-l'Île-d'Orléans |
| Government | |
| • Type | Prefecture |
| • Prefect | Jean-Pierre Turcotte |
| Area | |
| • Total | 268.50 km2 (103.67 sq mi) |
| • Land | 192.85 km2 (74.46 sq mi) |
| Population (2016)[3] | |
| • Total | 7,082 |
| • Density | 36.7/km2 (95/sq mi) |
| • Change 2011-2016 | |
| • Dwellings | 3,703 |
| Time zone | UTC−5 (EST) |
| • Summer (DST) | UTC−4 (EDT) |
| Area code(s) | 418 and 581 |
| Website | mrc |
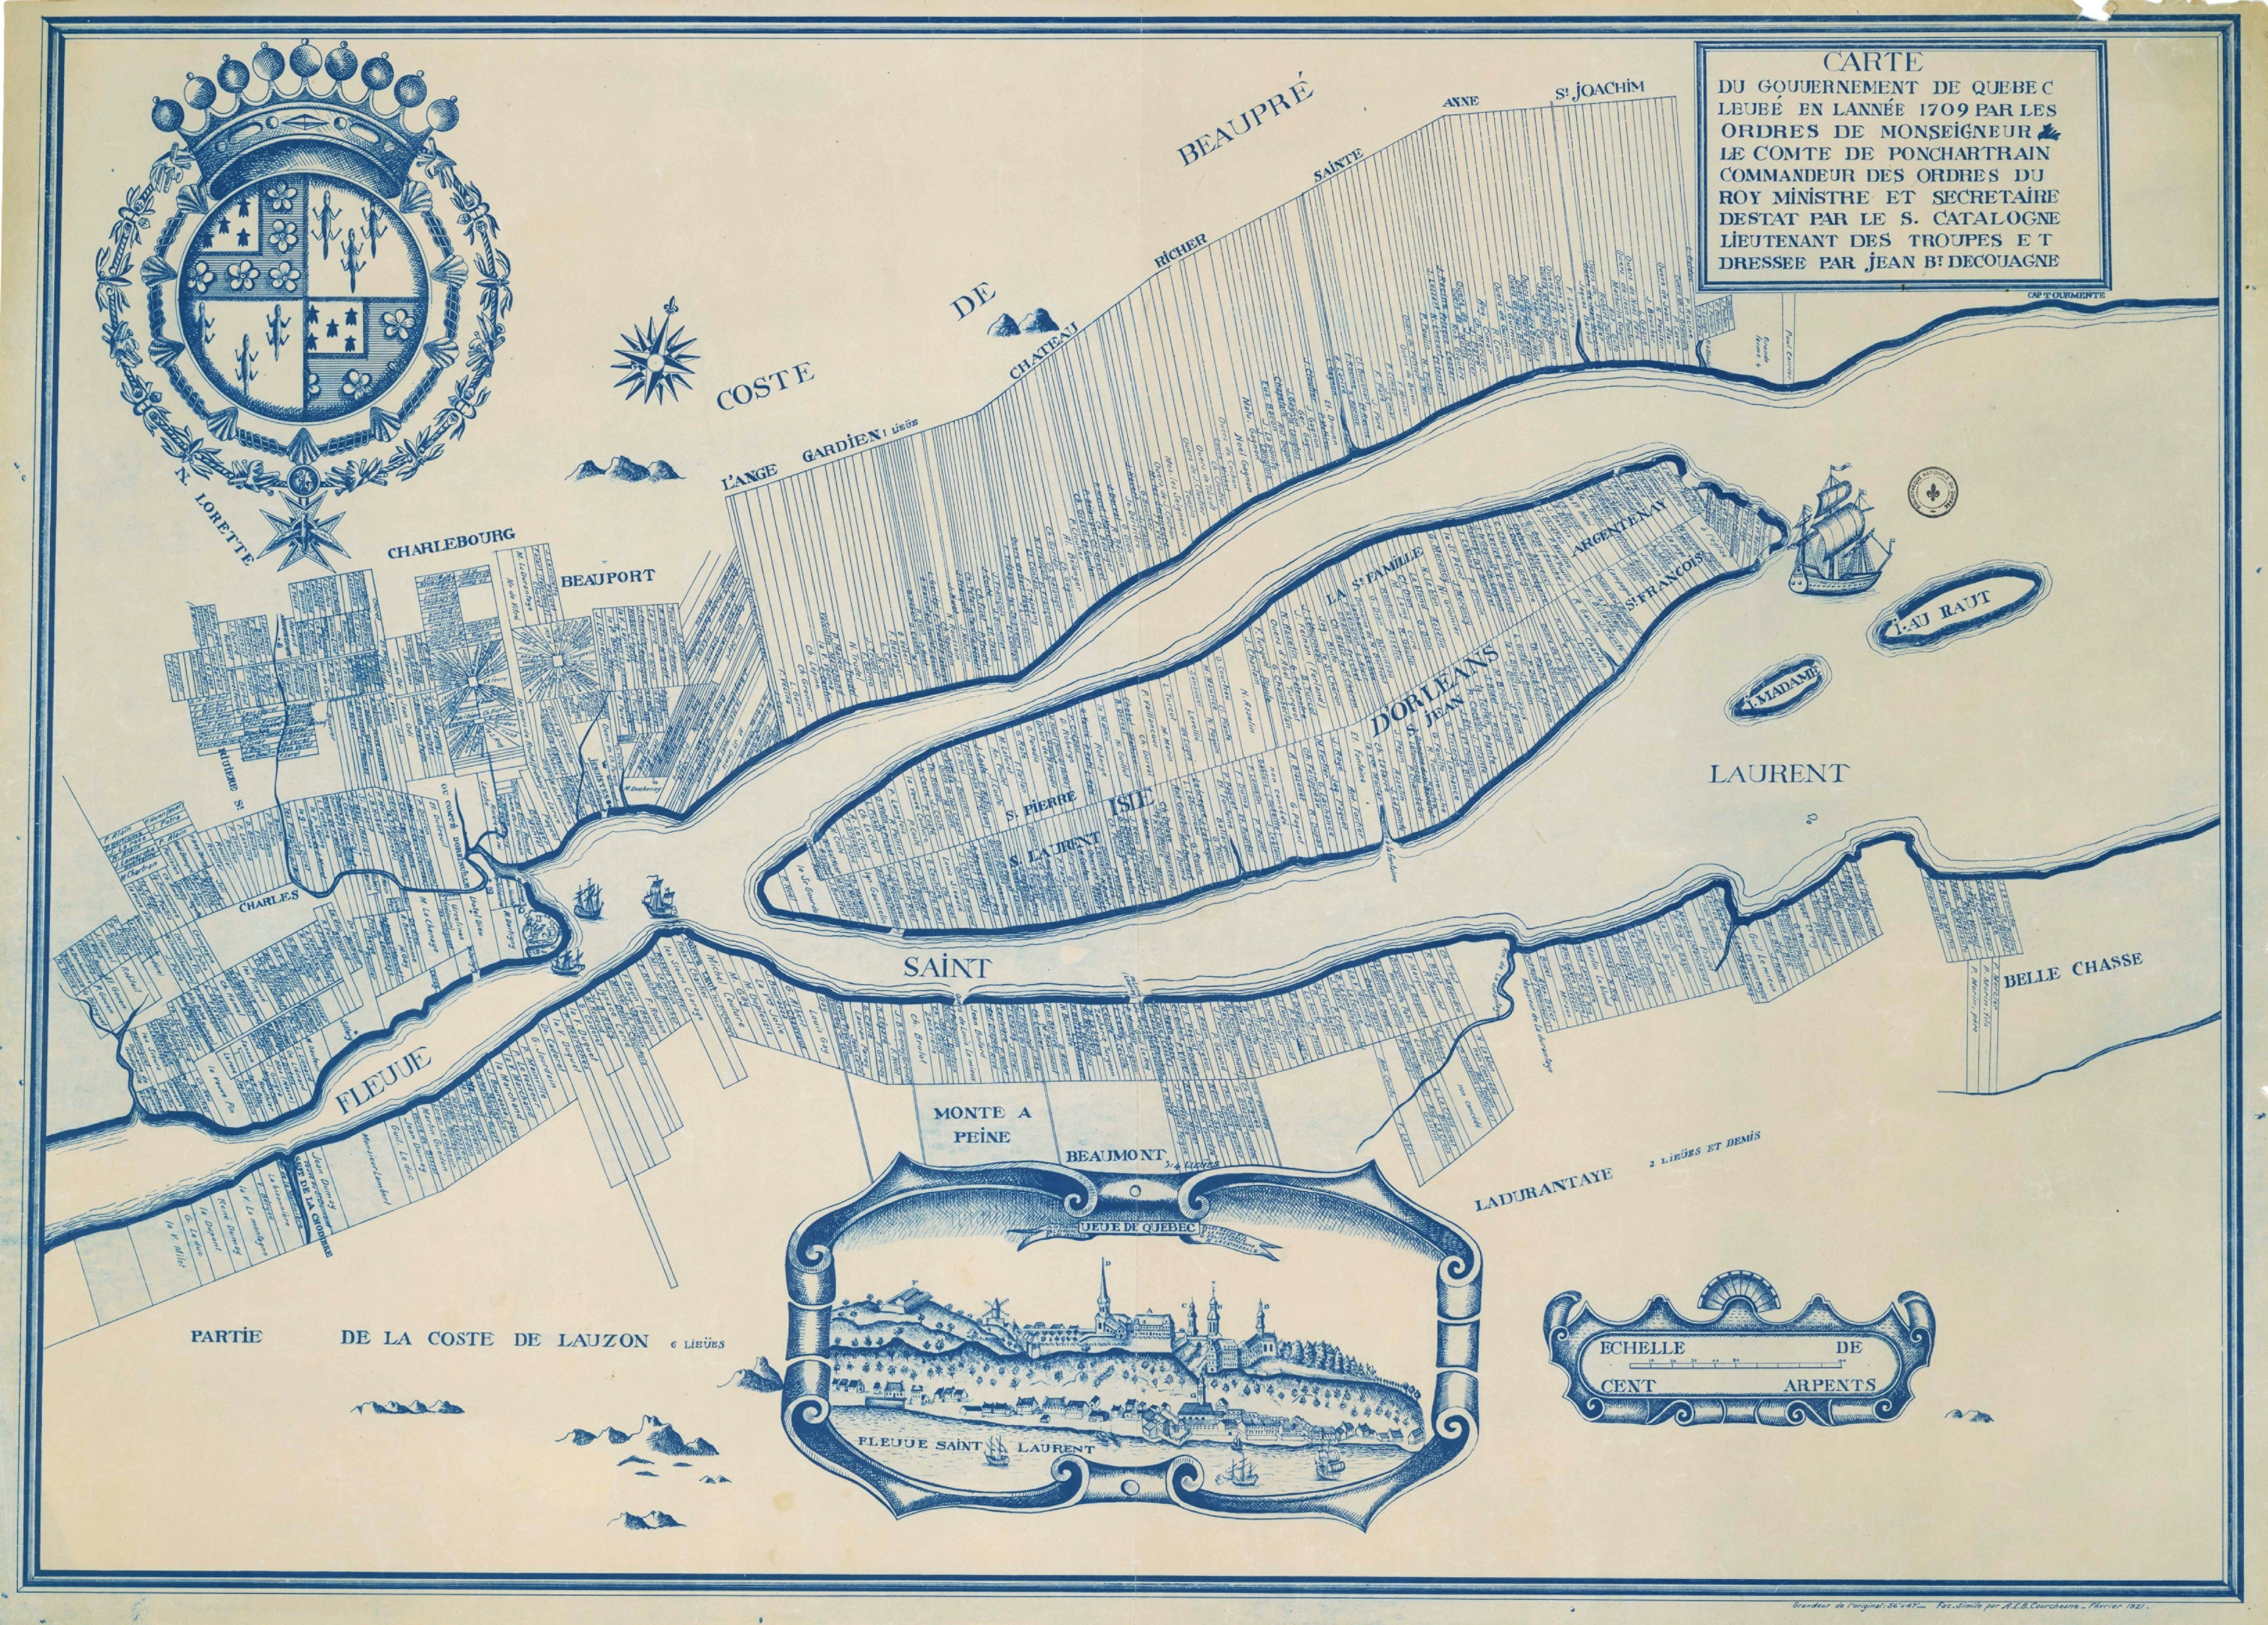
The RCM consists solely of the Île d'Orléans, an island in the Saint Lawrence River just east of Quebec City. It is the smallest RCM in Quebec in terms of land area (though not in total area including water).
Subdivisions
There are 6 subdivisions within the RCM:[2]
|
|
Demographics
Population
Canada census – L'Île-d'Orléans Regional County Municipality, Quebec community profile
| 2021 | 2016 | 2011 | |
|---|---|---|---|
| Population | 6,817 (-3.7% from 2016) | 7,082 (+5.5% from 2011) | 6,711 (-2.2% from 2006) |
| Land area | 194.58 km2 (75.13 sq mi) | 192.85 km2 (74.46 sq mi) | 192.81 km2 (74.44 sq mi) |
| Population density | 35/km2 (91/sq mi) | 36.7/km2 (95/sq mi) | 34.8/km2 (90/sq mi) |
| Median age | 53.6 (M: 54.4, F: 52.8) | 52.0 (M: 52.3, F: 51.7) | 49.7 (M: 49.8, F: 49.5) |
| Total private dwellings | 3,035 | 3,703 | 3,470 |
| Median household income | $77,568 | $64,483 |
|
| ||||||||||||||||||||||||
| Source: Statistics Canada[9][3] | |||||||||||||||||||||||||
Language
| Canada Census Mother Tongue - L'Île-d'Orléans Regional County Municipality, Quebec[9][3] | ||||||||||||||||||
|---|---|---|---|---|---|---|---|---|---|---|---|---|---|---|---|---|---|---|
| Census | Total | French |
English |
French & English |
Other | |||||||||||||
| Year | Responses | Count | Trend | Pop % | Count | Trend | Pop % | Count | Trend | Pop % | Count | Trend | Pop % | |||||
2016 |
7,020 |
6,860 | 97.72% | 70 | 1.07% | 15 | 0.21% | 75 | 1.07% | |||||||||
2011 |
6,610 |
6,480 | 98.03% | 75 | 1.13% | 10 | 0.15% | 45 | 0.68% | |||||||||
2006 |
6,780 |
6,540 | 96.46% | 80 | 1.18% | 55 | 0.81% | 105 | 1.55% | |||||||||
2001 |
6,705 |
6,645 | 99.11% | 25 | 0.37% | 20 | 0.30% | 15 | 0.22% | |||||||||
1996 |
6,780 |
6,695 | n/a | 98.75% | 40 | n/a | 0.59% | 20 | n/a | 0.29% | 25 | n/a | 0.37% | |||||
Transportation
Access Routes
Highways and numbered routes that run through the municipality, including external routes that start or finish at the county border:[10]
|
|
|
|
See also
- List of regional county municipalities and equivalent territories in Quebec
References
- "Reference number 141064 in Banque de noms de lieux du Québec". toponymie.gouv.qc.ca (in French). Commission de toponymie du Québec.
- "Geographic code 200 in the official Répertoire des municipalités". www.mamh.gouv.qc.ca (in French). Ministère des Affaires municipales et de l'Habitation.
- "Census Profile, 2016 Census: L'Île-d'Orléans, Municipalité régionale de comté [Census division], Quebec". Statistics Canada. Retrieved December 12, 2019.
- "2021 Community Profiles". 2021 Canadian Census. Statistics Canada. February 4, 2022. Retrieved 2022-04-27.
- "2016 Community Profiles". 2016 Canadian Census. Statistics Canada. August 12, 2021. Retrieved 2019-12-12.
- "2011 Community Profiles". 2011 Canadian Census. Statistics Canada. March 21, 2019. Retrieved 2014-04-18.
- "2006 Community Profiles". 2006 Canadian Census. Statistics Canada. August 20, 2019.
- "2001 Community Profiles". 2001 Canadian Census. Statistics Canada. July 18, 2021.
- 1996, 2001, 2006, 2011 census
- Official Transport Quebec Road Map
External links
Wikimedia Commons has media related to L'Île-d'Orléans Regional County Municipality.
Adjacent Counties & Equivalent Territories | ||||||||||||||||
|---|---|---|---|---|---|---|---|---|---|---|---|---|---|---|---|---|
| ||||||||||||||||
| Regional county municipalities and equivalent territories |
|
|---|---|
| Municipalities |
|
Administrative divisions of Quebec | |
| Authority control |
|
|---|
Текст в блоке "Читать" взят с сайта "Википедия" и доступен по лицензии Creative Commons Attribution-ShareAlike; в отдельных случаях могут действовать дополнительные условия.
Другой контент может иметь иную лицензию. Перед использованием материалов сайта WikiSort.org внимательно изучите правила лицензирования конкретных элементов наполнения сайта.
Другой контент может иметь иную лицензию. Перед использованием материалов сайта WikiSort.org внимательно изучите правила лицензирования конкретных элементов наполнения сайта.
2019-2026
WikiSort.org - проект по пересортировке и дополнению контента Википедии
WikiSort.org - проект по пересортировке и дополнению контента Википедии