world.wikisort.org - Canada
Kildonan was a provincial electoral division in the Canadian province of Manitoba. The boundaries for the riding maintained their location through the 2008 redistribution.
 | |
| Defunct provincial electoral district | |
| Legislature | Legislative Assembly of Manitoba |
| District created | 1957 |
| First contested | 1958 |
| Last contested | 2016 |
History
Kildonan riding (1870–1899)
The original Kildonan riding was created at the time of the province's establishment in 1870. It was dominated by Manitoba's "old settler" population (i.e., English-speaking families who had lived in the Red River Settlement for many years before the province's creation). There was a large "mixed blood" aboriginal population in the riding, and many of its residents were also of Scottish or partly Scottish ancestry. From 1886 to 1888, the riding was incorporated into "Kildonan and St. Paul" riding.
Kildonan was a hotly contested riding between the Conservatives and Liberals following the establishment of party government in 1888. In 1899, it was dissolved into the riding of "Kildonan and St. Andrews".
Kildonan and St. Andrews riding (1920–1927)
From 1920 to 1927, the Kildonan and St. Andrews riding was represented by Labour Member of the Legislative Assembly (MLA) Charles Tanner. Otherwise, it continued to return Liberals and Conservatives until being merged into "Kildonan-Transcona" in 1949. After that time, it was generally considered a safe riding for the Co-operative Commonwealth Federation.
Kildonan riding (1958–2019)
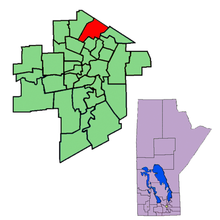
A riding with the name Kildonan was reestablished in 1957, and formally came into being in the provincial election of 1958. It was located in the northeastern part of the current City of Winnipeg, The Kildonan riding that existed from the 1958 election up to the election of 1981 was located in the East Kildonan area on the east side of the Red River. The riding of Kildonan that existed since 1981 in northwest Winnipeg had completely different boundaries from the old Kildonan riding as this new Kildonan riding was carved out of the old Seven Oaks riding on the west side of the Red River. This new riding was bordered on the east by River East and Rossmere, to the south by St. Johns and Burrows, to the north by Gimli, and to the west by The Maples.
The riding's population in 1996 was 19,522. In 1999, the average family income was $54381, and the unemployment rate was 6.80%. Almost 18% of the population was above 65 years of age by 2016. Kildonan had a large immigrant population (23% of the total population in 1999), and was ethnically diverse. Ukrainians made up 14% of the riding's population; a further 11% were Jewish, 7% Polish, and 3% Italian. Kildonan's residents were primarily middle and upper-income. Manufacturing accounted for 16% of industry in the riding, with a further 15% in the service sector.
The seat was generally regarded as safe for the New Democratic Party. The Progressive Conservatives won the former Kildonan on the (east side of the Red River) in 1962 (by 4 votes in the 1962 election) and the Liberals won the Kildonan riding on the (west side of the Red River) in 1988. In both cases, the NDP recaptured the seat after a single term.
Beginning with the 2019 Manitoba general election, the Kildonan riding was dissolved and much of its constituency was redistributed to the new riding of Kildonan-River East, which also took in parts of St. Johns and the now-defunct River East riding. Kildonan's last MLA was Nic Curry, a young former officer in the Canadian Armed Forces Reserve.
Members of the Legislative Assembly
Kildonan riding (1870–1899)
| Name | Party | Took Office | Left Office |
|---|---|---|---|
| John Sutherland | Opposition/Canadian Party | 1870 | 1874 |
| vacant | 1874 | 1875 | |
| John Sutherland | Opposition | 1875 | 1878 |
| Alexander Sutherland | Opposition | 1878 | 1879 |
| Government/Liberal-Conservative | 1879 | 1884 | |
| John MacBeth(+) | Government/Conservative | 1884 | 1888 |
| John Norquay | Conservative | 1888 | 1889 |
| Thomas Norquay | Conservative | 1890 | 1892 |
| John James Bird | Liberal | 1892 | 1896 |
| Hector Sutherland | Conservative | 1896 | 1899 |
(+) From 1886 to 1888, the riding was incorporated into Kildonan and St. Paul.
Kildonan and St. Andrews riding (1920–1927)
| Name | Party | Took Office | Left Office |
|---|---|---|---|
| Orton Grain | Liberal-Conservative | 1899 | 1903 |
| M.J. O'Donahoe | Liberal | 1903 | 1907 |
| Orton Grain | Conservative | 1907 | 1913 |
| Walter Montague | Conservative | 1913 | 1915 |
| George Prout | Liberal | 1915 | 1920 |
| Charles Tanner | Dominion Labour | 1920 | 1920 |
| Independent Labour Party | 1920 | 1927 | |
| James McLenaghen | Conservative/Progressive Conservative | 1927 | 1949 |
Kildonan-Transcona riding (1949–1958)
| Name | Party | Took Office | Left Office |
|---|---|---|---|
| George Olive | Co-operative Commonwealth | 1949 | 1953 |
| Russell Paulley | Co-operative Commonwealth | 1953 | 1958 |
Kildonan riding (1961-2019)
| Name | Party | Took Office | Left Office |
|---|---|---|---|
| A.J. Reid | Co-operative Commonwealth | 1958 | 1961 |
| New Democrat | 1961 | 1962 | |
| James Mills | Progressive Conservative | 1962 | 1966 |
| Peter Fox | New Democrat | 1966 | 1981 |
| Mary Beth DolinNew Kildonan Riding- completely different boundaries | New Democrat | 1981 | 1985 |
| Marty Dolin | New Democrat | 1985 | 1988 |
| Gulzar Singh Cheema | Liberal | 1988 | 1990 |
| David Chomiak | New Democrat | 1990 | 2016 |
| Nic Curry | Progressive Conservative | 2016 | 2019 |
Electoral results
1870 general election
| 1870 Manitoba general election | ||||||||
|---|---|---|---|---|---|---|---|---|
| Party | Candidate | Votes | % | |||||
| Opposition | John Sutherland | 38 | 55.07% | |||||
| Government | David Matheson | 31 | 44.93% | |||||
| Total | 69 | – | ||||||
| Eligible voters / Turnout | N/A | – | ||||||
| Rejected | N/A | – | ||||||
Source(s)
Source:Manitoba. Chief Electoral Officer (1999). Statement of Votes for the 37th Provincial General Election, September 21, 1999 (PDF) (Report). Winnipeg: Elections Manitoba. pp. 211–277. | ||||||||
1874 general election
| 1874 Manitoba general election | ||||||||
|---|---|---|---|---|---|---|---|---|
| Party | Candidate | Votes | % | ±% | ||||
| Opposition | John Sutherland | 49 | 50.00% | -5.07% | ||||
| Undeclared | John Fraser | 49 | 50.00% | – | ||||
| Total | 98 | – | – | |||||
| Eligible voters / Turnout | N/A | – | – | |||||
| Rejected | N/A | – | – | |||||
Source(s)
Source:Manitoba. Chief Electoral Officer (1999). Statement of Votes for the 37th Provincial General Election, September 21, 1999 (PDF) (Report). Winnipeg: Elections Manitoba. pp. 211–277. | ||||||||
1875 by-election
| Manitoba provincial by-election, 1875 | ||||||||
|---|---|---|---|---|---|---|---|---|
| Party | Candidate | Votes | % | ±% | ||||
| Unknown | John Sutherland | Acclaimed | – | – | ||||
| Total | – | – | ||||||
| Eligible voters / Turnout | N/A | – | – | |||||
| Rejected | N/A | – | – | |||||
Source(s)
Source:Manitoba. Chief Electoral Officer (1999). Statement of Votes for the 37th Provincial General Election, September 21, 1999 (PDF) (Report). Winnipeg: Elections Manitoba. pp. 211–277. | ||||||||
1878 general election
| 1878 Manitoba general election | ||||||||
|---|---|---|---|---|---|---|---|---|
| Party | Candidate | Votes | % | ±% | ||||
| Undeclared | Alexander Sutherland | 78 | 65.00% | – | ||||
| Undeclared | John Sutherland | 42 | 35.00% | – | ||||
| Total | 120 | – | – | |||||
| Eligible voters / Turnout | 151 | 79.47% | – | |||||
| Rejected | N/A | – | – | |||||
Source(s)
Source:Manitoba. Chief Electoral Officer (1999). Statement of Votes for the 37th Provincial General Election, September 21, 1999 (PDF) (Report). Winnipeg: Elections Manitoba. pp. 211–277. | ||||||||
1879 general election
| 1879 Manitoba general election | ||||||||
|---|---|---|---|---|---|---|---|---|
| Party | Candidate | Votes | % | ±% | ||||
| Government | Alexander Sutherland | 107 | 60.80% | -4.20% | ||||
| Undeclared | John Sutherland | 69 | 39.20% | 4.20% | ||||
| Total | 176 | – | – | |||||
| Eligible voters / Turnout | N/A | – | – | |||||
| Rejected | N/A | – | – | |||||
Source(s)
Source:Manitoba. Chief Electoral Officer (1999). Statement of Votes for the 37th Provincial General Election, September 21, 1999 (PDF) (Report). Winnipeg: Elections Manitoba. pp. 211–277. | ||||||||
1882 by-election
| Manitoba provincial by-election, 1882 | ||||||||
|---|---|---|---|---|---|---|---|---|
| Party | Candidate | Votes | % | ±% | ||||
| Conservative | Alexander Sutherland | Acclaimed | – | – | ||||
| Total | – | – | ||||||
| Eligible voters / Turnout | N/A | – | – | |||||
| Rejected | N/A | – | – | |||||
Source(s)
Source:Manitoba. Chief Electoral Officer (1999). Statement of Votes for the 37th Provincial General Election, September 21, 1999 (PDF) (Report). Winnipeg: Elections Manitoba. pp. 211–277. | ||||||||
1883 general election
| 1883 Manitoba general election | ||||||||
|---|---|---|---|---|---|---|---|---|
| Party | Candidate | Votes | % | ±% | ||||
| Conservative | Alexander Sutherland | 100 | 57.14% | – | ||||
| Liberal | John Sutherland | 75 | 42.86% | – | ||||
| Total | 175 | – | – | |||||
| Eligible voters / Turnout | N/A | – | – | |||||
| Rejected | N/A | – | – | |||||
Source(s)
Source:Manitoba. Chief Electoral Officer (1999). Statement of Votes for the 37th Provincial General Election, September 21, 1999 (PDF) (Report). Winnipeg: Elections Manitoba. pp. 211–277. | ||||||||
1884 by-election
| Manitoba provincial by-election, 1884 | ||||||||
|---|---|---|---|---|---|---|---|---|
| Party | Candidate | Votes | % | ±% | ||||
| Conservative | John MacBeth | 109 | 64.50% | 7.35% | ||||
| Liberal | J. Thompson | 60 | 35.50% | -7.35% | ||||
| Total | 169 | – | – | |||||
| Eligible voters / Turnout | N/A | – | – | |||||
| Rejected | N/A | – | – | |||||
Source(s)
Source:Manitoba. Chief Electoral Officer (1999). Statement of Votes for the 37th Provincial General Election, September 21, 1999 (PDF) (Report). Winnipeg: Elections Manitoba. pp. 211–277. | ||||||||
1886 general election
| 1886 Manitoba general election | ||||||||
|---|---|---|---|---|---|---|---|---|
| Party | Candidate | Votes | % | ±% | ||||
| Conservative | John MacBeth | 194 | 54.96% | -9.54% | ||||
| Liberal | John Sutherland | 159 | 45.04% | 9.54% | ||||
| Total | 353 | – | – | |||||
| Eligible voters / Turnout | N/A | – | – | |||||
| Rejected | N/A | – | – | |||||
Source(s)
Source:Manitoba. Chief Electoral Officer (1999). Statement of Votes for the 37th Provincial General Election, September 21, 1999 (PDF) (Report). Winnipeg: Elections Manitoba. pp. 211–277. | ||||||||
1888 general election
| 1888 Manitoba general election | ||||||||
|---|---|---|---|---|---|---|---|---|
| Party | Candidate | Votes | % | ±% | ||||
| Conservative | John Norquay | 305 | 50.16% | -4.79% | ||||
| Liberal | Duncan MacArthur | 303 | 49.84% | 4.79% | ||||
| Total | 608 | – | – | |||||
| Eligible voters / Turnout | N/A | – | – | |||||
| Rejected | N/A | – | – | |||||
Source(s)
Source:Manitoba. Chief Electoral Officer (1999). Statement of Votes for the 37th Provincial General Election, September 21, 1999 (PDF) (Report). Winnipeg: Elections Manitoba. pp. 211–277. | ||||||||
1890 by-election
| Manitoba provincial by-election, 1890 | ||||||||
|---|---|---|---|---|---|---|---|---|
| Party | Candidate | Votes | % | ±% | ||||
| Conservative | Thomas Norquay | 325 | 69.59% | 19.43% | ||||
| Unknown | James Taylor | 142 | 30.41% | – | ||||
| Total | 467 | – | – | |||||
| Eligible voters / Turnout | N/A | – | – | |||||
| Rejected | N/A | – | – | |||||
Source(s)
Source:Manitoba. Chief Electoral Officer (1999). Statement of Votes for the 37th Provincial General Election, September 21, 1999 (PDF) (Report). Winnipeg: Elections Manitoba. pp. 211–277. | ||||||||
1892 general election
| 1892 Manitoba general election | ||||||||
|---|---|---|---|---|---|---|---|---|
| Party | Candidate | Votes | % | ±% | ||||
| Liberal | John James Bird | 342 | 51.12% | – | ||||
| Conservative | Nathaniel Francis Hagel | 327 | 48.88% | -20.71% | ||||
| Total | 669 | – | – | |||||
| Eligible voters / Turnout | 971 | 68.90% | – | |||||
| Rejected | N/A | – | – | |||||
Source(s)
Source:Manitoba. Chief Electoral Officer (1999). Statement of Votes for the 37th Provincial General Election, September 21, 1999 (PDF) (Report). Winnipeg: Elections Manitoba. pp. 211–277. | ||||||||
1896 general election
| 1896 Manitoba general election | ||||||||
|---|---|---|---|---|---|---|---|---|
| Party | Candidate | Votes | % | ±% | ||||
| Conservative | Hector Sutherland | 406 | 51.85% | 2.97% | ||||
| Liberal | John James Bird | 377 | 48.15% | -2.97% | ||||
| Total | 783 | – | – | |||||
| Eligible voters / Turnout | 1,040 | 75.29% | 6.39% | |||||
| Rejected | N/A | – | – | |||||
Source(s)
Source:Manitoba. Chief Electoral Officer (1999). Statement of Votes for the 37th Provincial General Election, September 21, 1999 (PDF) (Report). Winnipeg: Elections Manitoba. pp. 211–277. | ||||||||
1899 general election
| 1899 Manitoba general election | ||||||||
|---|---|---|---|---|---|---|---|---|
| Party | Candidate | Votes | % | ±% | ||||
| Conservative | Orton Grain | 830 | 60.01% | 8.16% | ||||
| Liberal | D. F. Reid | 553 | 39.99% | -8.16% | ||||
| Total | 1,383 | – | – | |||||
| Eligible voters / Turnout | N/A | – | – | |||||
| Rejected | N/A | – | – | |||||
Source(s)
Source:Manitoba. Chief Electoral Officer (1999). Statement of Votes for the 37th Provincial General Election, September 21, 1999 (PDF) (Report). Winnipeg: Elections Manitoba. pp. 211–277. | ||||||||
1903 general election
| 1903 Manitoba general election | ||||||||
|---|---|---|---|---|---|---|---|---|
| Party | Candidate | Votes | % | ±% | ||||
| Liberal | Martin O'Donohoe | 718 | 50.17% | 10.19% | ||||
| Conservative | Orton Grain | 713 | 49.83% | -10.19% | ||||
| Total | 1,431 | – | – | |||||
| Eligible voters / Turnout | N/A | – | – | |||||
| Rejected | N/A | – | – | |||||
Source(s)
Source:Manitoba. Chief Electoral Officer (1999). Statement of Votes for the 37th Provincial General Election, September 21, 1999 (PDF) (Report). Winnipeg: Elections Manitoba. pp. 211–277. | ||||||||
1907 general election
| 1907 Manitoba general election | ||||||||
|---|---|---|---|---|---|---|---|---|
| Party | Candidate | Votes | % | ±% | ||||
| Conservative | Orton Grain | 792 | 51.33% | 1.50% | ||||
| Liberal | Martin O'Donohoe | 751 | 48.67% | -1.50% | ||||
| Total | 1,543 | – | – | |||||
| Eligible voters / Turnout | N/A | – | – | |||||
| Rejected | N/A | – | – | |||||
Source(s)
Source:Manitoba. Chief Electoral Officer (1999). Statement of Votes for the 37th Provincial General Election, September 21, 1999 (PDF) (Report). Winnipeg: Elections Manitoba. pp. 211–277. | ||||||||
1910 general election
| 1910 Manitoba general election | ||||||||
|---|---|---|---|---|---|---|---|---|
| Party | Candidate | Votes | % | ±% | ||||
| Conservative | Orton Grain | 1,131 | 52.02% | 0.70% | ||||
| Liberal | Albert Ryerson Bredin | 1,043 | 47.98% | -0.70% | ||||
| Total | 2,174 | – | – | |||||
| Eligible voters / Turnout | N/A | – | – | |||||
| Rejected | N/A | – | – | |||||
Source(s)
Source:Manitoba. Chief Electoral Officer (1999). Statement of Votes for the 37th Provincial General Election, September 21, 1999 (PDF) (Report). Winnipeg: Elections Manitoba. pp. 211–277. | ||||||||
1913 by-election
| Manitoba provincial by-election, 1913 | ||||||||
|---|---|---|---|---|---|---|---|---|
| Party | Candidate | Votes | % | ±% | ||||
| Conservative | Walter Humphries Montague | 1,319 | 59.41% | 7.39% | ||||
| Liberal | Albert Ryerson Bredin | 901 | 40.59% | -7.39% | ||||
| Total | 2,220 | – | – | |||||
| Eligible voters / Turnout | N/A | – | – | |||||
| Rejected | N/A | – | – | |||||
Source(s)
Source:Manitoba. Chief Electoral Officer (1999). Statement of Votes for the 37th Provincial General Election, September 21, 1999 (PDF) (Report). Winnipeg: Elections Manitoba. pp. 211–277. | ||||||||
1914 general election
| 1914 Manitoba general election | ||||||||
|---|---|---|---|---|---|---|---|---|
| Party | Candidate | Votes | % | ±% | ||||
| Conservative | Walter Humphries Montague | 1,086 | 50.07% | -9.35% | ||||
| Liberal | George Prout | 1,083 | 49.93% | 9.35% | ||||
| Total | 2,169 | – | – | |||||
| Eligible voters / Turnout | N/A | – | – | |||||
| Rejected | N/A | – | – | |||||
Source(s)
Source:Manitoba. Chief Electoral Officer (1999). Statement of Votes for the 37th Provincial General Election, September 21, 1999 (PDF) (Report). Winnipeg: Elections Manitoba. pp. 211–277. | ||||||||
1915 general election
| 1915 Manitoba general election | ||||||||
|---|---|---|---|---|---|---|---|---|
| Party | Candidate | Votes | % | ±% | ||||
| Liberal | George Prout | 1,295 | 63.20% | 13.27% | ||||
| Conservative | Richard Sanders | 754 | 36.80% | -13.27% | ||||
| Total | 2,049 | – | – | |||||
| Eligible voters / Turnout | N/A | – | – | |||||
| Rejected | N/A | – | – | |||||
Source(s)
Source:Manitoba. Chief Electoral Officer (1999). Statement of Votes for the 37th Provincial General Election, September 21, 1999 (PDF) (Report). Winnipeg: Elections Manitoba. pp. 211–277. | ||||||||
1920 general election
| 1920 Manitoba general election | ||||||||
|---|---|---|---|---|---|---|---|---|
| Party | Candidate | Votes | % | ±% | ||||
| Labour | Charles Albert Tanner | 1,184 | 40.66% | – | ||||
| Liberal | David Morrison | 876 | 30.08% | -33.12% | ||||
| Farmer | T. McConnell | 852 | 29.26% | – | ||||
| Total | 2,912 | – | – | |||||
| Eligible voters / Turnout | N/A | – | – | |||||
| Rejected | N/A | – | – | |||||
Source(s)
Source:Manitoba. Chief Electoral Officer (1999). Statement of Votes for the 37th Provincial General Election, September 21, 1999 (PDF) (Report). Winnipeg: Elections Manitoba. pp. 211–277. | ||||||||
1922 general election
| 1922 Manitoba general election | ||||||||
|---|---|---|---|---|---|---|---|---|
| Party | Candidate | Votes | % | ±% | ||||
| Labour | Charles Albert Tanner | 1,453 | 44.60% | 3.94% | ||||
| Liberal | Fred Larter | 977 | 29.99% | -0.09% | ||||
| United Farmers | Samuel Henry Summerscales | 828 | 25.41% | – | ||||
| Total | 3,258 | – | – | |||||
| Eligible voters / Turnout | N/A | – | – | |||||
| Rejected | N/A | – | – | |||||
Source(s)
Source:Manitoba. Chief Electoral Officer (1999). Statement of Votes for the 37th Provincial General Election, September 21, 1999 (PDF) (Report). Winnipeg: Elections Manitoba. pp. 211–277. | ||||||||
1927 general election
| 1927 Manitoba general election | ||||||||
|---|---|---|---|---|---|---|---|---|
| Party | Candidate | Votes | % | ±% | ||||
| Conservative | James McLenaghen | 1,530 | 37.14% | – | ||||
| Liberal | Walter Henry Gabriel "Harry" Gibbs | 1,456 | 35.34% | 5.35% | ||||
| Progressive | Charles Albert Tanner | 1,134 | 27.52% | – | ||||
| Total | 4,120 | – | – | |||||
| Eligible voters / Turnout | N/A | – | – | |||||
| Rejected | N/A | – | – | |||||
Source(s)
Source:Manitoba. Chief Electoral Officer (1999). Statement of Votes for the 37th Provincial General Election, September 21, 1999 (PDF) (Report). Winnipeg: Elections Manitoba. pp. 211–277. | ||||||||
1932 general election
| 1932 Manitoba general election | ||||||||
|---|---|---|---|---|---|---|---|---|
| Party | Candidate | Votes | % | ±% | ||||
| Conservative | James McLenaghen | 2,664 | 40.35% | 3.22% | ||||
| Liberal–Progressive | Walter Henry Gabriel "Harry" Gibbs | 2,625 | 39.76% | – | ||||
| Labour | Charles H. Cook | 1,313 | 19.89% | – | ||||
| Total | 6,602 | – | – | |||||
| Eligible voters / Turnout | N/A | – | – | |||||
| Rejected | N/A | – | – | |||||
Source(s)
Source:Manitoba. Chief Electoral Officer (1999). Statement of Votes for the 37th Provincial General Election, September 21, 1999 (PDF) (Report). Winnipeg: Elections Manitoba. pp. 211–277. | ||||||||
1936 general election
| 1936 Manitoba general election | ||||||||
|---|---|---|---|---|---|---|---|---|
| Party | Candidate | Votes | % | ±% | ||||
| Conservative | James McLenaghen | 2,870 | 41.49% | 1.14% | ||||
| Liberal–Progressive | Charles Elwyn Fillmore | 2,271 | 32.83% | -6.93% | ||||
| Independent Labour | R. A. Wise | 1,776 | 25.68% | – | ||||
| Total | 6,917 | – | – | |||||
| Eligible voters / Turnout | N/A | – | – | |||||
| Rejected | N/A | – | – | |||||
Source(s)
Source:Manitoba. Chief Electoral Officer (1999). Statement of Votes for the 37th Provincial General Election, September 21, 1999 (PDF) (Report). Winnipeg: Elections Manitoba. pp. 211–277. | ||||||||
1941 general election
| 1941 Manitoba general election | ||||||||
|---|---|---|---|---|---|---|---|---|
| Party | Candidate | Votes | % | ±% | ||||
| Conservative | James McLenaghen | 3,447 | 64.12% | 22.63% | ||||
| Co-operative Commonwealth | Cornelius Byle | 1,929 | 35.88% | – | ||||
| Total | 5,376 | – | – | |||||
| Eligible voters / Turnout | N/A | – | – | |||||
| Rejected | N/A | – | – | |||||
Source(s)
Source:Manitoba. Chief Electoral Officer (1999). Statement of Votes for the 37th Provincial General Election, September 21, 1999 (PDF) (Report). Winnipeg: Elections Manitoba. pp. 211–277. | ||||||||
1945 general election
| 1945 Manitoba general election | ||||||||
|---|---|---|---|---|---|---|---|---|
| Party | Candidate | Votes | % | ±% | ||||
| Progressive Conservative | James McLenaghen | 3,518 | 56.23% | – | ||||
| Co-operative Commonwealth | William Grundy | 2,313 | 36.97% | 1.08% | ||||
| Labor–Progressive | William Gilbey | 426 | 6.81% | – | ||||
| Total | 6,257 | – | – | |||||
| Eligible voters / Turnout | N/A | – | – | |||||
| Rejected | N/A | – | – | |||||
Source(s)
Source:Manitoba. Chief Electoral Officer (1999). Statement of Votes for the 37th Provincial General Election, September 21, 1999 (PDF) (Report). Winnipeg: Elections Manitoba. pp. 211–277. | ||||||||
1949 general election
| 1949 Manitoba general election | ||||||||
|---|---|---|---|---|---|---|---|---|
| Party | Candidate | Votes | % | ±% | ||||
| Co-operative Commonwealth | George Olive | 2,177 | 50.48% | 13.51% | ||||
| Liberal–Progressive | Melvin Justus Given McMullen "Len Vintus" | 2,136 | 49.52% | – | ||||
| Total | 4,313 | – | – | |||||
| Eligible voters / Turnout | N/A | – | – | |||||
| Rejected | N/A | – | – | |||||
Source(s)
Source: Manitoba. Chief Electoral Officer (1999). Statement of Votes for the 37th Provincial General Election, September 21, 1999 (PDF) (Report). Winnipeg: Elections Manitoba. pp. 211–277. | ||||||||
1953 general election
| 1953 Manitoba general election | ||||||||
|---|---|---|---|---|---|---|---|---|
| Party | Candidate | Votes | % | ±% | ||||
| Co-operative Commonwealth | Russell Paulley | 6,052 | 47.85% | -2.62% | ||||
| Liberal–Progressive | John Leslie Bodie | 4,566 | 36.10% | -13.42% | ||||
| Social Credit | Lorne G. Carson | 1,209 | 9.56% | – | ||||
| Independent | Steve Melnyk | 820 | 6.48% | – | ||||
| Total | 12,647 | – | – | |||||
| Eligible voters / Turnout | N/A | – | – | |||||
| Rejected | N/A | – | – | |||||
Source(s)
Source: Manitoba. Chief Electoral Officer (1999). Statement of Votes for the 37th Provincial General Election, September 21, 1999 (PDF) (Report). Winnipeg: Elections Manitoba. pp. 211–277. | ||||||||
1958 general election
| 1958 Manitoba general election | ||||||||
|---|---|---|---|---|---|---|---|---|
| Party | Candidate | Votes | % | ±% | ||||
| Co-operative Commonwealth | A. J. Reid | 2,776 | 38.29% | -9.56% | ||||
| Progressive Conservative | John Ernest "Jack" Willis | 2,665 | 36.76% | – | ||||
| Liberal–Progressive | George Nordland Suttie | 1,808 | 24.94% | -11.16% | ||||
| Total | 7,249 | – | – | |||||
| Eligible voters / Turnout | 12,239 | 59.23% | – | |||||
| Rejected | 35 | – | – | |||||
Source(s)
Source: Manitoba. Chief Electoral Officer (1999). Statement of Votes for the 37th Provincial General Election, September 21, 1999 (PDF) (Report). Winnipeg: Elections Manitoba. pp. 211–277. | ||||||||
1959 general election
| 1959 Manitoba general election | ||||||||
|---|---|---|---|---|---|---|---|---|
| Party | Candidate | Votes | % | ±% | ||||
| Co-operative Commonwealth | A. J. Reid | 3,659 | 40.02% | 1.73% | ||||
| Progressive Conservative | John Ernest "Jack" Willis | 3,511 | 38.41% | 1.64% | ||||
| Liberal–Progressive | Cornelius Huebert | 1,972 | 21.57% | -3.37% | ||||
| Total | 9,142 | – | – | |||||
| Eligible voters / Turnout | 13,470 | 67.87% | 8.64% | |||||
| Rejected | 20 | – | – | |||||
Source(s)
Source:Manitoba. Chief Electoral Officer (1999). Statement of Votes for the 37th Provincial General Election, September 21, 1999 (PDF) (Report). Winnipeg: Elections Manitoba. pp. 211–277. | ||||||||
1962 general election
| 1962 Manitoba general election | ||||||||
|---|---|---|---|---|---|---|---|---|
| Party | Candidate | Votes | % | ±% | ||||
| Progressive Conservative | James Mills | 3,176 | 33.25% | -5.15% | ||||
| New Democratic | A. J. Reid | 3,172 | 33.21% | – | ||||
| Liberal | Ernest Rudolph | 2,751 | 28.80% | – | ||||
| Social Credit | John De Fehr | 452 | 4.73% | – | ||||
| Total | 9,551 | – | – | |||||
| Eligible voters / Turnout | 17,183 | 55.58% | -12.29% | |||||
| Rejected | 94 | – | – | |||||
Source(s)
Source:Manitoba. Chief Electoral Officer (1999). Statement of Votes for the 37th Provincial General Election, September 21, 1999 (PDF) (Report). Winnipeg: Elections Manitoba. pp. 211–277. | ||||||||
1966 general election
| 1966 Manitoba general election | ||||||||
|---|---|---|---|---|---|---|---|---|
| Party | Candidate | Votes | % | ±% | ||||
| New Democratic | Peter Fox | 4,644 | 36.43% | 3.22% | ||||
| Progressive Conservative | James Mills | 3,808 | 29.87% | -3.38% | ||||
| Liberal | James Smith | 2,966 | 23.26% | -5.54% | ||||
| Social Credit | Henry W. Redekopp | 1,331 | 10.44% | 5.71% | ||||
| Total | 12,749 | – | – | |||||
| Eligible voters / Turnout | 19,335 | 65.94% | 10.35% | |||||
| Rejected | 47 | – | – | |||||
Source(s)
Source:Manitoba. Chief Electoral Officer (1999). Statement of Votes for the 37th Provincial General Election, September 21, 1999 (PDF) (Report). Winnipeg: Elections Manitoba. pp. 211–277. | ||||||||
1969 general election
| 1969 Manitoba general election | ||||||||
|---|---|---|---|---|---|---|---|---|
| Party | Candidate | Votes | % | ±% | ||||
| New Democratic | Peter Fox | 4,589 | 62.73% | 26.30% | ||||
| Progressive Conservative | Don Mills | 1,876 | 25.64% | -4.23% | ||||
| Liberal | John Gugulyn | 851 | 11.63% | -11.63% | ||||
| Total | 7,316 | – | – | |||||
| Eligible voters / Turnout | 10,616 | 68.91% | 2.98% | |||||
| Rejected | 22 | – | – | |||||
Source(s)
Source:Manitoba. Chief Electoral Officer (1999). Statement of Votes for the 37th Provincial General Election, September 21, 1999 (PDF) (Report). Winnipeg: Elections Manitoba. pp. 211–277. | ||||||||
1973 general election
| 1973 Manitoba general election | ||||||||
|---|---|---|---|---|---|---|---|---|
| Party | Candidate | Votes | % | ±% | ||||
| New Democratic | Peter Fox | 5,718 | 54.59% | -8.14% | ||||
| Progressive Conservative | Don Lynn Heidman | 2,660 | 25.39% | -0.25% | ||||
| Liberal | Ann McTavish | 2,097 | 20.02% | 8.39% | ||||
| Total | 10,475 | – | – | |||||
| Eligible voters / Turnout | 12,699 | 82.49% | 13.57% | |||||
| Rejected | 58 | – | – | |||||
Source(s)
Source:Manitoba. Chief Electoral Officer (1999). Statement of Votes for the 37th Provincial General Election, September 21, 1999 (PDF) (Report). Winnipeg: Elections Manitoba. pp. 211–277. | ||||||||
1977 general election
| 1977 Manitoba general election | ||||||||
|---|---|---|---|---|---|---|---|---|
| Party | Candidate | Votes | % | ±% | ||||
| New Democratic | Peter Fox | 5,568 | 49.95% | -4.64% | ||||
| Progressive Conservative | James "Jim" Hanson | 4,651 | 41.72% | 16.33% | ||||
| Liberal | Norm Stapon | 929 | 8.33% | -11.69% | ||||
| Total | 11,148 | – | – | |||||
| Eligible voters / Turnout | 14,390 | 77.47% | -5.02% | |||||
| Rejected | 36 | – | – | |||||
Source(s)
Source:Manitoba. Chief Electoral Officer (1999). Statement of Votes for the 37th Provincial General Election, September 21, 1999 (PDF) (Report). Winnipeg: Elections Manitoba. pp. 211–277. | ||||||||
1981 general election
| 1981 Manitoba general election | ||||||||
|---|---|---|---|---|---|---|---|---|
| Party | Candidate | Votes | % | ±% | ||||
| New Democratic | Mary Beth Dolin | 6,794 | 55.11% | 5.17% | ||||
| Progressive Conservative | Ken Galanchuk | 4,478 | 36.33% | -5.39% | ||||
| Liberal | Alex Berkowits | 755 | 6.12% | -2.21% | ||||
| Progressive | Dan Tokarz | 300 | 2.43% | – | ||||
| Total | 12,327 | – | – | |||||
| Eligible voters / Turnout | 16,120 | 76.47% | -1.00% | |||||
| Rejected | 33 | – | – | |||||
Source(s)
Source:Manitoba. Chief Electoral Officer (1999). Statement of Votes for the 37th Provincial General Election, September 21, 1999 (PDF) (Report). Winnipeg: Elections Manitoba. pp. 211–277. | ||||||||
1985 by-election
| Manitoba provincial by-election, 1985 | ||||||||
|---|---|---|---|---|---|---|---|---|
| Party | Candidate | Votes | % | ±% | ||||
| New Democratic | Marty Dolin | 4,332 | 47.53% | -7.58% | ||||
| Progressive Conservative | Bev Rayburn | 3,248 | 35.64% | -0.69% | ||||
| Liberal | Chris Guly | 988 | 10.84% | 4.72% | ||||
| Progressive | Ben Hanuschak | 546 | 5.99% | 3.56% | ||||
| Total | 9,114 | – | – | |||||
| Eligible voters / Turnout | N/A | – | – | |||||
| Rejected | N/A | – | – | |||||
Source(s)
Source:Manitoba. Chief Electoral Officer (1999). Statement of Votes for the 37th Provincial General Election, September 21, 1999 (PDF) (Report). Winnipeg: Elections Manitoba. pp. 211–277. | ||||||||
1986 general election
| 1986 Manitoba general election | ||||||||
|---|---|---|---|---|---|---|---|---|
| Party | Candidate | Votes | % | ±% | ||||
| New Democratic | Marty Dolin | 6,199 | 51.65 | -3.46 | ||||
| Progressive Conservative | Bev Rayburn | 4,210 | 35.08 | -1.25 | ||||
| Liberal | Hy Berman | 1,134 | 9.45 | +3.33 | ||||
| Progressive | Ben Hanuschak | 459 | 3.82 | +1.39 | ||||
| Turnout | 12,032 | 63.47 | ||||||
| Eligible voters | 18,957 | |||||||
| New Democratic hold | Swing | -1.10 | ||||||
| Source: Elections Manitoba[1] | ||||||||
1988 general election
| 1988 Manitoba general election | ||||||||
|---|---|---|---|---|---|---|---|---|
| Party | Candidate | Votes | % | ±% | ||||
| Liberal | Gulzar Cheema | 5,653 | 35.69 | +26.24 | ||||
| Progressive Conservative | John Baluta | 5,068 | 31.99 | -3.09 | ||||
| New Democratic | Marty Dolin | 4,542 | 28.67 | -22.98 | ||||
| Progressive | Sidney Green | 445 | 2.81 | -1.01 | ||||
| Western Independence | Tracy Fuhr | 133 | 0.84 | n/a | ||||
| Total valid votes | 15,841 | 100.00 | ||||||
| Rejected ballots | 56 | |||||||
| Turnout | 15,897 | 76.48 | ||||||
| Eligible voters | 20,785 | |||||||
| Liberal gain from New Democratic | Swing | +24.61 | ||||||
| Source: Elections Manitoba[2] | ||||||||
1990 general election
| 1990 Manitoba general election | ||||||||
|---|---|---|---|---|---|---|---|---|
| Party | Candidate | Votes | % | ±% | ||||
| New Democratic | Dave Chomiak | 3,904 | 35.69% | 7.02% | ||||
| Progressive Conservative | David Langtry | 3,694 | 33.77% | 1.78% | ||||
| Liberal | Claudia Sarbit | 2,771 | 25.33% | -10.35% | ||||
| Progressive | Sidney Green | 570 | 5.21% | 2.40% | ||||
| Total | 10,939 | – | – | |||||
| Eligible voters / Turnout | 14,604 | 74.90% | -1.31% | |||||
| Rejected | 35 | – | – | |||||
Source(s)
Source:Manitoba. Chief Electoral Officer (1999). Statement of Votes for the 37th Provincial General Election, September 21, 1999 (PDF) (Report). Winnipeg: Elections Manitoba. pp. 211–277. | ||||||||
1995 general election
| 1995 Manitoba general election | ||||||||
|---|---|---|---|---|---|---|---|---|
| Party | Candidate | Votes | % | ±% | ||||
| New Democratic | Dave Chomiak | 5,812 | 52.00% | 16.31% | ||||
| Progressive Conservative | Robert Praznik | 3,324 | 29.74% | -4.03% | ||||
| Liberal | Joe Gallagher | 2,041 | 18.26% | -7.07% | ||||
| Total valid votes | ||||||||
| Rejected and declined votes | 45 | |||||||
| Turnout | 11,222 | 74.29 | ||||||
| Electors on the lists | 15,106 | |||||||
1999 general election
| 1999 Manitoba general election: Kildonan | ||||||||
|---|---|---|---|---|---|---|---|---|
| Party | Candidate | Votes | % | ±% | Expenditures | |||
| New Democratic | Dave Chomiak | 6,101 | 62.32 | +10.32 | $16,574.00 | |||
| Progressive Conservative | Shannon Martin | 2,542 | 25.97 | -3.77 | $14,834.13 | |||
| Liberal | Michael Lazar | 1,093 | 11.16 | -7.10 | $7,835.59 | |||
| Total valid votes | 9,736 | 99.45 | ||||||
| Rejected and declined votes | 54 | |||||||
| Turnout | 9,790 | 70.81 | ||||||
| Electors on the lists | 13,825 | |||||||
2003 general election
| 2003 Manitoba general election: Kildonan | ||||||||
|---|---|---|---|---|---|---|---|---|
| Party | Candidate | Votes | % | ±% | Expenditures | |||
| New Democratic | Dave Chomiak | 5,123 | 70.13 | +7.81 | $13,829.93 | |||
| Progressive Conservative | Garreth McDonald | 1,100 | 15.06 | −10.91 | $687.20 | |||
| Liberal | Michael Lazar | 942 | 12.90 | +1.74 | $4,417.81 | |||
| Green | Frank Luschak | 140 | 1.92 | +1.92 | $106.76 | |||
| Total valid votes | 7,305 | 99.37 | ||||||
| Rejected and declined votes | 46 | |||||||
| Turnout | 7,351 | 53.31 | −17.50 | |||||
| Electors on the lists | 13,788 | |||||||
2007 general election
| 2007 Manitoba general election: Kildonan | ||||||||
|---|---|---|---|---|---|---|---|---|
| Party | Candidate | Votes | % | ±% | Expenditures | |||
| New Democratic | Dave Chomiak | 5,012 | 61.35 | −8.75 | $18,009.09 | |||
| Progressive Conservative | Brent Olynyk | 2,360 | 28.89 | +13.83 | $25,656.74 | |||
| Liberal | Wade Parke | 554 | 6.78 | −6.12 | $2,234.11 | |||
| Green | Nathan Zahn | 203 | 2.49 | +0.57 | $0.00 | |||
| Total valid votes | 8,132 | 99.55 | ||||||
| Rejected and declined votes | 37 | |||||||
| Turnout | 8,169 | 58.57 | +5.26 | |||||
| Electors on the lists | 13,947 | |||||||
2011 general election
| 2011 Manitoba general election: Kildonan | ||||||||
|---|---|---|---|---|---|---|---|---|
| Party | Candidate | Votes | % | ±% | Expenditures | |||
| New Democratic | Dave Chomiak | 4,808 | 59.52 | -1.83 | $27,083.52 | |||
| Progressive Conservative | Darrell Penner | 2,880 | 35.65 | +6.76 | $29,346.96 | |||
| Liberal | Dimitrius Sagriotis | 391 | 4.83 | -1.95 | $467.60 | |||
| Total valid votes | 8,122 | |||||||
| Rejected and declined votes | 43 | |||||||
| Turnout | 54.97 | |||||||
| Electors on the lists | 14,775 | |||||||
| Source: Elections Manitoba[5] | ||||||||
2016 general election
| 2016 Manitoba general election | ||||||||
|---|---|---|---|---|---|---|---|---|
| Party | Candidate | Votes | % | ±% | Expenditures | |||
| Progressive Conservative | Nic Curry | 3,694 | 44.13 | +9.45 | $37,848.07 | |||
| New Democratic | Dave Chomiak | 3,065 | 36.61 | -22.10 | $16,450.60 | |||
| Liberal | Navdeep Khangura | 974 | 11.64 | +7.06 | $9,891.04 | |||
| Green | Steven Stairs | 456 | 5.56 | +5.45 | $0.00 | |||
| Manitoba | Gary Marshall | 133 | 1.62 | +1.59 | $? | |||
| Total valid votes/Expense limit | 8,322 | 100.0 | $45,931.00 | |||||
| Total rejected and declined ballots | 83 | – | – | |||||
| Turnout | 8,405 | 60.96 | – | |||||
| Eligible voters | 13,787 | |||||||
| Source: Elections Manitoba[6][7][8] | ||||||||
References
- "Historical Summary" (PDF). Retrieved December 13, 2018.
- "Candidates: 34th General Election" (PDF). Elections Manitoba. April 26, 1988. Retrieved October 2, 2018.
- "Kildonan — Official Results — 2003 Pronvicial Election". Archived from the original on July 6, 2011. Retrieved December 10, 2009.
- http://www.electionsmanitoba.ca/en/Results/39_division_results/39_kildonan_summary_results.html Archived 2012-03-21 at the Wayback Machine - 2007 results
- "Election Returns: 40th General Election". Elections Manitoba. 2011. Retrieved September 10, 2018.
- "Candidates: 41st General Election". Elections Manitoba. March 29, 2016. Retrieved March 31, 2016.
- "41ST GENERAL ELECTION, APRIL 19, 2016 - OFFICIAL RESULTS". Elections Manitoba. April 19, 2016. Retrieved November 10, 2016.
- "Election Returns: 41st General Election". Elections Manitoba. 2016. Retrieved September 10, 2018.
Другой контент может иметь иную лицензию. Перед использованием материалов сайта WikiSort.org внимательно изучите правила лицензирования конкретных элементов наполнения сайта.
WikiSort.org - проект по пересортировке и дополнению контента Википедии