world.wikisort.org - Canada
Glace Bay-Dominion is a provincial electoral district in Nova Scotia, Canada, that elects one member of the Nova Scotia House of Assembly.
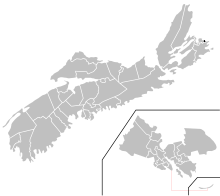 Glace Bay in relation to other Cape Breton electoral districts | |||
| Provincial electoral district | |||
| Legislature | Nova Scotia House of Assembly | ||
| MLA |
Progressive Conservative | ||
| District created | 1925 | ||
| First contested | 1928 | ||
| Last contested | 2021 | ||
| Demographics | |||
| Population (2011) | 15,487 | ||
| Electors (2012) | 12,236 | ||
| Area (km²) | 29 | ||
| Pop. density (per km²) | 534 | ||
| Census division(s) | Cape Breton County | ||
| Census subdivision(s) | Cape Breton RM | ||
The Member of the Legislative Assembly since 2010 is Geoff MacLellan of the Nova Scotia Liberal Party.
It was created in 1933 when the district of Cape Breton was divided into five electoral districts, one of which was named Cape Breton East. In 2001, the district name was changed to Glace Bay. In 2003, the district lost a small area at its southern tip to Cape Breton West.[1] Following the 2019 redistribution, it gained the Dominion area from Cape Breton Centre and was re-named Glace Bay-Dominion.
Geography
The land area of Glace Bay-Dominion is 29 km2 (11 sq mi).[2]
Members of the Legislative Assembly
This riding has elected the following Members of the Legislative Assembly:
| Legislature | Years | Member | Party | |
|---|---|---|---|---|
| 64th | 2021–present | John White | Progressive Conservative | |
| 63rd | 2017–2021 | Geoff MacLellan | Liberal | |
| 62nd | 2013–2017 | |||
| 61st | 2010–2013 | |||
| 2009–2010 | Dave Wilson | Liberal | ||
| 60th | 2006–2009 | |||
| 59th | 2003–2006 | |||
| 58th | 2000–2003 | |||
| 57th | 1998–1999 | Reeves Matheson | Independent | |
| 1998 | New Democratic | |||
| 56th | 1993–1998 | John MacEachern | Liberal | |
| 55th | 1988–1993 | |||
| 54th | 1984–1988 | Donnie MacLeod | Progressive Conservative | |
| 53rd | 1981–1984 | |||
| 52nd | 1980–1981 | |||
| 1978–1980 | Jeremy Akerman | New Democratic | ||
| 51st | 1974–1978 | |||
| 50th | 1970–1974 | |||
| 49th | 1967–1970 | Layton Fergusson | Progressive Conservative | |
| 48th | 1963–1967 | |||
| 47th | 1960–1963 | |||
| 46th | 1956–1960 | |||
| 45th | 1953–1956 | Russell Cunningham | Co-operative Commonwealth Federation | |
| 44th | 1949–1953 | |||
| 43rd | 1945–1949 | |||
| 42nd | 1941–1945 | Douglas Neil Brodie | Co-operative Commonwealth Federation | |
| 41st | 1937–1941 | Lauchlin Currie | Liberal | |
| 40th | 1933–1937 | |||
Election results
1925 general election
| 1925 Nova Scotia general election | ||||||||
|---|---|---|---|---|---|---|---|---|
| Party | Candidate | Votes | % | |||||
| Liberal–Conservative | John Carey Douglas | 7,276 | 29.77% | |||||
| Liberal–Conservative | Alexander O'Handley | 7,071 | 28.93% | |||||
| Labour | D. W. Morrison | 4,185 | 17.12% | |||||
| Labour | Forman Waye | 4,051 | 16.57% | |||||
| Liberal | Daniel C. McDonald | 933 | 3.82% | |||||
| Liberal | James L. McKinnon | 928 | 3.80% | |||||
| Total | 24,444 | – | ||||||
Source(s)
Source: Nova Scotia Legislature (2021). "Electoral History for Cape Breton East" (PDF). nslegislature.ca. | ||||||||
1928 general election
| 1928 Nova Scotia general election | ||||||||
|---|---|---|---|---|---|---|---|---|
| Party | Candidate | Votes | % | |||||
| Liberal–Conservative | Robert Hamilton Butts | 5,568 | 22.08% | |||||
| Liberal–Conservative | Daniel R. Cameron | 5,541 | 21.98% | |||||
| Liberal | Lauchlin Daniel Currie | 4,724 | 18.73% | |||||
| Liberal | Dan C. McDonald | 4,520 | 17.93% | |||||
| Labour | James B. McLachlan | 2,589 | 10.27% | |||||
| Labour | Forman Waye | 2,273 | 9.01% | |||||
| Total | 25,215 | – | ||||||
Source(s)
Source: Nova Scotia Legislature (2021). "Electoral History for Cape Breton East" (PDF). nslegislature.ca. | ||||||||
1933 general election
| 1933 Nova Scotia general election | ||||||||
|---|---|---|---|---|---|---|---|---|
| Party | Candidate | Votes | % | |||||
| Liberal | Lauchlin Daniel Currie | 3,655 | 39.21% | |||||
| Liberal–Conservative | Daniel R. Cameron | 3,632 | 38.97% | |||||
| United Front | James B. McLachlan | 1,737 | 18.64% | |||||
| Co-operative Commonwealth | Donald O. Fraser | 297 | 3.19% | |||||
| Total | 9,321 | – | ||||||
Source(s)
Source: Nova Scotia Legislature (2021). "Electoral History for Cape Breton East" (PDF). nslegislature.ca. Nova Scotia Legislature (1933). Legislature of Nova Scotia Election Returns (PDF). Queen's Printer. | ||||||||
1937 general election
| 1937 Nova Scotia general election | ||||||||
|---|---|---|---|---|---|---|---|---|
| Party | Candidate | Votes | % | ±% | ||||
| Liberal | Lauchlin Daniel Currie | 4,172 | 40.12% | 0.90% | ||||
| Labour | William T. Mercer | 3,396 | 32.65% | – | ||||
| Liberal–Conservative | Roderick Kerr | 2,832 | 27.23% | -11.74% | ||||
| Total | 10,400 | – | ||||||
Source(s)
Source: Nova Scotia Legislature (2021). "Electoral History for Cape Breton East" (PDF). nslegislature.ca. Nova Scotia Legislature (1937). Legislature of Nova Scotia Election Returns (PDF). Queen's Printer. | ||||||||
1941 general election
| 1941 Nova Scotia general election | ||||||||
|---|---|---|---|---|---|---|---|---|
| Party | Candidate | Votes | % | ±% | ||||
| Co-operative Commonwealth | Douglas Neil Brodie | 6,222 | 60.56% | – | ||||
| Liberal | Lauchlin Daniel Currie | 4,052 | 39.44% | -0.68% | ||||
| Total | 10,274 | – | ||||||
Source(s)
Source: Nova Scotia Legislature (2021). "Electoral History for Cape Breton East" (PDF). nslegislature.ca. Nova Scotia Legislature (1941). Legislature of Nova Scotia Election Returns (PDF). Queen's Printer. | ||||||||
1945 general election
| 1945 Nova Scotia general election | ||||||||
|---|---|---|---|---|---|---|---|---|
| Party | Candidate | Votes | % | ±% | ||||
| Co-operative Commonwealth | Russell Cunningham | 5,332 | 58.90% | -1.66% | ||||
| Liberal | Gus McGillivray | 2,719 | 30.03% | -9.41% | ||||
| Liberal–Conservative | Kenneth Daniel Beaton | 1,002 | 11.07% | – | ||||
| Total | 9,053 | – | ||||||
Source(s)
Source: Nova Scotia Legislature (2021). "Electoral History for Cape Breton East" (PDF). nslegislature.ca. Nova Scotia Legislature (1945). Legislature of Nova Scotia Election Returns (PDF). Queen's Printer. | ||||||||
1949 general election
| 1949 Nova Scotia general election | ||||||||
|---|---|---|---|---|---|---|---|---|
| Party | Candidate | Votes | % | ±% | ||||
| Co-operative Commonwealth | Russell Cunningham | 4,543 | 43.41% | -15.49% | ||||
| Liberal | Charles Roy MacDonald | 3,829 | 36.59% | 6.55% | ||||
| Liberal–Conservative | Thomas Horace Dickson | 2,093 | 20.00% | 8.93% | ||||
| Total | 10,465 | – | ||||||
Source(s)
Source: Nova Scotia Legislature (2021). "Electoral History for Cape Breton East" (PDF). nslegislature.ca. Nova Scotia Legislature (1949). Legislature of Nova Scotia Election Returns (PDF). Queen's Printer. | ||||||||
1953 general election
| 1953 Nova Scotia general election | ||||||||
|---|---|---|---|---|---|---|---|---|
| Party | Candidate | Votes | % | ±% | ||||
| Co-operative Commonwealth | Russell Cunningham | 5,096 | 49.07% | 5.65% | ||||
| Liberal | Joseph McIntyre | 3,934 | 37.88% | 1.29% | ||||
| Progressive Conservative | William Wilton | 1,356 | 13.06% | – | ||||
| Total | 10,386 | – | ||||||
Source(s)
Source: Nova Scotia Legislature (2021). "Electoral History for Cape Breton East" (PDF). nslegislature.ca. Nova Scotia Legislature (1953). Legislature of Nova Scotia Election Returns (PDF). Queen's Printer. | ||||||||
1956 general election
| 1956 Nova Scotia general election | ||||||||
|---|---|---|---|---|---|---|---|---|
| Party | Candidate | Votes | % | ±% | ||||
| Progressive Conservative | Layton Fergusson | 4,324 | 42.20% | 29.15% | ||||
| Liberal | Charles Roy MacDonald | 3,058 | 29.85% | -8.03% | ||||
| Co-operative Commonwealth | Russell Cunningham | 2,864 | 27.95% | -21.11% | ||||
| Total | 10,246 | – | ||||||
Source(s)
Source: Nova Scotia Legislature (2021). "Electoral History for Cape Breton East" (PDF). nslegislature.ca. Nova Scotia Legislature (1956). Legislature of Nova Scotia Election Returns (PDF). Queen's Printer. | ||||||||
1960 general election
| 1960 Nova Scotia general election | ||||||||
|---|---|---|---|---|---|---|---|---|
| Party | Candidate | Votes | % | ±% | ||||
| Progressive Conservative | Layton Fergusson | 4,862 | 45.56% | 3.36% | ||||
| Co-operative Commonwealth | John L. MacKinnon | 4,243 | 39.76% | 11.81% | ||||
| Liberal | Joe A. Wadden | 1,567 | 14.68% | -15.16% | ||||
| Total | 10,672 | – | ||||||
Source(s)
Source: Nova Scotia Legislature (2021). "Electoral History for Cape Breton East" (PDF). nslegislature.ca. Nova Scotia Legislature (1960). Legislature of Nova Scotia Election Returns (PDF). Queen's Printer. | ||||||||
1963 general election
| 1963 Nova Scotia general election | ||||||||
|---|---|---|---|---|---|---|---|---|
| Party | Candidate | Votes | % | ±% | ||||
| Progressive Conservative | Layton Fergusson | 5,870 | 58.06% | 12.50% | ||||
| New Democratic | John L. MacKinnon | 2,881 | 28.50% | – | ||||
| Liberal | Bernard Currie | 1,359 | 13.44% | -1.24% | ||||
| Total | 10,110 | – | ||||||
Source(s)
Source: Nova Scotia Legislature (2021). "Electoral History for Cape Breton East" (PDF). nslegislature.ca. Nova Scotia Legislature (1963). Legislature of Nova Scotia Election Returns (PDF). Queen's Printer. | ||||||||
1967 general election
| 1967 Nova Scotia general election | ||||||||
|---|---|---|---|---|---|---|---|---|
| Party | Candidate | Votes | % | ±% | ||||
| Progressive Conservative | Layton Fergusson | 5,094 | 53.29% | -4.77% | ||||
| New Democratic | James H. Aitchison | 3,048 | 31.89% | 3.39% | ||||
| Liberal | William O'Leary | 1,417 | 14.82% | 1.38% | ||||
| Total | 9,559 | – | ||||||
Source(s)
Source: Nova Scotia Legislature (2021). "Electoral History for Cape Breton East" (PDF). nslegislature.ca. Nova Scotia Legislature (1967). Legislature of Nova Scotia Election Returns (PDF). Queen's Printer. | ||||||||
1970 general election
| 1970 Nova Scotia general election | ||||||||
|---|---|---|---|---|---|---|---|---|
| Party | Candidate | Votes | % | ±% | ||||
| New Democratic | Jeremy Akerman | 5,334 | 47.72% | 15.83% | ||||
| Progressive Conservative | Layton Fergusson | 3,807 | 34.06% | -19.23% | ||||
| Liberal | Robert MacKay | 2,037 | 18.22% | 3.40% | ||||
| Total | 11,178 | – | ||||||
Source(s)
Source: Nova Scotia Legislature (2021). "Electoral History for Cape Breton East" (PDF). nslegislature.ca. Nova Scotia Legislature (1970). Legislature of Nova Scotia Election Returns (PDF). Queen's Printer. | ||||||||
1974 general election
| 1974 Nova Scotia general election | ||||||||
|---|---|---|---|---|---|---|---|---|
| Party | Candidate | Votes | % | ±% | ||||
| New Democratic | Jeremy Akerman | 5,929 | 53.10% | 5.38% | ||||
| Liberal | Vince Kachafanas | 3,443 | 30.83% | 12.61% | ||||
| Progressive Conservative | Fred Adshade | 1,611 | 14.43% | -19.63% | ||||
| Independent | Archie MacDonald | 183 | 1.64% | – | ||||
| Total | 11,166 | – | ||||||
Source(s)
Source: Nova Scotia Legislature (2021). "Electoral History for Cape Breton East" (PDF). nslegislature.ca. Nova Scotia. Chief Electoral Officer (1974). Returns of the General Election for the House of Assembly, Twenty-Eighth General Election (PDF). Queen's Printer. | ||||||||
1978 general election
| 1978 Nova Scotia general election | ||||||||
|---|---|---|---|---|---|---|---|---|
| Party | Candidate | Votes | % | ±% | ||||
| New Democratic | Jeremy Akerman | 5,135 | 44.94% | -8.16% | ||||
| Progressive Conservative | Frank Edwards | 3,182 | 27.85% | 13.42% | ||||
| Liberal | Vincent Kachafanas | 3,109 | 27.21% | -3.62% | ||||
| Total | 11,426 | – | ||||||
Source(s)
Source: Nova Scotia Legislature (2021). "Electoral History for Cape Breton East" (PDF). nslegislature.ca. Nova Scotia. Chief Electoral Officer (1978). Returns of the General Election for the House of Assembly, Twenty-Ninth General Election (PDF). Queen's Printer. | ||||||||
1980 by-election
| Party | Candidate | Votes | % | ±% | |
|---|---|---|---|---|---|
| PC | Donnie MacLeod | 4,505 | |||
| NDP | Reeves Matheson | 2,996 | |||
| Liberal | Vincent Kachafanas | 2,904 | |||
| Independent | Ignatius V. Kennedy | 101 | |||
1981 general election
| 1981 Nova Scotia general election | ||||||||
|---|---|---|---|---|---|---|---|---|
| Party | Candidate | Votes | % | ±% | ||||
| Progressive Conservative | Donnie MacLeod | 4,699 | 45.55% | 17.70% | ||||
| Liberal | Shelly McNeil | 3,053 | 29.59% | 2.38% | ||||
| New Democratic | Joe Kanary | 1,849 | 17.92% | -27.02% | ||||
| Independent | Blair Matheson | 716 | 6.94% | – | ||||
| Total | 10,317 | – | ||||||
Source(s)
Source: Nova Scotia Legislature (2021). "Electoral History for Cape Breton East" (PDF). nslegislature.ca. Nova Scotia. Chief Electoral Officer (1981). Returns of the General Election for the House of Assembly, Thirteith General Election (PDF). Queen's Printer. | ||||||||
1984 general election
| 1984 Nova Scotia general election | ||||||||
|---|---|---|---|---|---|---|---|---|
| Party | Candidate | Votes | % | ±% | ||||
| Progressive Conservative | Donnie MacLeod | 4,787 | 44.97% | -0.58% | ||||
| Liberal | Cha Keliher | 3,579 | 33.62% | 4.03% | ||||
| Labour | Blair Matheson | 1,724 | 16.20% | – | ||||
| New Democratic | Jim Jobe | 555 | 5.21% | -12.71% | ||||
| Total | 10,645 | – | ||||||
Source(s)
Source: Nova Scotia Legislature (2021). "Electoral History for Cape Breton East" (PDF). nslegislature.ca. Nova Scotia. Chief Electoral Officer (1984). Returns of the General Election for the House of Assembly, Thirty-First General Election (PDF). Queen's Printer. | ||||||||
1988 general election
| 1988 Nova Scotia general election | ||||||||
|---|---|---|---|---|---|---|---|---|
| Party | Candidate | Votes | % | ±% | ||||
| Liberal | John MacEachern | 5,739 | 50.60% | 16.97% | ||||
| Progressive Conservative | Bruce Clark | 4,014 | 35.39% | -9.58% | ||||
| New Democratic | Terry McVarish | 1,590 | 14.02% | 8.80% | ||||
| Total | 11,343 | – | ||||||
Source(s)
Source: Nova Scotia Legislature (2021). "Electoral History for Cape Breton East" (PDF). nslegislature.ca. Nova Scotia. Chief Electoral Officer (1988). Returns of the General Election for the House of Assembly, Thirty-Second General Election (PDF). Queen's Printer. | ||||||||
1993 general election
| 1993 Nova Scotia general election | ||||||||
|---|---|---|---|---|---|---|---|---|
| Party | Candidate | Votes | % | ±% | ||||
| Liberal | John MacEachern | 7,566 | 73.50% | 22.90% | ||||
| New Democratic | Terry McVarish | 1,659 | 16.12% | 2.10% | ||||
| Progressive Conservative | Greg Hicks | 1,069 | 10.38% | -25.00% | ||||
| Total | 10,294 | – | ||||||
Source(s)
Source: Nova Scotia Legislature (2021). "Electoral History for Cape Breton East" (PDF). nslegislature.ca. Nova Scotia. Chief Electoral Officer (1993). Returns of the General Election for the House of Assembly, Thirty-Third General Election (PDF). Queen's Printer. | ||||||||
1998 general election
| 1998 Nova Scotia general election | ||||||||
|---|---|---|---|---|---|---|---|---|
| Party | Candidate | Votes | % | ±% | ||||
| New Democratic | Reeves Matheson | 5,002 | 52.59% | 36.47% | ||||
| Liberal | Clarence Routledge | 2,859 | 30.06% | -43.44% | ||||
| Progressive Conservative | Henry Boutillier | 1,651 | 17.36% | 6.97% | ||||
| Total | 9,512 | – | ||||||
Source(s)
Source: Nova Scotia Legislature (2021). "Electoral History for Cape Breton East" (PDF). nslegislature.ca. | ||||||||
1999 general election
| 1999 Nova Scotia general election | ||||||||
|---|---|---|---|---|---|---|---|---|
| Party | Candidate | Votes | % | ±% | ||||
| Liberal | Dave Wilson | 3,704 | 40.12% | 10.06% | ||||
| New Democratic | Cecil Saccary | 3,699 | 40.06% | -12.52% | ||||
| Progressive Conservative | Brad Kerr | 1,043 | 11.30% | -6.06% | ||||
| Independent | Gerard Burke | 787 | 8.52% | – | ||||
| Total | 9,233 | – | ||||||
Source(s)
Source: Nova Scotia Legislature (2021). "Electoral History for Cape Breton East" (PDF). nslegislature.ca. | ||||||||
2000 by-election
| Party | Candidate | Votes | % | ±% | |
|---|---|---|---|---|---|
| Liberal | Dave Wilson | 4,017 | 43.33 | ||
| NDP | Cecil Saccary | 3,609 | 38.93 | ||
| PC | Brad Kerr | 1,644 | 17.74 | ||
2003 general election
| 2003 Nova Scotia general election | ||||||||
|---|---|---|---|---|---|---|---|---|
| Party | Candidate | Votes | % | ±% | ||||
| Liberal | Dave Wilson | 4,420 | 54.48% | 14.36% | ||||
| New Democratic | Vince Hall | 2,342 | 28.87% | -11.20% | ||||
| Progressive Conservative | Mark Bettens | 1,351 | 16.65% | 5.36% | ||||
| Total | 8,113 | – | ||||||
Source(s)
Source: Nova Scotia Legislature (2021). "Electoral History for Cape Breton East" (PDF). nslegislature.ca. | ||||||||
2006 general election
| 2006 Nova Scotia general election | ||||||||
|---|---|---|---|---|---|---|---|---|
| Party | Candidate | Votes | % | ±% | ||||
| Liberal | Dave Wilson | 3,327 | 43.08% | -11.40% | ||||
| New Democratic | Myrtle Campbell | 2,234 | 28.93% | 0.06% | ||||
| Progressive Conservative | Mark Bettens | 2,074 | 26.85% | 10.20% | ||||
| Green | Todd Pettigrew | 88 | 1.14% | – | ||||
| Total | 7,723 | – | ||||||
Source(s)
Source: Nova Scotia Legislature (2021). "Electoral History for Cape Breton East" (PDF). nslegislature.ca. | ||||||||
2009 general election
| 2009 Nova Scotia general election | ||||||||
|---|---|---|---|---|---|---|---|---|
| Party | Candidate | Votes | % | ±% | ||||
| Liberal | Dave Wilson | 3,380 | 47.60% | 4.52% | ||||
| New Democratic | Myrtle Campbell | 2,829 | 39.84% | 10.91% | ||||
| Progressive Conservative | Tom MacPherson | 810 | 11.41% | -15.45% | ||||
| Green | Todd Pettigrew | 82 | 1.15% | 0.02% | ||||
| Total | 7,101 | – | ||||||
Source(s)
Source: Nova Scotia Legislature (2021). "Electoral History for Cape Breton East" (PDF). nslegislature.ca. | ||||||||
2010 by-election
| Party | Candidate | Votes | % | ±% | |
|---|---|---|---|---|---|
| Liberal | Geoff MacLellan | 3,901 | 53.91 | ||
| NDP | Myrtle Campbell | 2,281 | 31.52 | ||
| PC | Michelle Wheelhouse | 759 | 10.48 | ||
| Independent | Edna Lee | 195 | 2.69 | ||
| Atlantica | Dan Wilson | 56 | 0.77 | ||
2013 general election
| Party | Candidate | Votes | % | ±% | |
|---|---|---|---|---|---|
| Liberal | Geoff MacLellan | 5,547 | 80.36 | ||
| NDP | Mary Beth MacDonald | 1,001 | 14.50 | ||
| PC | Thomas Bethell | 355 | 5.14 | ||
2017 general election
| 2017 provincial election redistributed results[3] | |||
|---|---|---|---|
| Party | Vote | % | |
| Liberal | 3,641 | 44.59 | |
| Progressive Conservative | 3,195 | 39.13 | |
| New Democratic | 1,193 | 14.61 | |
| Atlantica | 137 | 1.68 | |
| 2017 Nova Scotia general election | ||||||||
|---|---|---|---|---|---|---|---|---|
| Party | Candidate | Votes | % | ±% | ||||
| Liberal | Geoff MacLellan | 3,316 | 46.66 | -33.7 | ||||
| Progressive Conservative | John White | 2,938 | 41.35 | +36.21 | ||||
| New Democratic | Lois MacDougall | 715 | 10.06 | -4.44 | ||||
| Atlantica | Steven MacNeil | 137 | 1.92 | |||||
| Total valid votes | 7,110 | 100 | ||||||
| Total rejected ballots | 73 | 1.03 | ||||||
| Turnout | 7,183 | 57.4 | ||||||
| Eligible voters | 12,510 | |||||||
| Liberal hold | Swing | -34.96 | ||||||
| Source: Elections Nova Scotia[4][5] | ||||||||
2021 general election
| 2021 Nova Scotia general election | ||||||||
|---|---|---|---|---|---|---|---|---|
| Party | Candidate | Votes | % | ±% | ||||
| Progressive Conservative | John White | 2,754 | 34.61 | -6.74 | ||||
| New Democratic | John Morgan | 2,725 | 34.24 | +24.18 | ||||
| Liberal | John John McCarthy | 2,479 | 31.15 | -15.51 | ||||
| Total valid votes | 7,958 | 99.45 | ||||||
| Total rejected ballots | 44 | 0.55 | ||||||
| Turnout | 8,002 | 59.37 | ||||||
| Eligible voters | 13,478 | |||||||
| Progressive Conservative gain from Liberal | Swing | +4.39 | ||||||
| Source: Elections Nova Scotia[6] | ||||||||
References
- Glace Bay - Constituency History Nova Scotia Legislature
- "Find Your Electoral District for the 41st Provincial General Election". enstools.electionsnovascotia.ca. Elections Nova Scotia. Retrieved 22 July 2021.
- Transposition of Votes from the 2017 Provincial General Election to 2019 Electoral District Boundaries
- "Statement of Votes & Statistics, Volume I" (PDF). Elections Nova Scotia. Retrieved July 17, 2021.
- "May 30th, 2017 - 40th Nova Scotia Provincial General Election". Elections Nova Scotia. Retrieved July 17, 2021.
- "Provincial General Election 2021-08-17- Official Results". Elections Nova Scotia. Retrieved October 7, 2021.
External links
- riding profile
- June 13, 2006 Nova Scotia Provincial General Election Poll By Poll Results
- June 9, 2009 Nova Scotia Provincial General Election Poll By Poll Results[permanent dead link]
Другой контент может иметь иную лицензию. Перед использованием материалов сайта WikiSort.org внимательно изучите правила лицензирования конкретных элементов наполнения сайта.
WikiSort.org - проект по пересортировке и дополнению контента Википедии