world.wikisort.org - Canada
Cypress Hills—Grasslands is a federal electoral district in Saskatchewan, Canada, that has been represented in the House of Commons of Canada since 1997.
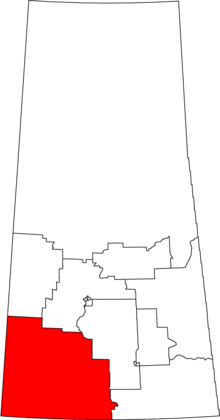 Cypress Hills—Grasslands in relation to other Saskatchewan federal electoral districts as of the 2013 Representation Order. | |||
| Federal electoral district | |||
| Legislature | House of Commons | ||
| MP |
Conservative | ||
| District created | 1996 | ||
| First contested | 1997 | ||
| Last contested | 2021 | ||
| District webpage | profile, map | ||
| Demographics | |||
| Population (2011)[1] | 67,834 | ||
| Electors (2015) | 49,713 | ||
| Area (km²)[2] | 77,822 | ||
| Pop. density (per km²) | 0.87 | ||
| Census subdivision(s) | Swift Current, Kindersley, Assiniboia, Maple Creek | ||
Geography
The district is in the southwestern corner of the Province of Saskatchewan.
History
The electoral district was created in 1996 from Kindersley—Lloydminster, Moose Jaw—Lake Centre and Swift Current—Maple Creek—Assiniboia ridings.
This riding lost territory to Carlton Trail—Eagle Creek and gained territory from Battlefords—Lloydminster and Palliser during the 2012 electoral redistribution.
Members of Parliament
This riding has elected the following members of the House of Commons:
| Parliament | Years | Member | Party | |
|---|---|---|---|---|
| Cypress Hills—Grasslands Riding created from Kindersley—Lloydminster, Moose Jaw—Lake Centre and Swift Current—Maple Creek—Assiniboia |
||||
| 36th | 1997–2000 | Lee Morrison | Reform | |
| 2000–2000 | Alliance | |||
| 37th | 2000–2003 | David Anderson | ||
| 2003–2004 | Conservative | |||
| 38th | 2004–2006 | |||
| 39th | 2006–2008 | |||
| 40th | 2008–2011 | |||
| 41st | 2011–2015 | |||
| 42nd | 2015–2019 | |||
| 43rd | 2019–2021 | Jeremy Patzer | ||
| 44th | 2021–present | |||
Election results
Graph of election results in Cypress Hills—Grasslands (minor parties that never got 2% of the vote or didn't run consistently are omitted)
| 2021 Canadian federal election | ||||||||
|---|---|---|---|---|---|---|---|---|
| Party | Candidate | Votes | % | ±% | ||||
| Conservative | Jeremy Patzer | 24,518 | 71.53 | –9.6 | ||||
| New Democratic | Alex McPhee | 3,604 | 10.51 | +1.0 | ||||
| People's | Charles Reginald Hislop | 2,826 | 8.24 | +5.4 | ||||
| Liberal | Mackenzie Hird | 1,492 | 4.35 | +0.1 | ||||
| Maverick | Mark Skagen | 1,360 | 3.97 | +3.97 | ||||
| Green | Carol Vandale | 284 | 0.83 | –1.1 | ||||
| Independent | Maria Rose Lewans | 193 | 0.56 | –0.01 | ||||
| Total valid votes | 34,277 | 99.6 | ||||||
| Total rejected ballots | 145 | 0.04 | ||||||
| Turnout | 34,422 | 67 | ||||||
| Eligible voters | 49,606 | |||||||
| Conservative hold | Swing | +3.2 | ||||||
| Source: Elections Canada[3] | ||||||||
| 2019 Canadian federal election | ||||||||
|---|---|---|---|---|---|---|---|---|
| Party | Candidate | Votes | % | ±% | Expenditures | |||
| Conservative | Jeremy Patzer | 31,140 | 81.1 | +11.91 | $41,250.21 | |||
| New Democratic | Trevor Peterson | 3,666 | 9.5 | -3.71 | $10,304.53 | |||
| Liberal | William Caton | 1,595 | 4.2 | -10.66 | $5,954.44 | |||
| People's | Lee Harding | 1,075 | 2.8 | - | $3,064.62 | |||
| Green | Bill Clary | 719 | 1.9 | -0.84 | $0.00 | |||
| Independent | Maria Lewans | 220 | 0.6 | - | none listed | |||
| Total valid votes/expense limit | 38,415 | 100.0 | ||||||
| Total rejected ballots | 259 | |||||||
| Turnout | 38,674 | 77.2 | ||||||
| Eligible voters | 50,111 | |||||||
| Conservative hold | Swing | +7.81 | ||||||
| Source: Elections Canada[4][5] | ||||||||
| 2015 Canadian federal election | ||||||||
|---|---|---|---|---|---|---|---|---|
| Party | Candidate | Votes | % | ±% | Expenditures | |||
| Conservative | David Anderson | 25,050 | 69.19 | -1.38 | $53,440.65 | |||
| Liberal | Marvin Wiens | 5,381 | 14.86 | +9.02 | $50,766.23 | |||
| New Democratic | Trevor Peterson | 4,783 | 13.21 | -7.59 | $43,201.40 | |||
| Green | Bill Caton | 993 | 2.74 | -0.04 | $1,007.60 | |||
| Total valid votes/expense limit | 36,207 | 100.0 | $235,061.03 | |||||
| Total rejected ballots | 99 | 0.27 | -0.03 | |||||
| Turnout | 36,306 | 71.99 | +4.89 | |||||
| Eligible voters | 50,426 | |||||||
| Conservative hold | Swing | -5.22 | ||||||
| Source: Elections Canada[6][7] | ||||||||
| 2011 federal election redistributed results[8] | |||
|---|---|---|---|
| Party | Vote | % | |
| Conservative | 22,871 | 70.57 | |
| New Democratic | 6,742 | 20.80 | |
| Liberal | 1,894 | 5.84 | |
| Green | 901 | 2.78 | |
| 2011 Canadian federal election | ||||||||
|---|---|---|---|---|---|---|---|---|
| Party | Candidate | Votes | % | ±% | Expenditures | |||
| Conservative | David L. Anderson | 20,555 | 69.8 | +5.4 | $39,752 | |||
| New Democratic | Trevor Peterson | 6,248 | 21.2 | +5.4 | $9,855 | |||
| Liberal | Duane Filson | 1,838 | 6.2 | -7.1 | $27,813 | |||
| Green | Helmi Scott | 788 | 2.7 | -3.9 | $517 | |||
| Total valid votes/expense limit | 29,429 | 100.0 | $94,253 | |||||
| Total rejected ballots | 79 | 0.3 | 0.0 | |||||
| Turnout | 29,508 | 67.1 | +4 | |||||
| Eligible voters | 43,997 | – | – | |||||
| Conservative hold | Swing | +6.25 | ||||||
| 2008 Canadian federal election | ||||||||
|---|---|---|---|---|---|---|---|---|
| Party | Candidate | Votes | % | ±% | Expenditures | |||
| Conservative | David L. Anderson | 17,922 | 64.4 | -2.1 | $51,570 | |||
| New Democratic | Scott Wilson | 4,394 | 15.8 | -1.1 | $5,879 | |||
| Liberal | Duane Filson | 3,691 | 13.3 | +0.4 | $23,849 | |||
| Green | Bill Clary | 1,840 | 6.6 | +2.8 | $4,012 | |||
| Total valid votes/expense limit | 27,847 | 100.0 | $91,352 | |||||
| Total rejected ballots | 81 | 0.3 | 0.0 | |||||
| Turnout | 27,928 | 63 | -3 | |||||
| Conservative hold | Swing | +1.0 | ||||||
| 2006 Canadian federal election | ||||||||
|---|---|---|---|---|---|---|---|---|
| Party | Candidate | Votes | % | ±% | Expenditures | |||
| Conservative | David L. Anderson | 20,035 | 66.5 | +5.8 | $42,285 | |||
| New Democratic | Mike Eason | 5,076 | 16.8 | +0.3 | $12,076 | |||
| Liberal | Bill Caton | 3,885 | 12.9 | -5.8 | $3,553 | |||
| Green | Amanda Knorr | 1,141 | 3.8 | -0.4 | – | |||
| Total valid votes | 30,137 | 100.0 | – | |||||
| Total rejected ballots | 85 | 0.3 | -0.1 | |||||
| Turnout | 30,222 | 66.5 | +3 | |||||
| Conservative hold | Swing | +5.8 | ||||||
| 2004 Canadian federal election | ||||||||
|---|---|---|---|---|---|---|---|---|
| Party | Candidate | Votes | % | ±% | Expenditures | |||
| Conservative | David L. Anderson | 18,010 | 60.6 | -9.9 | $35,176 | |||
| Liberal | Bill Caton | 5,547 | 18.7 | +6.1 | $29,831 | |||
| New Democratic | Jeff Potts | 4,901 | 16.5 | –0.4 | $17,512 | |||
| Green | Bev Currie | 1,243 | 4.2 | $805 | ||||
| Total valid votes | 29,701 | 100 | – | |||||
| Total rejected ballots | 117 | 0.4 | +0.1 | |||||
| Turnout | 29,818 | 63 | -2 | |||||
| Conservative hold | Swing | -8.0 | ||||||
| 2000 Canadian federal election | ||||||||
|---|---|---|---|---|---|---|---|---|
| Party | Candidate | Votes | % | ±% | Expenditures | |||
| Alliance | David L. Anderson | 18,593 | 61.6 | +12.5 | $33,948 | |||
| New Democratic | Keith Murch | 5,101 | 16.9 | -2.5 | $14,293 | |||
| Liberal | Marlin Bryce Belt | 3,791 | 12.6 | -8.7 | $722 | |||
| Progressive Conservative | Bill Caton | 2,676 | 8.9 | -1.3 | $7,462 | |||
| Total valid votes | 30,161 | 100 | – | |||||
| Total rejected ballots | 90 | 0.3 | 0.0 | |||||
| Turnout | 30,251 | 65 | -2.4 | |||||
| Alliance hold | Swing | +10.6 | ||||||
| 1997 Canadian federal election | ||||||||
|---|---|---|---|---|---|---|---|---|
| Party | Candidate | Votes | % | ±% | Expenditures | |||
| Reform | Lee Morrison | 16,439 | 49.1 | – | $36,935 | |||
| Liberal | Ron Gleim | 7,130 | 21.3 | – | $52,705 | |||
| New Democratic | Dean Smith | 6,490 | 19.4 | – | $36,138 | |||
| Progressive Conservative | Marcel Fournier | 3,421 | 10.2 | – | $9,917 | |||
| Total valid votes | 33,480 | 100 | – | |||||
| Total rejected ballots | 105 | 0.3 | ||||||
| Turnout | 33,585 | 67.4 | ||||||
See also
- List of Canadian federal electoral districts
- Past Canadian electoral districts
References
- "(Code 47004) Census Profile". 2011 census. Statistics Canada. 2012. Retrieved March 3, 2011.
Notes
- Statistics Canada: 2012
- Statistics Canada: 2012
- "List of confirmed candidates – September 20, 2021 Federal Election". Elections Canada. Retrieved September 2, 2021.
- "List of confirmed candidates". Elections Canada. Retrieved October 4, 2019.
- "Election Night Results". Elections Canada. Retrieved November 8, 2019.
- Elections Canada – Confirmed candidates for Cypress Hills—Grasslands, 30 September 2015
- Elections Canada – Preliminary Election Expenses Limits for Candidates Archived August 15, 2015, at the Wayback Machine
- Pundits' Guide to Canadian Elections
External links
- Riding history for Cypress Hills—Grasslands (1996– ) from the Library of Parliament
- Expenditures - 2008
- Expenditures - 2004
- Expenditures - 2000
- Expenditures - 1997
Текст в блоке "Читать" взят с сайта "Википедия" и доступен по лицензии Creative Commons Attribution-ShareAlike; в отдельных случаях могут действовать дополнительные условия.
Другой контент может иметь иную лицензию. Перед использованием материалов сайта WikiSort.org внимательно изучите правила лицензирования конкретных элементов наполнения сайта.
Другой контент может иметь иную лицензию. Перед использованием материалов сайта WikiSort.org внимательно изучите правила лицензирования конкретных элементов наполнения сайта.
2019-2025
WikiSort.org - проект по пересортировке и дополнению контента Википедии
WikiSort.org - проект по пересортировке и дополнению контента Википедии