world.wikisort.org - USA
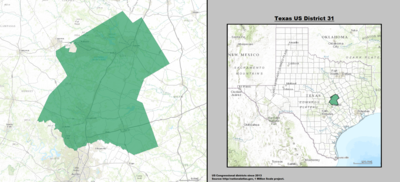
Texas's 31st congressional district of the United States House of Representatives covers a strip of central Texas from the northern Austin suburbs up to Temple.
| Texas's 31st congressional district | |||
|---|---|---|---|
 Texas's 31st congressional district since January 3, 2013 | |||
| Representative |
| ||
| Distribution |
| ||
| Population (2021) | 969,723[2] | ||
| Median household income | $80,643[3] | ||
| Ethnicity |
| ||
| Cook PVI | R+6[4] | ||
The district is centered around Bell and Williamson Counties, two fast-growing suburban counties north of Austin; it includes the Williamson County portion of Austin itself. It also includes much of the Bell County area surrounding Fort Hood, giving the district a strong military presence.
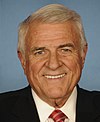
John Carter has served as the representative from this district since its creation. The 31st district is one of only two districts in Texas (the other being the 36th district) that has never been represented by a member of the Democratic Party.
Election results from statewide races
| Year | Office | Result |
|---|---|---|
| 2004 | President | Bush 67 – 33% |
| 2008 | President | McCain 56 – 43% |
| 2012 | President | Romney 59.6 – 38.3% |
| 2016 | President | Trump 53.5 – 40.8% |
| 2018 | Senate | Cruz 50 – 48% |
| Governor | Abbott 56.2% – 41.5% | |
| 2020 | President | Trump 50 – 48% |
List of representatives
| Representative | Party | Years | Cong ress |
Electoral history | District boundaries |
|---|---|---|---|---|---|
| District created January 3, 2003 | |||||
 John Carter (Round Rock) |
Republican | January 3, 2003 – present |
108th 109th 110th 111th 112th 113th 114th 115th 116th 117th |
Elected in 2002. Re-elected in 2004. Re-elected in 2006. Re-elected in 2008. Re-elected in 2010. Re-elected in 2012. Re-elected in 2014. Re-elected in 2016. Re-elected in 2018. Re-elected in 2020. Re-elected in 2022. |
2003–2005 Austin, Bastrop, Brazos, Burleson, Harris, Lee, Waller, Washington, and Williamson |
2005–2013 Bell, Coryell, Erath, Falls, Hamilton, Milam, Robertson, and Williamson | |||||
2013–present Bell and Williamson | |||||
Recent election results
| Party | Candidate | Votes | % | ±% | |
|---|---|---|---|---|---|
| Republican | John Carter (incumbent) | 160,247 | 64.8 | ||
| Democratic | Jon Porter | 80,292 | 32.5 | ||
| Libertarian | Celeste Adams | 6,888 | 2.8 | ||
| Majority | 79,955 | 32.3 | |||
| Turnout | 247,427 | ||||
| Republican hold | Swing | -4.7 | |||
| Party | Candidate | Votes | % | ±% | |
|---|---|---|---|---|---|
| Republican | John Carter (incumbent) | 94,242 | 58 | ||
| Democratic | Mary Beth Harrell | 62,761 | 39 | ||
| Libertarian | Matt McAdoo | 4,370 | 3 | ||
| Majority | 31,481 | 19 | |||
| Turnout | 161,373 | ||||
| Republican hold | Swing | -6.7 | |||
| Party | Candidate | Votes | % | ±% | |
|---|---|---|---|---|---|
| Republican | John Carter (incumbent) | 175,563 | 60.3 | ||
| Democratic | Brian P. Ruiz | 106,559 | 36.6 | ||
| Libertarian | Barry N. Cooper | 9,182 | 3.2 | ||
| Majority | 69,004 | 23.7 | |||
| Turnout | 291,304 | ||||
| Republican hold | Swing | ||||
| Party | Candidate | Votes | % | ±% | |
|---|---|---|---|---|---|
| Republican | John Carter (incumbent) | 126,384 | 82.6 | ||
| Libertarian | Bill Oliver | 26,735 | 17.5 | ||
| Majority | 99,649 | 65.1 | |||
| Turnout | 153,119 | ||||
| Republican hold | Swing | ||||
| Party | Candidate | Votes | % | ±% | |
|---|---|---|---|---|---|
| Republican | John Carter (incumbent) | 145,348 | 61.3 | ||
| Democratic | Stephen M. Wyman | 82,977 | 35.0 | ||
| Libertarian | Ethan Garofolo | 8,862 | 3.7 | ||
| Majority | 82,587 | 34.8 | |||
| Turnout | 237,187 | ||||
| Republican hold | Swing | ||||
| Party | Candidate | Votes | % | ±% | |
|---|---|---|---|---|---|
| Republican | John Carter (incumbent) | 91,484 | 64.1 | ||
| Democratic | Louie Minor | 45,634 | 32.0 | ||
| Libertarian | Scott Ballard | 5,693 | 4.0 | ||
| Majority | 45,850 | ||||
| Turnout | 142,811 | 18 | |||
| Republican hold | Swing | ||||
| Party | Candidate | Votes | % | ±% | |
|---|---|---|---|---|---|
| Republican | John Carter (incumbent) | 166,060 | 58.4 | ||
| Democratic | Mike Clark | 103,852 | 36.5 | ||
| Libertarian | Scott Ballard | 14,676 | 5.2 | ||
| Majority | 62,208 | ||||
| Turnout | 284,588 | 35 | |||
| Republican hold | Swing | ||||
| Party | Candidate | Votes | % | ±% | |
|---|---|---|---|---|---|
| Republican | John Carter (incumbent) | 144,680 | 50.6 | ||
| Democratic | MJ Hegar | 136,362 | 47.7 | ||
| Libertarian | Jason Hope | 4,965 | 1.7 | ||
| Majority | 8,318 | 2.9 | |||
| Turnout | 286,007 | ||||
| Republican hold | Swing | ||||
| Party | Candidate | Votes | % | ±% | |
|---|---|---|---|---|---|
| Republican | John Carter (incumbent) | 212,695 | 53.5 | ||
| Democratic | Donna Imam | 176,293 | 44.3 | ||
| Libertarian | Clark Patterson | 8,922 | 2.2 | ||
| Majority | 36,402 | 9.2 | |||
| Turnout | 397,910 | 100 | |||
| Republican hold | Swing | 28.1 | |||
Historical district boundaries

See also
- List of United States congressional districts
References
- Geography, US Census Bureau. "Congressional Districts Relationship Files (state-based)". Census.gov. Retrieved October 14, 2018.
- Bureau, Center for New Media & Promotion (CNMP), US Census. "My Congressional District". Census.gov. Retrieved November 1, 2022.
- "My Congressional District".
- "Introducing the 2021 Cook Political Report Partisan Voter Index". The Cook Political Report. April 15, 2021. Retrieved April 15, 2021.
External links
This United States Congress–related article is a stub. You can help Wikipedia by expanding it. |
Другой контент может иметь иную лицензию. Перед использованием материалов сайта WikiSort.org внимательно изучите правила лицензирования конкретных элементов наполнения сайта.
WikiSort.org - проект по пересортировке и дополнению контента Википедии