world.wikisort.org - USA
Fort Ann is a town in Washington County, New York, United States. It is part of the Glens Falls Metropolitan Statistical Area.[6] The town population was 6,417 at the 2000 census.[3] The town contains a village, also called Fort Ann, located in its southeastern corner.[7]
Fort Ann | |
|---|---|
Town | |
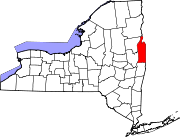
 Location in Washington County and the state of New York. | |
| Coordinates: 43°27′52″N 73°32′19″W | |
| Country | United States |
| State | New York |
| County | Washington |
| Metro Area | Glens Falls, New York |
| Fort Anne Built | 1757 |
| Organized | 1786 as Westfield |
| Incorporated | 1808 as Fort Ann |
| Government | |
| • Town Supervisor | Richard Moore |
| • Town Board | Members[1] |
| Area | |
| • Total | 110.86 sq mi (287.13 km2) |
| • Land | 109.08 sq mi (282.50 km2) |
| • Water | 1.79 sq mi (4.63 km2) 1.20% |
| Population (2010)[3] | |
| • Total | 6,190 |
| • Estimate (2016)[4] | 6,110 |
| • Density | 56.02/sq mi (21.63/km2) |
| Time zone | UTC-5 (EST) |
| • Summer (DST) | UTC-4 (EDT) |
| ZIP code(s)[5] | 12827 (primary) |
| Area code | 518 |
| FIPS code | 36-115-26715 |
| Website | www.townoffortannny.com |
History
Colonial period
Fort Ann is located on the historic route linking the French and English colonies.
The area was the site of several forts built by various nations, from a small French fort called "The Pickets" near the southern end of Lake Champlain in 1689, in the northwestern area of the town, to a series of forts (including "Fort Schuyler" and "Queen's Fort") closer to where the village of Fort Ann stands today. The first of these was likely the Stone Fort, built by Englishman Fitz John Winthrop in 1692.
The English expedition led by Francis Nicholson built Fort Schuyler, approximately one-half mile south of the present village, in 1709. (The old Champlain Canal passed through a part of the site.) Nicholson burned the fort when he and his army left, but he returned in 1711 and built the Queen's Fort, later renamed Fort Anne (after Queen Anne of Great Britain), at the same site. It fell into ruins during the English colonial period.[8]: 16–17
Fort Anne was rebuilt in 1757 by the English, during the French and Indian War. The 1777 Battle of Fort Anne took place here during the Saratoga Campaign of the American Revolutionary War.
The early town
Part of the town was in the Artillery Patent of 1764, granted to 24 officers of the British army. Settlement of the town did not occur until 1775. The town was established as the "Town of Westfield" on March 23, 1786,[9][page needed] and was renamed Fort Ann on April 6, 1808,[8]: 71 after the battle.[1][10] It is unknown why the spelling was changed.[1] Parts of the original town were used to form the later town of Hartford (1793),[8]: 65 Putnam (1806).[8]: 285
19th century
In 1820, the village of Fort Ann incorporated as a municipality within the town.
In 1823, the Champlain Canal was completed, linking the area to the outside world. Later the Delaware and Hudson Railway established a depot at Fort Ann village.
Notable people
- Orestes Garrison, Wisconsin State Assemblyman
- Edwin R. Reynolds, former US Congressman
Geography
According to the United States Census Bureau, the town has a total area of 110.8 square miles (287.0 km2), of which 109.5 square miles (283.5 km2) is land and 1.3 square miles (3.4 km2) (1.20%) is water.[11]
The western border is defined as the Warren/Washington county border with the towns of Queensbury and Bolton. The shoreline of Lake George defines the Bolton-Fort Ann border. Across the town's northern border is the town of Dresden. The eastern border is the towns of Whitehall and Granville. The southern border is shared with Granville, Hartford, and Kingsbury.[12]
The town lies partially within the Adirondack Park.[12] Of the county's 17 towns, Fort Ann is the largest by area.[11]
Demographics
| Historical population | |||
|---|---|---|---|
| Census | Pop. | %± | |
| 1820 | 2,911 | — | |
| 1830 | 3,201 | 10.0% | |
| 1840 | 3,559 | 11.2% | |
| 1850 | 3,383 | −4.9% | |
| 1860 | 3,127 | −7.6% | |
| 1870 | 3,320 | 6.2% | |
| 1880 | 3,263 | −1.7% | |
| 1890 | 2,696 | −17.4% | |
| 1900 | 2,263 | −16.1% | |
| 1910 | 2,236 | −1.2% | |
| 1920 | 2,357 | 5.4% | |
| 1930 | 2,977 | 26.3% | |
| 1940 | 3,653 | 22.7% | |
| 1950 | 3,122 | −14.5% | |
| 1960 | 3,124 | 0.1% | |
| 1970 | 3,749 | 20.0% | |
| 1980 | 4,425 | 18.0% | |
| 1990 | 6,368 | 43.9% | |
| 2000 | 6,417 | 0.8% | |
| 2010 | 6,190 | −3.5% | |
| 2016 (est.) | 6,110 | [4] | −1.3% |
| U.S. Decennial Census[13] | |||
Fort Ann is the third-most populous of Washington County's 17 towns.[11]
As of the census of 2000, there were 6,417 people, 1,386 households, and 1,042 families residing in the town. The population density was 58.6 people per square mile (22.6/km2). There were 1,957 housing units at an average density of 17.9 per square mile (6.9/km2). The racial makeup of the town was 68.21% White, 24.08% Black or African American, 0.34% Native American, 0.26% Asian, 0.03% Pacific Islander, 6.36% from other races, and 0.72% from two or more races. Hispanic or Latino of any race were 12.48% of the population.[3]
There were 1,386 households, out of which 33.8% had children under the age of 18 living with them, 62.1% were married couples living together, 8.7% had a female householder with no husband present, and 24.8% were non-families. 19.3% of all households were made up of individuals, and 8.2% had someone living alone who was 65 years of age or older. The average household size was 2.66 and the average family size was 3.03.[3]
In the town, the population was spread out, with 15.3% under the age of 18, 18.7% from 18 to 24, 39.3% from 25 to 44, 19.9% from 45 to 64, and 6.9% who were 65 years of age or older. The median age was 33 years. For every 100 females, there were 251.2 males. For every 100 females age 18 and over, there were 292.8 males.[3]
The median income for a household in the town was $41,832, and the median income for a family was $46,944. Males had a median income of $26,329 versus $23,917 for females. The per capita income for the town was $15,101. About 5.7% of families and 6.7% of the population were below the poverty line, including 4.7% of those under age 18 and 7.3% of those age 65 or over.[3]
Note: The census counts prisoners based on where they are incarcerated.[14] With two all-male state prisons in Comstock,[15] the data presented is likely to be skewed in comparison with the general town population and the population of neighboring non-prison towns, particularly with regard to ethnicity and the female:male ratio, because a disproportionate percentage of the prison population is male and black or Hispanic.[16]
Communities and locations in the Town of Fort Ann
Communities
- Comstock – A hamlet near the intersection of US-4 and NY-22;[7] originally a shipping center founded by Peter Comstock,[citation needed] now the site of two state prisons (Great Meadow Correctional Facility and Washington Correctional Facility).[15]
- Fort Ann – A village located in the southeastern part of the town on US-4 and NY-149.[7]
- Furnace Hollow – A historic location in the town.[17]
- Hogtown – An early name for the western part of the town,[17] it is a hamlet west of South Bay hamlet, south of Sleeping Beauty, and northeast of Crossett Pond.[18] The name is derived from farmers having let hogs forage freely.[17]
- Johnnycake Corners – A historic location in the town.[17]
- Kattskill Bay – A hamlet on the shore of Lake George, at and including the northeasternmost area of Queensbury.[19]
- Pilot Knob – A hamlet on the shore of Lake George at the northern end of County Road 32.[20] It is part of a larger community, East Lake George, which includes the northernmost part of the Town of Queensbury. East Lake George attempted to incorporate as a village, a measure rejected by voters in 2010.[21]
- Shelving Rock – A hamlet on the shore of Lake George, northwest of Shelving Rock Mountain and Shelving Rock Brook.[18]
- South Bay – A hamlet on County Road 16 in the northern part of the town by South Bay Creek.[18]
- Tripoli – A hamlet near the southern town line.[22]
- West Fort Ann – A hamlet in the southwestern part of the town.[22]
Geographic locations
- Buck Mountain – An elevation east of the Pilot Knob community. At 2,500 feet (760 m), it is the highest mountain in the town.[17]
- Copeland Pond – A small lake east of Hadlock Pond.[22]
- Crossett Pond – A lake east of Pilot Knob Mountain.[22]
- Fort Ann mountains – High ground in the eastern part of the town.
- Hadlock Pond – A man-made reservoir north of West Fort Ann, also known as Lake Hadlock.[22] The Hadlock Pond dam was reconstructed in 2005, only to collapse months later, flooding and damaging nearby property.[23]
- Halfway Creek – A stream that runs from the southwestern corner of town to the Champlain Canal in Fort Ann village.[7][22]
- Lake Nebo – A lake at the Adirondack Park Boundary.[22]
- Lakes Pond – A lake north of Lake Nebo.[22]
- Palmertown Mountains – Elevated land on the western side of Fort Ann by Lake George.
- Pilot Knob – An elevation near Lake George and south of the community of the same name.
- Putnam Mountain – An elevation west of West Road.[22]
- Sleeping Beauty Mountain – An elevation in the northwestern corner of Fort Ann.[18]
- Sugar Loaf Mountain – An elevation by the town line with Queensbury.[22]
- South Bay – The southern end of Lake Champlain lies in the northeast corner of the town.
- Van Warner Bay – A bay of Lake George by - but not in - the southwestern part of the town.
- Winchell Creek – A small river in the southern part of the town.
References
- "What Happened to the "E"?". Town of Fort Ann. Retrieved November 1, 2018.
- "2016 U.S. Gazetteer Files". United States Census Bureau. Retrieved Jul 5, 2017.
- "U.S. Census website". United States Census Bureau. Retrieved 2008-01-31.
- "Population and Housing Unit Estimates". Retrieved June 9, 2017.
- Washington County GIS Web Map (Map). Washington County, NY. Archived from the original on January 7, 2010. Retrieved June 18, 2010.
- "Metropolitan Areas and Components, 1999, with FIPS Codes". US Census Bureau. Retrieved July 7, 2009.
- NYS Department of Transportation Raster Quadrangle M51 (Map). Cartography by USGS. NYSDOT. 1992. Retrieved July 11, 2010.
- Johnson, Crisfield (1878). History of Washington Co., New York. Everts & Ensign.
- Fort Ann: 300 Years of History, The Fort Ann Historical Society, 2007
- Vasiliev, Ren (2004). From Abbotts to Zurich: New York State Placenames. Syracuse University Press. p. 81. ISBN 9780815607984.
- "New York by Place and County Subdivision". United States Census Bureau. Archived from the original on February 12, 2020. Retrieved August 8, 2010.
- Overview of Fort Ann (Map). Cartography by My Topo.com. Acme Mapper 2.0. Retrieved August 8, 2010.
- "Census of Population and Housing". Census.gov. Retrieved June 4, 2015.
- "Counting prisoners". US Census Bureau. Retrieved July 12, 2010.[permanent dead link]
- "Facility Listing". NYS Department of Correctional Services. Archived from the original on September 23, 2006. Retrieved July 12, 2010.
- Richburg, Keith B. (April 26, 2009). "Before Census, a Debate Over Prisoners". Washington Post. Retrieved July 12, 2010.
You have a disproportionately black and Hispanic male population that is counted in the wrong spot.
- "Town of Fort Ann". Rootsweb. Retrieved July 11, 2010.
- NYS Department of Transportation Raster Quadrangle L50 (Map). Cartography by USGS. NYSDOT. 1992. Retrieved July 11, 2010.
- Washington County GIS Web Map (Map). Washington County. Archived from the original on January 7, 2010. Retrieved July 11, 2010.
- NYS Department of Transportation Raster Quadrangle L49 (Map). Cartography by USGS. NYSDOT. 1992. Retrieved July 11, 2010.
- Roman, Dayelin (August 26, 2010). "East Lake George proposal is defeated". The Post-Star. Retrieved August 27, 2010.
- NYS Department of Transportation Raster Quadrangle M50 (Map). Cartography by USGS. NYSDOT. 1992. Retrieved July 11, 2010.
- Lehman, Don (June 17, 2010). "Jury spreads out blame for Hadlock Pond dam collapse". The Post Star. Retrieved July 12, 2010.
Municipalities and communities of Washington County, New York, United States | ||
|---|---|---|
County seat: Fort Edward | ||
| Towns |
|  |
| Villages |
| |
| CDPs | ||
| Hamlets |
| |
| Footnotes | ‡This populated place also has portions in an adjacent county or counties | |
| ||
Authority control | |
|---|---|
| General |
|
| National libraries | |
Другой контент может иметь иную лицензию. Перед использованием материалов сайта WikiSort.org внимательно изучите правила лицензирования конкретных элементов наполнения сайта.
WikiSort.org - проект по пересортировке и дополнению контента Википедии