world.wikisort.org - USA
Clark County is a county in the U.S. state of Wisconsin. As of the 2020 census, the population was 34,659.[1] Its county seat is Neillsville.[2]
Clark County | |
|---|---|
U.S. county | |
 Clark County Courthouse | |
 Location within the U.S. state of Wisconsin | |
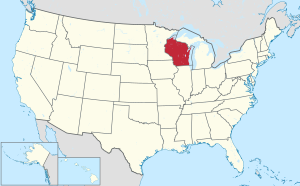 Wisconsin's location within the U.S. | |
| Coordinates: 44°44′N 90°37′W | |
| Country | |
| State | |
| Founded | 1854 |
| Named for | George Rogers Clark |
| Seat | Neillsville |
| Largest city | Neillsville |
| Area | |
| • Total | 1,219 sq mi (3,160 km2) |
| • Land | 1,210 sq mi (3,100 km2) |
| • Water | 9.0 sq mi (23 km2) 0.7% |
| Population (2020)[1] | |
| • Total | 34,659 |
| • Density | 28.7/sq mi (11.1/km2) |
| Time zone | UTC−6 (Central) |
| • Summer (DST) | UTC−5 (CDT) |
| Congressional district | 7th |
| Website | www |
History
By the early 1800s, the land and streams that are now Clark County were the hunting grounds of Chippewa, Dakota, Ho-Chunk and possibly Menominee peoples. In 1836 these Indians were joined by a party of French-Canadian fur traders who started a temporary post for the American Fur Company on the Black River's East Fork.[3]
The next White arrival was probably Mormon loggers in 1844, come to cut pine logs from the forests along the Black River and float them down to a sawmill at Black River Falls. From there the sawed wood would be floated down the river to be used in construction of the Mormon temple in Nauvoo, Illinois. They had camps on the river at what is called Mormon Riffle, a mile below Neillsville, near Weston's Rapids, and south of Greenwood. This project probably ended by 1846, when most of the Mormons headed west after the murder of Joseph Smith.[4]
In June of 1845, James and Henry O'Neill led a party overland, cutting a road up through the brush, with a wagon of tools and supplies pulled by oxen. They built a cabin on O'Neill Creek, then a sawmill. Lumber sawed by the mill was rafted down the river to Black River Falls, and from there to Alexander O'Neill in Burlington, Iowa. Not all was good, as a storm in June 1847 flooded the Black River and took out all mills then existing. But the pioneers rebuilt.[5]

Clark County was founded in 1853 and organized the following year.[6] It was named for A. W. Clark, an early settler,[7] or for General George Rogers Clark.[8][9]
Electricity became available around 1900 in some of the towns and villages from private power plants - e.g. in 1902 the Paulsen mill began offering electrical service within the village of Withee. For farms out in the country, it took another 35 years, with electric lines finally put up starting around 1937 by the new Clark Electric Cooperative, funded by a loan from the New Deal Rural Electrification Administration.[10]
Geography
According to the U.S. Census Bureau, the county has a total area of 1,219 square miles (3,160 km2), of which 1,210 square miles (3,100 km2) is land and 9.0 square miles (23 km2) (0.7%) is water.[11]
Adjacent counties
- Taylor County – north
- Marathon County – east
- Wood County – southeast
- Jackson County – south
- Eau Claire County – west
- Chippewa County – northwest
Major highways
|
|
Railroads
- Union Pacific
- Watco
- Canadian National
Buses
- List of intercity bus stops in Wisconsin
Airport
Climate
| ||||||||||||||||||||||||||||||||||||||||||||||||||||||||||||||||||||||||||||||||||||||||||||||||||||||||||||||||||||||||||||
Demographics and religion statistics
| Historical population | |||
|---|---|---|---|
| Census | Pop. | %± | |
| 1860 | 789 | — | |
| 1870 | 3,450 | 337.3% | |
| 1880 | 10,715 | 210.6% | |
| 1890 | 17,708 | 65.3% | |
| 1900 | 25,848 | 46.0% | |
| 1910 | 30,074 | 16.3% | |
| 1920 | 35,120 | 16.8% | |
| 1930 | 34,165 | −2.7% | |
| 1940 | 33,972 | −0.6% | |
| 1950 | 32,459 | −4.5% | |
| 1960 | 31,527 | −2.9% | |
| 1970 | 30,361 | −3.7% | |
| 1980 | 32,910 | 8.4% | |
| 1990 | 31,647 | −3.8% | |
| 2000 | 33,557 | 6.0% | |
| 2010 | 34,690 | 3.4% | |
| 2020 | 34,659 | −0.1% | |
| U.S. Decennial Census[13] 1790–1960[14] 1900–1990[15] 1990–2000[16] 2010[17] 2020[1] | |||
2020 census
As of the census of 2020,[1] the population was 34,659. The population density was 28.7 inhabitants per square mile (11.1/km2). There were 14,755 housing units at an average density of 12.2 per square mile (4.7/km2). The racial makeup of the county was 92.2% White, 0.5% Native American, 0.3% Black or African American, 0.3% Asian, 3.4% from other races, and 3.2% from two or more races. Ethnically, the population was 6.1% Hispanic or Latino of any race.
2000 census

As of the census[18] of 2000, there were 33,557 people, 12,047 households, and 8,673 families residing in the county. The population density was 28 people per square mile (11/km2). There were 13,531 housing units at an average density of 11 per square mile (4/km2). The racial makeup of the county was 98.05% White, 0.13% Black or African American, 0.48% Native American, 0.30% Asian, 0.01% Pacific Islander, 0.56% from other races, and 0.47% from two or more races. 1.20% of the population were Hispanic or Latino of any race. 54.0% were of German, 9.0% Polish, 6.2% Norwegian and 6.1% United States or American ancestry. 6.62% reported speaking German, Pennsylvania German, or Dutch at home; an additional 1.34% speak Spanish.[19]
There were 12,047 households, out of which 35.00% had children under the age of 18 living with them, 61.20% were married couples living together, 6.50% had a female householder with no husband present, and 28.00% were non-families. 23.80% of all households were made up of individuals, and 12.60% had someone living alone who was 65 years of age or older. The average household size was 2.73 and the average family size was 3.27.
In the county, the population was spread out, with 29.90% under the age of 18, 7.70% from 18 to 24, 26.20% from 25 to 44, 20.20% from 45 to 64, and 16.00% who were 65 years of age or older. The median age was 36 years. For every 100 females there were 100.50 males. For every 100 females age 18 and over, there were 98.70 males.
In 2017, there were 554 births, giving a general fertility rate of 99.2 births per 1000 women aged 15–44, the second highest rate out of all 72 Wisconsin counties. 184 of the births occurred at home, more than any other Wisconsin county.[20]
In 2010, the largest religious groups by reported number of adherents in Clark County were Catholic at 9,535 adherents, Missouri Synod Lutheran at 2,459 adherents, ELCA Lutheran at 2,281 adherents, Amish at 1,986 adherents, United Church of Christ at 959 adherents, Wisconsin Synod Lutheran at 891 adherents, and United Methodist at 577 adherents.[21]
Communities

Cities
- Abbotsford (partly in Marathon County)
- Colby (partly in Marathon County)
- Greenwood
- Loyal
- Neillsville (county seat)
- Owen
- Thorp
- Stanley (mostly in Chippewa County)
Villages
- Curtiss
- Dorchester (partly in Marathon County)
- Granton
- Unity (mostly in Marathon County)
- Withee
Towns
Census-designated places
Unincorporated communities
Ghost towns/neighborhoods
Religion

In 2013 there were 16 Amish church districts in Clark County.[22]
Politics
| Year | Republican | Democratic | Third party | |||
|---|---|---|---|---|---|---|
| No. | % | No. | % | No. | % | |
| 2020 | 10,002 | 67.14% | 4,524 | 30.37% | 372 | 2.50% |
| 2016 | 8,652 | 63.28% | 4,221 | 30.87% | 800 | 5.85% |
| 2012 | 7,412 | 53.71% | 6,172 | 44.72% | 217 | 1.57% |
| 2008 | 6,383 | 44.99% | 7,454 | 52.54% | 350 | 2.47% |
| 2004 | 7,966 | 52.67% | 6,966 | 46.06% | 193 | 1.28% |
| 2000 | 7,461 | 52.73% | 5,931 | 41.92% | 757 | 5.35% |
| 1996 | 4,622 | 35.94% | 5,540 | 43.08% | 2,699 | 20.99% |
| 1992 | 4,977 | 33.44% | 5,540 | 37.22% | 4,368 | 29.34% |
| 1988 | 6,296 | 48.30% | 6,642 | 50.95% | 98 | 0.75% |
| 1984 | 8,099 | 58.24% | 5,647 | 40.61% | 160 | 1.15% |
| 1980 | 7,921 | 52.73% | 6,091 | 40.54% | 1,011 | 6.73% |
| 1976 | 6,095 | 44.35% | 7,238 | 52.67% | 409 | 2.98% |
| 1972 | 7,138 | 56.47% | 4,617 | 36.52% | 886 | 7.01% |
| 1968 | 6,325 | 51.20% | 4,601 | 37.24% | 1,428 | 11.56% |
| 1964 | 4,897 | 38.55% | 7,781 | 61.25% | 26 | 0.20% |
| 1960 | 7,368 | 55.22% | 5,934 | 44.47% | 41 | 0.31% |
| 1956 | 7,941 | 62.26% | 4,765 | 37.36% | 48 | 0.38% |
| 1952 | 9,406 | 71.71% | 3,652 | 27.84% | 58 | 0.44% |
| 1948 | 5,885 | 52.66% | 4,840 | 43.31% | 450 | 4.03% |
| 1944 | 7,948 | 62.80% | 4,612 | 36.44% | 97 | 0.77% |
| 1940 | 9,501 | 65.89% | 4,683 | 32.48% | 236 | 1.64% |
| 1936 | 5,196 | 39.57% | 6,931 | 52.78% | 1,005 | 7.65% |
| 1932 | 3,132 | 26.10% | 8,372 | 69.77% | 495 | 4.13% |
| 1928 | 6,948 | 62.48% | 3,938 | 35.41% | 235 | 2.11% |
| 1924 | 3,130 | 31.27% | 552 | 5.51% | 6,328 | 63.22% |
| 1920 | 6,246 | 79.74% | 745 | 9.51% | 842 | 10.75% |
| 1916 | 3,371 | 64.84% | 1,614 | 31.04% | 214 | 4.12% |
| 1912 | 2,035 | 45.61% | 1,528 | 34.24% | 899 | 20.15% |
| 1908 | 3,491 | 65.73% | 1,576 | 29.67% | 244 | 4.59% |
| 1904 | 4,091 | 75.68% | 1,050 | 19.42% | 265 | 4.90% |
| 1900 | 3,864 | 74.78% | 1,157 | 22.39% | 146 | 2.83% |
| 1896 | 3,328 | 69.41% | 1,318 | 27.49% | 149 | 3.11% |
| 1892 | 2,039 | 51.52% | 1,711 | 43.23% | 208 | 5.26% |
See also
- National Register of Historic Places listings in Clark County, Wisconsin
References
- "2020 Decennial Census: Clark County, Wisconsin". data.census.gov. U.S. Census Bureau. Retrieved July 1, 2022.
- "Find a County". National Association of Counties. Archived from the original on May 31, 2011. Retrieved June 7, 2011.
- Curtiss-Wedge, Franklin (1918). History of Clark County Wisconsin. Chicago and Winona: H.C. Cooper Jr & Co. pp. 35–36. Retrieved June 17, 2022.
- Curtiss-Wedge, p. 36.
- Curtiss-Wedge, p. 37-38.
- "Wisconsin: Individual County Chronologies". Wisconsin Atlas of Historical County Boundaries. The Newberry Library. 2007. Archived from the original on April 14, 2017. Retrieved August 13, 2015.
- Gannett, Henry (1905). The Origin of Certain Place Names in the United States. Govt. Print. Off. pp. 83.
- "Here's How Iron Got Its Name". The Rhinelander Daily News. June 16, 1932. p. 2. Retrieved August 24, 2014 – via Newspapers.com.

- "About Us".
- Leonhardt, Kris (January 4, 2022). "It's electrifying - The advent of Clark County's electrical service". Multi Media Channels LLC. The Sentinel & Rural News.
- "2010 Census Gazetteer Files". United States Census Bureau. August 22, 2012. Retrieved August 2, 2015.
- "NASA Earth Observations Data Set Index". NASA. Archived from the original on May 10, 2020. Retrieved January 30, 2016.
- "U.S. Decennial Census". United States Census Bureau. Retrieved August 2, 2015.
- "Historical Census Browser". University of Virginia Library. Retrieved August 2, 2015.
- Forstall, Richard L., ed. (March 27, 1995). "Population of Counties by Decennial Census: 1900 to 1990". United States Census Bureau. Retrieved August 2, 2015.
- "Census 2000 PHC-T-4. Ranking Tables for Counties: 1990 and 2000" (PDF). United States Census Bureau. April 2, 2001. Archived (PDF) from the original on October 9, 2022. Retrieved August 2, 2015.
- "State & County QuickFacts". United States Census Bureau. Archived from the original on June 6, 2011. Retrieved January 18, 2014.
- "U.S. Census website". United States Census Bureau. Retrieved May 14, 2011.
- "Language Map Data Center".
- "Annual Wisconsin Birth and Infant Mortality Report, 2017 P-01161-19 (June 2019): Detailed Tables". Archived from the original on June 19, 2019. Retrieved June 19, 2019.
- thearda.com 2010 County Membership Report data
- Donald B. Kraybill, Karen M. Johnson-Weiner, Steven M. Nolt: The Amish. Baltimore: Johns Hopkins University Press, 2013, p. 142.
- Leip, David. "Dave Leip's Atlas of U.S. Presidential Elections". uselectionatlas.org. Retrieved November 9, 2020.
Further reading
- Biographical History of Clark and Jackson Counties, Wisconsin. Chicago: Lewis Publishing, 1891.
- Clark County: The Garden of Wisconsin. Neillsville, Wis.: Satterlee and Tifft, 1890.
- Curtiss-Wedge, Franklyn (comp.) History of Clark County Wisconsin. Chicago: H. C. Cooper, Jr., 1918.
External links
- Clark County government website
- Clark County Economic Development Corporation
- Clark County map from the Wisconsin Department of Transportation
Places adjacent to Clark County, Wisconsin | ||||||||||||||||
|---|---|---|---|---|---|---|---|---|---|---|---|---|---|---|---|---|
| ||||||||||||||||
Municipalities and communities of Clark County, Wisconsin, United States | ||
|---|---|---|
County seat: Neillsville | ||
| Cities |  | |
| Villages | ||
| Towns | ||
| CDPs | ||
| Unincorporated communities | ||
| Ghost towns | ||
| Indian reservation |
| |
| Footnotes | ‡This populated place also has portions in an adjacent county or counties | |
| ||
Authority control | |
|---|---|
| General | |
| National libraries | |
| Other | |
На других языках
[de] Clark County (Wisconsin)
Das Clark County[1] ist ein County im US-amerikanischen Bundesstaat Wisconsin. Im Jahr 2010 hatte das County 34.659 Einwohner und eine Bevölkerungsdichte von 11 Einwohnern pro Quadratkilometer.[2] Der Verwaltungssitz (County Seat) ist Neillsville.[3]- [en] Clark County, Wisconsin
[ru] Кларк (округ, Висконсин)
Округ Кларк (англ. Clark County) располагается в США, штате Висконсин. По состоянию на 2010 год, численность населения составляла 34 690 человек. Был основан 6-го июля 1853 года, получил своё название в честь американского исследователя и территориального губернатора Уильямa Кларкa.Другой контент может иметь иную лицензию. Перед использованием материалов сайта WikiSort.org внимательно изучите правила лицензирования конкретных элементов наполнения сайта.
WikiSort.org - проект по пересортировке и дополнению контента Википедии